Oat growth under different nitrogen doses in eucalyptus alley
cropping system in subtropical Brazil
1Crescimento da aveia submetida a doses de nitrogênio em agrofloresta com eucaliptos
no subtrópico brasileiro
Leonardo Deiss2*, Anibal de Moraes3, Adelino Pelissari3, Francisco Skora Neto4, Vanderley Porfírio da Silva5 e Veruschka Rocha Medeiros Andreolla2
ABSTRACT - Plant growth analysis was performed to determine how oat (Avena sativa L. cv. IPR 126) cultivated for grain responds to the eucalyptus (Eucalyptus dunnii Maiden) alley cropping system (ACS) in subtropical Brazil. The hypothesis of this work was that oat growth response is not modified by nitrogen at distances relative to 4 year old eucalyptus tracks in the ACS. The objective of this study was to determine how the oat growth was influenced by nitrogen doses (12 and 80 kg N ha-1) at five equidistant positions between two adjacent eucalyptus double line tracks [20 m (4 m x 3 m)] in ACS and traditional no-till farming. The experiment was conducted in a split-block randomized block design with four replicates. It was evaluated the oat relative growth rate, unit leaf rate, leaf weight fraction, panicle phytomass, panicle relative filling rate and grains-to-panicle ratio. Nitrogen doses altered the growth response differently in positions relative to the adjacent eucalyptus tracks; therefore, different nitrogen doses should be used in positions relative to the trees to improve oat growth in ACS in Subtropical Brazil.
Key words:Avena sativa.Eucalyptus dunnii. Agricultural integrated systems. Growth analysis. Agroforestry.
RESUMO - Foi realizada uma análise de crescimento para verificar como a aveia (Avena sativa L. cv. IPR 126) cultivada para grãos responde a um sistema agroflorestal (SAF) com eucaliptos (Eucalyptus dunnii Maiden) no subtrópico brasileiro. A hipótese deste trabalho é que a resposta de crescimento da aveia não é modificada pelo nitrogênio em distâncias relativas a faixas de eucaliptos. O objetivo deste estudo foi determinar como o crescimento da aveia é influenciado por níveis de nitrogênio (12 e 80 kg ha-1 de N) em cinco posições equidistantes entre faixas de linhas duplas de eucaliptos [20 m (4 m x 3 m)] em SAF e em agricultura tradicional de plantio direto. O experimento foi em faixas no delineamento de blocos ao acaso com quatro repetições. Foram avaliadas as taxas de crescimento relativo e de assimilação líquida, fração de massa foliar e taxa de enchimento relativo da panícula. O nitrogênio alterou a resposta do crescimento diferentemente em posições relativas às faixas de árvores, portanto diferentes doses de nitrogênio devem ser utilizadas nestas posições para aumentar o crescimento da aveia.
Palavras-chave:Avena sativa.Eucalyptus dunnii. Sistemas integrados agropecuários. Análise do crescimento. Sistema agroflorestal.
*Autor para correspondência
1Recebido para publicação em 27/01/2014; aprovado em 20/06/2014
Extraído da Dissertação do primeiro autor, este trabalho foi auxiliado por bolsa de produtividade em pesquisa do CNPq e pelo Projeto de Redes Nacionais de Pesquisa em Agrobiodiversidade e Sustentabilidade Agropecuária/REPENSA, Processo 562688/2010-2, trabalho resultante do termo de cooperação técnica SAIC/AJU nº 21500.10/0008-2 firmado entre IAPAR e Embrapa Florestas
2Programa de Pós Graduação em Agronomia/Produção Vegetal, Universidade Federal do Paraná/UFPR, Rua dos Funcionários, 1.540,
Curitiba-PR, Brasil, 80.035-050, [email protected], [email protected]
3Departamento de Fitotecnia e Fitossanitarismo, Universidade Federal do Paraná/UFPR, Rua dos Funcionários, 1.540, Curitiba-PR, Brasil,
80.035-050, [email protected], [email protected]
INTRODUCTION
A crop yield reflects how the crop expresses its genetic potential and how it allocates resources at each stage of development, in response to its environmental availability. In an agroforestry system, the annual crop growth response is dependent on a range of facilitative and competitive relationships that are mainly influenced by the trees, which promote biotic and abiotic changes in the agroecosystem. Interactions between species in integrated systems include aspects of water and nutrient cycles, microclimate and biodiversity
(QUINKENSTEIN et al., 2009). Growth analysis is
a tool that can be used to help understand how these relationships promote or do not promote changes in the crop cycle to support productive responses.
The central parameter in plant growth analysis is the relative growth rate (RGR), which is composed of the unit leaf rate (ULR), specific leaf area (SLA) and leaf weight
fraction (LWF) (HUNTet al., 2002). The RGR measures
plant growth efficiency, the ULR is a physiological trait that reflects the plant’s balance between photosynthesis and respiration per unit of leaf area (USECHE; SHIPLEY, 2010) or mass (REICHet al., 2003), the SLA is a morphological trait that reflects the area for light interception per unit of mass invested in leaves (USECHE; SHIPLEY, 2010), and the LWF measures the productive investment in the relative expenditure on potentially photosynthetic organs (HUNT, 2003).
The arboreal component of agroforestry systems promotes interference in the annual crop community, which can be negative or positive. In this sense, agronomic practices commonly used for the annual crop must be readapted in view of the interaction between the species in the integrated systems. The net result of synergistic and antagonistic interactions among the components results on the system productivity (JOSE; GILLESPIE; PALLARDY, 2004).
Oats under full daylight experienced reduced leaf areas and increased root allocation in comparison to oats with partial light availability, and nutrient stress increased root production with a concomitant reduced leaf mass allocation (SEMCHENKO; ZOBEL, 2005). The response to an intense interspecific competition for nitrogen is positively related to the plant’s ability to minimize RGR plasticity, when nitrogen availability is reduced (USECHE; SHIPLEY, 2010).
Annual crop response to ACS is year-dependent because of variable interference promoted by perennial component growth. The hypothesis of this work was that oat growth response is not modified by nitrogen at distances relative to four year old eucalyptus tracks in the
ACS. The objective of this study was to determine how oat (Avena sativaL. cv. IPR 126) growth is influenced by nitrogen doses in positions relative to adjacent eucalyptus (Eucalyptus dunnii Maiden) tracks in an ACS and traditional no-till farming (AGR) in subtropical Brazil. The oat IPR 126 is a cultivar with the ability to act as forage and cover crop; however, all aspects of growth from its emergence until the end of its cycle were addressed in this work.
MATERIAL AND METHODS
This study was carried out in Ponta Grossa, Paraná, Brazil (25°06’19” S 50°02’38” W, 1020 m above mean sea level). According to the Köppen classification system, the climate is temperate, with no definite dry season, and the average total annual rainfall, temperature, evapotranspiration and relative humidity are between 1600 to 1800 mm, 17 to 18 °C, 900 to 1000 mm and 70 to
75%, respectively (CAVIGLIONEet al., 2000).
According to Soil Survey Staff (2010), the soil is classified as a Perox Haploperox. Soil samples were collected at 0-0.20 m depth at a positions level as described below and were collected into a composite sample for the whole experimental area. Soil analysis
revealed the following attributes: pH (CaCl2) of 4.9;
4.43, 0.13, 3.07, 2.47 and 0.12 cmolc dm-3 of H++Al+3, Al+3, Ca+2, Mg+2 and K+, respectively; 6.65 mg dm-3 of available P (Mehlich-1), 26,4 g dm-3 and 447g kg-1 of C and clay, respectively.
The ACS trees wereEucalyptus dunniiMaiden,
which were planted in 2007 in double line tracks. AGR was used as a control to compare the predominant form of agriculture in the region and was located next to the arborized system (less than 200 m). Both systems were previously native grassland and had similar cultural histories.
The tree tracks were positioned at a guideline level, in which the track located in the center of the slope, was made in level, and other adjacent tracks were placed in parallel up and down the slope. The spacing between two adjacent tree tracks (intercropped track) along the guideline level direction was 20 m, the distance between two adjacent rows in a track was 4 m, and the distance between two trees in a row was 3 m.
physical limitation related to agricultural implement measurements, making oat tracks that were 18 m long.
Six days prior to sowing the oats, glyphosate (0,9 kg ae ha-1) was applied to eliminate the remaining weeds from corn (Zea mays L.), which was the preceding crop. The oats (Avena sativa L. cv. IPR 126) were sown
under a no-till system at 40 kg seeds ha-1and were
fertilized at 300 kg ha-1 of 04-30-10 (N-P
2O5-K2O) on June 16, 2011. Seedling emergence occurred ten days after sowing, and this date was used as a reference. During the oat cycle, metsulfuron-methyl (2,4 g ai ha-1) was applied to control weeds before the tillering stage and pyraclostrobin + epoxiconazole (183 g ai ha-1) was applied to control diseases at the booting stage.
The experiment was carried out in a split-block, which each treatment set was placed in a randomized complete block design arrangement, with four replicates that included two doses of nitrogen (12,0 and 80,0 kg N ha-1). The blocks were set as main plots and six positions (five positions between two eucalyptus tracks and one outside the system) were used as split-blocks. At the tillering stage, which started 28 days after emergence (DAE), additional nitrogen in urea form (46% N) was uniformly hand-applied (68,0 kg N ha-1) or not-applied (0,0 kg N ha-1). There were 14 rows of split-blocks that were 5 m long with 18 cm between the rows. A 0,4 m border was left on each split-block side.
The five positions between the eucalyptus tracks and one outside the intercropping system were denoted A, B, C, D and E for ACS and F for AGR. The positions within the integrated system with trees (A_E) were the distances between the tree tracks. The letter A represented the lowest elevation of the slope and the letter E was the highest elevation of the slope. This designation is always valid because the system was implemented with a guideline level. Therefore, the distances, which are denoted here as positions, represent the oats growing at A: 2,8 m, B: 6,4 m, C: 10,0 m, D: 13,6 m and E: 17,2 m away from the track positioned at the lowest elevation of the slope between two adjacent eucalyptus double line tracks.
For the growth analysis, an area (12,6 m-2) of split-blocks was subdivided into seven crescent portions (0,3 m for the first portion with an increment of 0,1 m for those that followed, until 0,9 m for the last) for sampling over time during the oat cycle. The samples were taken from the central position of each portion (as described below).
Oat growth was assessed by harvesting 1 m-1
on seven sampling dates during the oat cycle. The oat development stages at the sample times were as follows: leafy at 21 DAE, tillering at 42 DAE, tillering peak at 63 DAE, elongation start at 84 DAE, booting/flowering at 105 DAE, grain filling at 126 DAE and maturation at 152 DAE.
The plants were uprooted to enable tiller identification, and the roots were then cut for dry matter determination. One meter was collected from a central position of the portion designated for each sample (as described above), by placing a 1,8 m long by 10 cm wide rectangular cast iron (positioned perpendicular to the tracks of trees) made up of 10 crop rows with a length of 10 cm.
All one meter plants were collected, counted and separated into the main shoot and tillers and each sample was divided into leaves, shoots (stems) and senescent material in the vegetative stages, and panicles in the reproductive stages, dried at 65 °C and weighed after reaching a constant weight. Panicle dry weights were evaluated at 126 and 152 DAE. The grains were threshed in a motorcycle tire chamber and separated from other materials (rachis, branches, and glumes) with a pressurized air blower. The grains were re-dried at 65 °C and weighed after reaching a constant weight. The grain-to-panicle ratio was determined at 152 DAE.
The oat phytomass per plant was determined from the product of the phytomass per square meter and the total number of plants per square meter. The growth data analysis was performed according to
classical approach (HUNTet al., 2002).
From the oat phytomass per plant, the RGR (mg mg-1 day-1) was calculated by using the following equation (HUNTet al., 2002):
RGR = (1/W) ( W/ t) = (lnW
2– lnW1)/(t2- t1) (1)
where:W1 andW2 are the total dry weights in milligrams of the whole plant at timest1 andt2.
A mass basis (REICH et al., 2003) was used
to calculate ULR (mg mg-1 day-1) using the following equation (HUNTet al., 2002):
ULR = [(W
2–W1) (lnL W2– lnL W1)]/[(L W2–L W1) (t2-t1)] (2)
where:LW1 andLW2 are the leaf dry weights in milligrams of the whole plant.
LWF (mg mg-1) was determined by using the
following equation (HUNTet al., 2002):
LWF =L
W/W = (LW1/W1 + LW2/W2)/2 (3)
By substituting the total dry weigh per plant in equation 1, the panicle relative filling rate (PRFR)
(mg mg-1 d-1) from 126 to 152 DAE was determined by
taking panicle dry weight in milligrams.
of nitrogen (supply or non-supply of additional nitrogen upon tillering) and positions (five positions between two eucalyptus tracks and AGR). Other analyses were performed as described, excluding AGR, to test the effects inside the integrated system. The block and its interactions were treated as random effects. To verify the distribution of a set of data, the Shapiro-Wilk test was used at = 0,01 significance. Differences between the means from the nitrogen effect were determined using the Duncan method at = 0,05 significance. To compare the AGR means (control treatment) with positions inside the ACS, the Dunnett two-sided method was used at = 0,05 significance. To find significant position effects inside the ACS, simple regression analyses for linear, quadratic and cubic polynomial degrees were determined. The mathematical models were chosen according to the equations with the best fit, confirmed by the higher determination coefficients and the significance of the regression F test until 5% probability, or the lowest value of significance when it was above 5%.
RESULTS AND DISCUSSION
During early oat development, it was possible to perceive the tree interference on the annual crop, which reduced RGR as the crop plants approached the trees. The tree canopies are relatively transparent to far red light from direct sun-light because the chlorophylls present in green leaves absorb principally wave-lengths corresponding to the color red (TAIZ; ZEIGER, 2010). Plants sense changes in the ratio of red to far red light through phytochromes and respond to shading by elongating and altering their architecture (STAMM; KUMAR, 2010). However, shade avoidance was not sufficient to increase the RGR closest to the trees at a greater degree than the RGR farther away from trees until 21 DAE (p = 0,006) (Figure 1a).
After additional nitrogen application at the tillering phase, the nitrogen effect could be observed by increasing the RGR both in the systems comparison until 84 DAE
(42 DAE P = 0,02; 63 DAE P = 0,0004; 84 DAE P =
0,089); and within ACS until 63 DAE (42 DAEP = 0,04;
63 DAE P = 0,001), the ULR until 84 DAE in the systems
comparison (42 DAEP = 0,011, 63 DAEP = 0,017, 84
DAEP = 0,077), as well as the LWF at 63 DAE inside
ACS (P= 0,09). Growth limiting responses promoted by
shade in comparison to full sunlight has only occurred in wild rice (Zizania palustris L.) following nitrogen addition
(SIMS et al., 2012). Until 84 DAE, small differences
occurred between the growth traits (RGR, ULR and LWF) in the systems comparison (positions), with the exception of the lower RGR (P = 0,017) and ULR (P = 0,016) at 42
DAE at positions A and B in the ACS when compared to the AGR (Tables 1, 2 and 3).
After oat post heading was observed at 105 DAE, lodging occurred in the central and intermediate positions inside the ACS and AGR. The clearest evidence of lodging damage on oat growth were found in the RGR (P = 0,04) and ULR (P = 0,045) reduction at 105 DAE at positions C and F, where 80 kg N ha-1 was applied. The RGR became more expressive in the systems comparison at 105 DAE with the lower nitrogen dose (Tables 1 and 2). In wheat, the earlier lodging promoted grain filling losses, due to the blockage flow from the conducting vessels and the smaller plant photosynthetic rates (ESPINDULAet al., 2010). The lodging was possibly also responsible for a reduction in both RGR (P = 0,007) and ULR (P = 0,005) at 126 DAE between positions B and C inside the ACS (Figures 1a and 1c).
In the ACS at 105 DAE (P = 0,02), the LWF started to have a subtle linear increase from the lowest to the highest slope elevation between two adjacent tree tracks,
which remained until 126 DAE (P = 0,02) (Figure 1d).
The lower nitrogen dose increased LWF both at 105 (P = 0,02 andP = 0,007) and 126 (P = 0,02 andP = 0,02) DAE, both in the system comparison and inside ACS, as well as
at 152 DAE (P = 0,08) only in the systems comparison.
Wheat growing in the 5 m by 20 m Paulownia (9 years old) (Paulownia x ‘Tomentosi-fortunei 33’) intercropping system did not change in its estimated saturated leaf photosynthetic rate (Pmax) for flag leaves, compared to the outside of the intercropping system, and Pmaxduring flowering inside ACS was not different from that during grain filling but was higher than during maturation (LIet al., 2008). Seven days prior to anthesis, the photosynthetically active radiation intercepted by wheat could explain 97% of the variation in the grain numbers inside and outside the system (LI et al., 2008). This finding highlights the importance of having a photosynthetic apparatus to enable the maximum contribution for grain filling during the reproductive phase (Table 3).
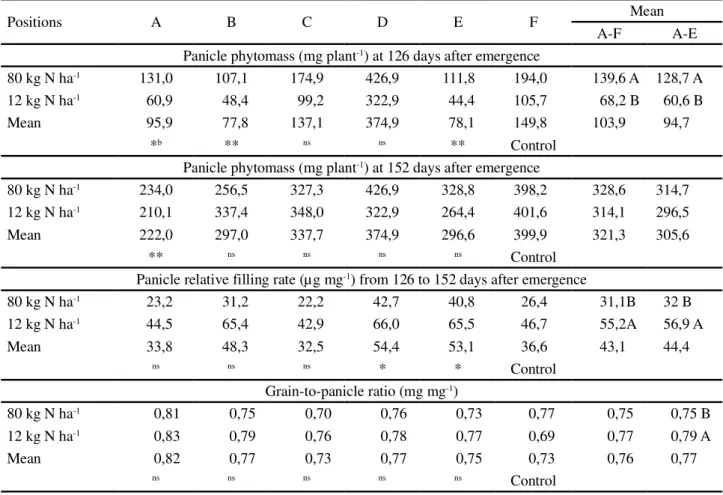
At 126 DAE (P = 0,006), the panicle phytomass was higher where the higher nitrogen dose was applied, possibly because of the increased growth rates promoted by this nitrogen dose until 84 DAE, and the AGR did not differ in terms of panicle phytomass at 126 DAE, but only at the central position between two adjacent tree tracks inside the ACS (Table 4). Within the ACS at 126 DAE (P = 0,002), the panicle experienced a subtle increase in phytomass weight as its distance from the trees increased (Figure 1e). The dry-matter accumulation and post-heading growth rate in oats are “associated with grain-yielding ability” (SALMAN; BRINKMAN, 1992).
Figure 1 - Oat (Avena sativa L. cv. IPR 126) growth traits (days after emergence, DAE) a) relative growth rate (RGR, mg mg-1 day-1) (21 DAE: Y = 0,128 + 0,0037 x – 2,38 10-4 x2,R2 = 77,3,P = 0,04; 126 DAE:Y = 0,071 - 0,021 x + 0,0023 x2– 7,08 10-5 x3,R2 = 56,3,
P = 0,20), b) unit leaf rate (ULR, g g-1 day-1) (152 DAE: 80 kg N ha-1: Y = -0,663 + 0,462 x - 0,057 x2+ 0,0019 x3,R2 = 83,7,P = 0,23 and 12 kg N ha-1: Y = 1,29 - 0,341 x + 0,020 x2,R2 = 91,5,P = 0,004), c) ULR (126 DAE: Y = 0,529 - 0,158 x + 0,018 x2– 5,70 10-4 x3,
R2 = 46,1,P = 0,15; 152 DAE:Y = 0,861 - 0,189 x + 0,010 x2,R2 = 75,6,P = 0,02), d) leaf weight fraction (LWF, mg mg-1) (105 DAE: Y = 0,309 + 0,0027 x,R2 = 58,86,P = 0,008; 126 DAE:Y = 0,162 - 0,0029 x,R2 = 55,03,P = 0,088), e) panicle phytomass (PDW, mg plant-1) (126 DAE: Y = 66,6 + 8,94 x – 0,49 x2,R2 = 26,05,P = 0,02) f) panicle relative filling rate (PRFR, mg mg-1 day-1) from 126 to 152 DAE (Y = 0,032 + 0,0012 x, R2 = 44,8,P = 0,002) under nitrogen doses (12,0 kg N ha-1and 80,0 kg N ha-1), in alley cropping agroforestry system, at A: 2,8 m, B: 6,4 m, C: 10,0 m, D: 13,6 m and E: 17,2 m away from track positioned at the lowest elevation of the slope, between two adjacent eucalyptus (Eucalyptus dunniiMaiden) double line tracks [20 m (4 m x 3 m)], in subtropical Brazil. Vertical bars denote standard errors
the systems comparison and inside the ACS (P = 0,04
and P = 0,048). The PRFR of AGR was lower than at
positions D and E (P = 0,037) (Table 4), which was emphasized by the linear increase from position A to position E inside the ACS (P = 0,067) (Figure 1f). The panicle phytomass was unchanged by the nitrogen effect and only position A inside ACS had lighter panicles than
the AGR at 152 DAE (P = 0,089) (Table 4). At 152 DAE,
apositions: at A: 2,8 m, B: 6,4 m, C: 10,0 m, D: 13,6 m and E: 17,2 m away from track positioned at the lowest elevation of the slope, between
two adjacent eucalyptus (Eucalyptus dunniiMaiden) double line tracks [20 m (4 m x 3 m)]. Values followed (within column) by the same capital case and lowercase letters, are not significantly different using the Duncan´s test ( = 0,05).b *, ** andns (within line) indicates the significance
at 0,05, 0,01 and non significant, respectively of the comparison with a control by the Dunnett two sided test.c Means including traditional
no-till farming (A_F) or within alley cropping system (A_E)
Table 1 -Oat (Avena sativa L. cv. IPR 126) relative growth rate under nitrogen doses (12,0 kg N ha-1 and 80,0 kg N ha-1) in alley cropping agroforestry system (A_E) and traditional no-till farming (F) in subtropical Brazil
Positions
Aa B C D E F Mean
Relative growth rate (mg mg-1 day-1) A-Fc A-E
21 days after emergence
80 kg N ha-1 0,13 0,14 0,14 0,13 0,12 0,13 0,13 0,13
12 kg N ha-1 0,14 0,14 0,15 0,12 0,12 0,15 0,14 0,14
Mean 0,14 0,14 0,15 0,13 0,12 0,14 0,13 0,13
ns b ns ns ns ns Control
42 days after emergence
80 kg N ha-1 0,07 0,07 0,08 0,07 0,08 0,1 0,08 A 0,08 A
12 kg N ha-1 0,04 0,05 0,06 0,07 0,06 0,07 0,06 B 0,06 B
Mean 0,06 0,06 0,07 0,07 0,07 0,09 0,07 0,07
* * ns ns ns Control
63 days after emergence
80 kg N ha-1 0,04 0,04 0,04 0,05 0,03 0,05 0,04 A 0,04 A
12 kg N ha-1 0,01 0,03 0,04 0,01 0,01 0,01 0,02 B 0,02 B
Mean 0,02 0,03 0,04 0,03 0,02 0,03 0,03 0,03
84 days after emergence
80 kg N ha-1 0,02 0,04 0,03 0,03 0,04 0,05 0,04 A 0,03
12 kg N ha-1 0,03 0,03 0,01 0,03 0,04 0,03 0,03 B 0,03
Mean 0,02 0,03 0,02 0,03 0,04 0,04 0,03 0,03
105 day safter emergence
80 kg N ha-1 0,04 a 0,03 a 0,02 b 0,03 a 0,03 a 0,01 b 0,03 B 0,03
ns ns ns ns ns Control
12 kg N ha-1 0,03 a 0,03 a 0,04 a 0,03 a 0,03 a 0,05 a 0,04 A 0,03
ns ns ns ns ns Control
Mean 0,03 0,03 0,03 0,03 0,03 0,03 0,03 0,03
126 days after emergence
80 kg N ha-1 0,03 <0,01 0,03 0,02 0,03 0,02 0,02 0,02
12 kg N ha-1 0,04 0,01 0,03 0,03 0,02 0,03 0,03 0,03
Mean 0,03 0,01 0,03 0,02 0,03 0,03 0,02 0,02
ns ns ns ns ns Control
152 days after emergence
80 kg N ha-1 <0,01 0,02 0,01 0,02 0,01 0,01 0,01 0,01
12 kg N ha-1 0,02 0,03 0,01 0,02 0,03 0,02 0,02 0,02
Table 2 -Oat (Avena sativa L. cv. IPR 126) unit leaf rate under nitrogen doses (12,0 kg N ha-1 and 80,0 kg N ha-1) in alley cropping agroforestry system (A_E) and traditional no-till farming (F) in subtropical Brazil
apositions: A: 2,8 m, B: 6,4 m, C: 10,0 m, D: 13,6 m and E: 17,2 m away from track positioned at the lowest elevation of the slope, between two
adjacent eucalyptus (Eucalyptus dunniiMaiden) double line tracks [20 m (4 m x 3 m)]. Values followed (within column) by the same capital case and lowercase letters, are not significantly different using the Duncan´s test ( = 0,05).b *, ** andns (within line) indicates the significance
at 0,05, 0,01 and non significant, respectively, of the comparison with a control by the Dunnett two sided test.c Means including traditional
no-till farming (A_F) or within alley cropping system (A_E)
Positions A
a B C D E F Mean
Unit leaf rate (mg mg-1 day-1) A-Fc A-E
21 days after emergence
80 kg N ha-1 0,16 0,18 0,18 0,17 0,16 0,17 0,17 0,17
12 kg N ha-1 0,21 0,18 0,19 0,16 0,15 0,21 0,18 0,18
Mean 0,19 0,18 0,19 0,16 0,16 0,19 0,18 0,17
42 days after emergence
80 kg N ha-1 0,11 0,11 0,12 0,12 0,12 0,15 0,12 A 0,12
12 kg N ha-1 0,06 0,08 0,1 0,11 0,09 0,12 0,09 B 0,09
Mean 0,09 0,09 0,11 0,12 0,11 0,13 0,11 0,1
**b * ns ns ns Control
63 days after emergence
80 kg N ha-1 0,06 0,07 0,07 0,1 0,05 0,08 0,07 A 0,07
12 kg N ha-1 0,02 0,05 0,12 0,03 0,01 0,01 0,04 B 0,05
Mean 0,04 0,06 0,09 0,06 0,03 0,05 0,06 0,06
84 days after emergence
80 kg N ha-1 0,05 0,09 0,09 0,06 0,09 0,14 0,09 a 0,08
12 kg N ha-1 0,06 0,06 0,01 0,08 0,08 0,07 0,06 B 0,06
Mean 0,06 0,08 0,05 0,07 0,08 0,1 0,07 0,07
105 days after emergence
80 kg N ha-1 0,13 A 0,08 a 0,06 b 0,1a 0,1a 0,05b 0,09 0,1
* ns ns ns ns Control
12 kg N ha-1 0,10 A 0,09 a 0,12 a 0,08 a 0,08 a 0,12a 0,1 0,09
ns ns ns ns ns Control
Mean 0,12 0,09 0,09 0,09 0,09 0,08 0,09 0,09
126 days after emergence
80 kg N ha-1 0,21 0,02 0,3 0,16 0,18 0,17 0,17 0,17
12 kg N ha-1 0,24 0,05 0,15 0,14 0,1 0,21 0,15 0,14
Mean 0,23 0,04 0,22 0,15 0,14 0,19 0,16 0,16
ns ns ns ns ns Control
152 days after emergence
80 kg N ha-1 0,2 A 0,54 a 0,05 a 0 a 0,22 b 0 b 0,17 B 0,2
ns ns ns ns ns Control
12 kg N ha-1 0,43 A 0 a 0 a 0,03 a 1,37 a 1,54 a 0,56 A 0,37
ns ** ** ** ns Control
Mean 0,32 0,27 0,03 0,01 0,79 0,77 0,37 0,28
apositions: A: 2,8 m, B: 6,4 m, C: 10,0 m, D: 13,6 m and E: 17,2 m away from track positioned at the lowest elevation of the slope, between two
adjacent eucalyptus (Eucalyptus dunniiMaiden) double line tracks [20 m (4 m x 3 m)]. Values followed (within column) by the same capital case letters, are not significantly different using the Duncan´s test ( = 0,05).b *, ** andns (within line) indicates the significance at 0,05, 0,01
and non significant, respectively, of theP value of the comparison with a control by the Dunnett two sided test.c Means including traditional
no-till farming (A_F) or within alley cropping system (A_E)
Table 3 -Oat (Avena sativa L. cv. IPR 126) leaf weight fraction under nitrogen doses (12,0 kg N ha-1 and 80,0 kg N ha-1) in alley cropping agroforestry system (A_E) and traditional no-till farming (F) in subtropical Brazil
Positions
Aa B C D E F Mean
Leaf weight fraction (mg mg-1) A-Fc A-E
21 days after emergence
80 kg N ha-1 0,70 0,66 0,69 0,66 0,64 0,67 0,67 0,67
12 kg N ha-1 0,60 0,69 0,70 0,64 0,67 0,62 0,65 0,66
Mean 0,65 0,68 0,69 0,65 0,66 0,64 0,66 0,66
42 days after emergence
80 kg N ha-1 0,69 0,66 0,67 0,6 0,65 0,69 0,66 0,65
12 kg N ha-1 0,63 0,65 0,67 0,64 0,66 0,63 0,65 0,65
Mean 0,66 0,66 0,67 0,62 0,65 0,66 0,65 0,65
63 days after emergence
80 kg N ha-1 0,63 0,58 0,55 0,55 0,6 0,6 0,59 0,58 A
12 kg N ha-1 0,56 0,56 0,51 0,54 0,57 0,61 0,56 0,55 B
Mean 0,6 0,57 0,53 0,55 0,59 0,61 0,57 0,57
nsb ns ns ns ns Control
84 days after emergence
80 kg N ha-1 0,47 0,44 0,40 0,47 0,48 0,44 0,45 0,45
12 kg N ha-1 0,43 0,48 0,40 0,44 0,46 0,53 0,46 0,44
Mean 0,45 0,46 0,40 0,45 0,47 0,49 0,45 0,45
105 days after emergence
80 kg N ha-1 0,28 0,31 0,29 0,32 0,34 0,31 0,31 B 0,31 B
12 kg N ha-1 0,34 0,38 0,35 0,38 0,38 0,41 0,37 A 0,37 A
Mean 0,31 0,35 0,32 0,35 0,36 0,36 0,34 0,34
* ns ns ns ns Control
126 days after emergence
80 kg N ha-1 0,15 0,16 0,14 0,15 0,21 0,14 0,16 B 0,16 B
12 kg N ha-1 0,19 0,23 0,2 0,23 0,24 0,21 0,22 A 0,22 A
Mean 0,17 0,2 0,17 0,19 0,22 0,18 0,18 0,19
ns ns ns ns ns Control
152 days after emergence
80 kg N ha-1 0,04 0,04 0,04 0,03 0,07 0,02 0,04 B 0,04
12 kg N ha-1 0,05 0,07 0,05 0,07 0,07 0,05 0,06 A 0,06
Mean 0,04 0,06 0,04 0,05 0,07 0,03 0,05 0,05
Table 4 -Oat (Avena sativa L. cv. IPR 126) panicle phytomass, panicle relative filling rate and grain-to-panicle ratio, under nitrogen doses (12,0 kg N ha-1 and 80,0 kg N ha-1) in alley cropping agroforestry system (A_E) and traditional no-till farming (F) in subtropical Brazil
apositions: A: 2,8 m, B: 6,4 m, C: 10,0 m, D: 13,6 m and E: 17,2 m away from track positioned at the lowest elevation of the slope, between two adjacent eucalyptus
(Eucalyptus dunniiMaiden) double line tracks [20 m (4 m x 3 m)]. Values followed (within column) by the same capital case letters, are not significantly different using the Duncan´s test ( = 0,05).b *, ** andns (within line) indicates the significance at 0,05, 0,01 and non significant, respectively, of the comparison with a
control by the Dunnett two sided test.c Means including traditional no-till farming (A_F) or within alley cropping system (A_E)
Positions A B C D E F Mean
A-F A-E
Panicle phytomass (mg plant-1) at 126 days after emergence
80 kg N ha-1 131,0 107,1 174,9 426,9 111,8 194,0 139,6 A 128,7 A
12 kg N ha-1 60,9 48,4 99,2 322,9 44,4 105,7 68,2 B 60,6 B
Mean 95,9 77,8 137,1 374,9 78,1 149,8 103,9 94,7
*b ** ns ns ** Control
Panicle phytomass (mg plant-1) at 152 days after emergence
80 kg N ha-1 234,0 256,5 327,3 426,9 328,8 398,2 328,6 314,7
12 kg N ha-1 210,1 337,4 348,0 322,9 264,4 401,6 314,1 296,5
Mean 222,0 297,0 337,7 374,9 296,6 399,9 321,3 305,6
** ns ns ns ns Control
Panicle relative filling rate (µg mg-1) from 126 to 152 days after emergence
80 kg N ha-1 23,2 31,2 22,2 42,7 40,8 26,4 31,1B 32 B
12 kg N ha-1 44,5 65,4 42,9 66,0 65,5 46,7 55,2A 56,9 A
Mean 33,8 48,3 32,5 54,4 53,1 36,6 43,1 44,4
ns ns ns * * Control
Grain-to-panicle ratio (mg mg-1)
80 kg N ha-1 0,81 0,75 0,70 0,76 0,73 0,77 0,75 0,75 B
12 kg N ha-1 0,83 0,79 0,76 0,78 0,77 0,69 0,77 0,79 A
Mean 0,82 0,77 0,73 0,77 0,75 0,73 0,76 0,77
ns ns ns ns ns Control
In addition to the effect described for LWF (described above), where the lower nitrogen dose was applied, the ULR had a greater expression at 152 DAE (P = 0,039) (Tables 2 and 3), and was stronger next to trees inside the ACS (P = 0,099) (Figure 1b). Within the Paulownia-wheat intercropping system, the yield and number of wheat grains could be fully explained by the amount of photosynthetically active radiation intercepted from flowering to grain filling, and during grain filling, which is strongly correlated with the dry weight per 1000 grains (LIet al., 2008). Wheat increased the duration of grain filling in eucalyptus ACS (KOHLI; SAINI, 2003). In addition to the remaining green leaves, the panicles remained green in these same locations at 152 DAE.
In cereals, the yield formation is a result of two processes: development, in which grains are formed and filled; and growth, where the substrate for forming and filling the grains is provided by photosynthesis
(BROWNE; WHITE; BURKE, 2006). During the reproductive phase (post-heading), a significant portion of photosynthesis is performed by the constituents of the oat panicle (JENNINGS; SHIBLES, 1968) or wheat ear
(MAYDUPet al., 2010). In addition to the contribution
of photosynthesis, the translocation of photoassimilates accumulated during the growth should be also considered. In wheat plants, the translocation of storage carbon contributed to grain growth (LIet al., 2008).
Since oats reduce their root allocation under partial light availability and nutrient stress decrease the leaf mass allocation (SEMCHENKO; ZOBEL, 2005), inside the ACS oats accumulated less above-ground phytomass per plant next to the trees. In environments with high interspecific interaction, agronomic practices that improve the photosynthesis performed in the reproductive structure should be valued (e.g., morphological traits: JENNINGS;
filling, the mobilization of the photosynthate produced by panicle constituents affects the grain quality (BROWNE; WHITE; BURKE, 2006).
CONCLUSION
Nitrogen doses alter the growth response differently in positions relative to the adjacent eucalyptus tracks; therefore, different nitrogen doses should be used in positions relative to the trees to improve oat yield potential in the ACS in subtropical Brazil.
REFERENCES
BROWNE, R. A.; WHITE, E. M.; BURKE, J. I. Responses of developmental yield formation processes in oats to variety, nitrogen, seed rate and plant growth regulator and their relationship to quality.Journal of Agricultural Science, v. 144, p. 533–545, 2006.
CAVIGLIONE, J. H. et al. Cartas climáticas do Paraná. Londrina: IAPAR, 2000. 1 CD-ROM. Available in: <http://www. iapar.br/modules/conteudo/conteudo.php?conteudo=677> ESPINDULA, M. C. et al. Nitrogen application methods and doses in the development and yield of wheat. Ciência e Agrotecnologia, v. 34, p. 1404-1411, 2010.
HUNT, R. et al. A Modern Tool for Classical Plant Growth Analysis.Annals of Botany, v. 90, p. 485-488, 2002.
HUNT, R. Plant growth analysis: individual plants. In: Thomas B., Murphy D. J.; Murray D. (eds.)Encyclopedia of Applied Plant Sciences. London: Academic Press. 2003. p. 579-588. JENNINGS, V. M.; SHIBLES, R. M. Genotypic Differences in Photosynthetic Contributions of Plant Parts to Grain Yield in Oats.Crop Science, v. 8, p. 173-175, 1968.
JOSE, S.; GILLESPIE, A. R.; PALLARDY, S. G. Interspecific interactions in temperate agroforestry. Agroforestry Systems, v. 61, p. 237-255, 2004.
KOHLI, A.; SAINI, B. C. Microclimate modification and response of wheat planted under trees in a fan design in
northern India. Agroforestry Systems, v. 58, p. 109-118, 2003.
LI, F.et al. Light distribution, photosynthetic rate and yield in a Paulownia-wheat intercropping system in China.Agroforestry Systems, v. 74, p. 163-172, 2008.
MAYDUP, M. L.et al. The contribution of ear photosynthesis to grain filling in bread wheat (Triticumaestivum L.).Field Crops Research, v. 119, p. 48-58, 2010.
PELTONEN-SAINIO, P. Contribution of enhanced growth rate and associated physiological changes to yield formation of oats.Field Crops Research, v. 33, p. 269-281, 1993. QUINKENSTEIN, A. et al. Ecological benefits of the alley cropping agroforestry system in sensitive regions of Europe.
Environmental Science & Policy, v. 12, p. 1112-1121, 2009. SOIL SURVEY STAFF. Keys to Soil Taxonomy. 11. ed. Washington: USDA-Natural Resources Conservation Service, 2010. 346 p.
REICH, P. B.et al. Variation in growth rate and ecophysiology among 34 grassland and savanna species under contrasting N supply: a test of functional group differences. New Phytologist, v. 157, p. 617-631, 2003.
SALMAN, A. A.; BRINKMAN, M. A. Association of pre- and post-heading growth traits with grain-yield in oats.Field Crops Research, v.28, p.211-221, 1992.
SEMCHENKO, M.; ZOBEL, K. The effect of breeding on allometry and phenotypic plasticity in four varieties of oat (Avena sativa L.).Field Crops Research, v. 93, p. 151-168, 2005. SIMS, L. et al. Nitrogen, phosphorus and light effects on growth and allocation of biomass and nutrients in wild rice.
Oecologia, v. 170, p. 65-76, 2012.
STAMM, P.; KUMAR, P. P. The phytohormone signal network regulating elongation growth during shade avoidance.
Journal of Experimental Botany, v. 61, p. 2889-2903, 2010.
TAIZ, L.; ZEIGER, E. Plant Physiology, 5th ed. Sinauer Associates, Sunderland, MA, 2010. 782 p.