ESTIMATING SUBSOIL RESISTANCE TO NITRATE
LEACHING FROM EASILY MEASURABLE PEDOLOGICAL
PROPERTIES
(1)Fábio Keiti Nakagawa(2), Gabriel Benjamin Siqueira Forti(2), Marcelo Eduardo Alves(3), Arquimedes Lavorenti & Jarbas Honório de Miranda(4)
SUMMARY
Leaching of nitrate (NO3-) can increase the groundwater concentration of this anion and reduce the agronomical effectiveness of nitrogen fertilizers. The main soil property inversely related to NO3- leaching is the anion exchange capacity (AEC), whose determination is however too time-consuming for being carried out in soil testing laboratories. For this reason, this study evaluated if more easily measurable soil properties could be used to estimate the resistance of subsoils to NO3- leaching. Samples from the subsurface layer (20-40 cm) of 24 representative soils of São Paulo State were characterized for particle-size distribution and for chemical and electrochemical properties. The subsoil content of adsorbed NO3- was calculated from the difference between the NO3- contents extracted with 1 mol L-1 KCl and with water; furthermore, NO3 -leaching was studied in miscible displacement experiments. The results of both adsorption and leaching experiments were consistent with the well-known role exerted by AEC on the nitrate behavior in weathered soils. Multiple regression analysis indicated that in subsoils with (i) low values of
remaining phosphorus (Prem), (ii) low soil pH values measured in water (pH
H2O), and (iii) high pH values measured in 1 moL L-1 KCl (pH KCl), the amounts of surface positive charges tend to be greater. For this reason, NO3- leaching tends to be slower in these subsoils, even under saturated flow condition. Index terms: anion exchange capacity, remaining phosphorus, retardation
factor.
(1) Received for publication in September 22, 2011 and approved in July 24, 2012.
(2) Agronomy undergraduate student, Escola Superior de Agricultura "Luiz de Queiroz" - ESALQ/USP. Av. Pádua Dias, 11. CEP
13418-900 Piracicaba (SP). E-mail: [email protected]; [email protected]
RESUMO: ESTIMATIVA DA RESISTÊNCIA DE SUBSOLOS À LIXIVIAÇÃO DE
NITRATO A PARTIR DE PROPRIEDADES PEDOLÓGICAS DE FÁCIL DETERMINAÇÃO
A lixiviação de nitrato (NO3-) pode aumentar a concentração desse ânion no lençol
freático e reduzir a eficiência agronômica dos fertilizantes nitrogenados. A capacidade de troca aniônica (CTA) é a principal propriedade do solo inversamente relacionada à lixiviação de nitrato; todavia a morosidade associada à quantificação da CTA inviabiliza sua determinação em laboratórios dedicados à avaliação da fertilidade do solo. Por essa razão, a presente pesquisa foi conduzida com o objetivo de avaliar se atributos pedológicos mais facilmente determináveis poderiam ser utilizados para estimar resistência de subsolos à
lixiviação de NO3-. Amostras coletadas na camada subsuperficial (20-40 cm) de 24 solos
representativos do Estado de São Paulo foram caracterizadas quanto à granulometria e a
alguns atributos químicos e eletroquímicos. O teor de NO3- adsorvido foi calculado a partir
da diferença entre seus teores extraídos com solução de KCl 1 mol L-1 e com água;
adicionalmente, a lixiviação de NO3- foi estudada por meio de experimentos de deslocamento
miscível. Os resultados foram concordantes com a conhecida importância da CTA tanto
para a adsorção quanto para o retardamento da lixiviação de NO3- em subsolos
intemperizados . Por meio de análise de regressão linear múltipla foi possível observar que subsolos que apresentam (i) baixos valores de fósforo remanescente (Prem), (ii) baixos valores
de pH determinados em água (pH H2O) e (iii) altos valores de pH determinados em solução
de KCl 1 mol L-1 (pH KCl) tendem a apresentar quantidades mais elevadas de cargas
positivas. Por essa razão, a lixiviação de NO3- tende a ser mais lenta nesses subsolos mesmo
sob condição de fluxo saturado.
Termos de indexação: capacidade de troca aniônica, fósforo remanescente, fator de retardamento.
INTRODUCTION
Nitrate (NO3-) is the most oxidized nitrogen form
in non-flooded soils which can be taken up by plants or transported into subterranen aquifers after intense
rainfall or irrigation. This leaching can increase NO3
-concentrations to > 10 mg L-1 N in the groundwater,
making it unsuitable for drinking (Brasil, 2001). Although Addiscott & Benjamin (2004) pointed out that there is no scientific evidence of nitrate-related damages to human health, the main concerns with regard to this anion are associated with its apparent involvement in the development of stomach cancer in adults and of methemoglobinemia in newborns (Addiscott, 2006).
Besides not giving rise to any insoluble products, nitrate, unlike anions such as sulfate and fluoride, occurs as non-complexed or “free” negatively charged
ion (NO3-) in the soil solution. Therefore, the
electrostatic adsorption by the surface positive charges of soil minerals plays an essential role in retarding
NO3- leaching (Ji, 1997; Dynia & Camargo, 1999;
Alcântara & Camargo, 2010; Harmand et al., 2010). However, along with the amount of soil positive surface charges, other factors such as aquifer depth, local rainfall, rate and frequency of N fertilization, N uptake efficiency of crops, irrigation management and soil properties (e.g., porosity, texture and mineralogy) must be taken into consideration to assess the risk of
groundwater contamination by NO3- (Resende, 2002).
Liming and fertilization are essential for crops on
tropical soils, but both practices favor NO3- leaching.
Dynia & Camargo (1999) verified that liming and
phosphate fertilization reduced NO3- adsorption in the
plowed layer of a Brazilian Ferralsol. Similarly, Alcântara & Camargo (2010) observed that applications of carbonate, phosphate and sulfate
favored NO3- leaching in an electropositive Ferrasol.
The effect of liming to reduce NO3- adsorption results
from the increase in the net negative surface charge that occurs in variable charge soils after the pH rises;
on the other hand, the depletion of NO3- adsorption
sites caused by the presence of other anions, e.g., phosphate and sulfate, can be ascribed to the greater preference of the positive surface charges for those
anions than for NO3-. Harmand et al. (2010) observed
that the NO3- adsorption by an Acrisol in Costa Rica
was greater in deeper layers in agreement with the progressive increase in the net positive surface charge that was also observed from the soil surface to a depth of 180 cm.
Although the soil content of clay-size particles is
usually positively correlated with NO3- adsorption,
this straightforward relationship is not always observed due to mineralogical differences among soils.
To evaluate the NO3- fate in soil, it would therefore be
choice could be the so-called remaining phosphorus (Prem) (Bache & Williams, 1971), which is the P concentration that remains in solution after shaking
2.5 g of soil with 25 mL of 0.01 CaCl2 mol L-1
containing 60 mg L-1 P for 1 h (Alvarez V. et al., 2000).
Experimental observations indicated that non-allophanic kaolinitic soils usually have high Prem values, which decrease when the soil becomes richer in gibbsite and iron oxides. In general, minerals such as gibbsite and goethite are more abundant in highly weathered soils; since these minerals have surface – OH groups that can be protonated and high values of point zero charge (PZC), the number of positive surface charges tends to be higher in gibbsite- and goethite-rich soils even at moderate acidity. It can therefore be concluded that soils with low Prem values can adsorb greater amounts of anions through both inner-and outer-sphere complexations. The advantage of using Prem as anion-adsorption index can be ascribed to its simpler and faster determination and to its greater dependence on soil mineralogy than on soil texture (Alves & Lavorenti, 2004).
Considering that: (i) the minerals gibbsite,
hematite, and goethite are the main anion adsorbents in non-allophanic tropical soils and that their contents
increase as these soils weather; (ii) both the point of
zero charge (PZC) and soil pH values influence the sign and amount of electrical charges in the soil
mineral surfaces; and (iii) that the higher amounts of
negative surface charges and of anions such as carbonate, phosphate and sulfate usually found in the soil suface (0-20 cm) disfavor nitrate adsorption, it can be assumed that acidic subsoils with greater oxide amounts and, for this reason, low Prem values, are
able to adsorb more NO3- than acidic subsoils richer
in kaolinite. In this context, the purpose of this study was to evaluate the potential of Prem together with
soil pH values measured in water (pH H2O) and in 1
mol L-1 KCl (pH KCl) for predictions related to the
delay of NO3- leaching from subsurface layers of
Ferralsols and Acrisols.
MATERIAL AND METHODS
Soils
Twenty four samples were taken from the subsoil (20-40 cm) of Ferralsols and Acrisols at different locations in São Paulo State, air-dried, ground and passed through a 2-mm sieve. The soil contents of oxidizable carbon and clay-size particles were evaluated using the the Walkley-Black and the pipette method, respectively, whereas the soil particle density was determined through the pycnometer procedure (Embrapa, 1997). (Embrapa, 1997). The Si, Fe and Al contents associated to secondary minerals were
determined after boiling the soil samples in 9 mol L-1
H2SO4 at a solid/solution ratio of 1:20 (Embrapa, 1997);
from the results, the weathering indices Ki (SiO2/
Al2O3, mol mol-1) and Kr [SiO2/(Al2O3 + Fe2O3), mol
mol-1] were calculated. Oxalate-extractable Fe and Al
(Feo and Alo) contents were also determined according
to Buurmanet al. (1996).
The soil pH values were measured in water (pH
H2O), 0.01 mol L-1 CaCl2 (pH CaCl2) and 1 mol L-1
KCl (pH KCl) at a solid/liquid ratio of 1:2.5 (Embrapa, 1997). Remaining phosphorus (Prem) was determined as proposed by Alvarez V. et al. (2000), by shaking
2.5 g of soil with 25 mL of 0.01 mol L-1 CaCl
2,
containing 60 mg L-1 P for 1 h, and analyzing the
filtered solutions for P by the blue molybdenum method of Murphy & Riley (1962).
The cation and anion exchange capacities (CEC and AEC) were determined by saturating the soils
with the ions Ca2+ and Cl- through successive shakings
and centrifugations of 2 g of soil with 20 mL of
unbuffered 0.01 mol L-1 CaCl
2 in 50-mL centrifuge
tubes. When the Ca2+ and Cl- concentrations in the
supernatants reached 0.02 molc L-1, the ions were
desorbed in two extractions with 15 mL of 0.5 mol L-1
MgSO4. Both extracts were combined in flasks filled
to the 50-mL mark with the extractantand analyzed
for Ca2+ by atomic absorption spectrophotometry and
for Cl- by colorimetry (Florence & Farrar, 1971). The
soil CEC and AEC values were calculated, respectively,
from the respective amounts of Ca2+ and Cl
-determined after subtraction of the contributions of these ions in the entrapped solutions; whose volumes were calculated as the difference between the masses of the tubes containing the soils weighed before the first application of the saturated solution and after the last centrifugation and discarding of the supernatant.
Nitrate adsorption and leaching
To assess NO3- adsorption, 2.5 g of air-dried and
sieved (φ < 2 mm) soil and 25 mL of 1 mol L-1 KCl
were transferred to 50-mL centrifuge tubes that were shaken for 2 h and centrifuged. The supernatants were
analyzed for NO3- according to Yanget al. (1998). The
same procedure was repeated using water as extractant. The adsorbed nitrate was considered equal
to the difference between the KCl- and H2O-extractable
NO3- soil contents (Ryan et al., 2001).
Leaching experiments were carried out in pre-weighed PVC tubes (internal diameter 5 cm) with a fine stainless steel screen, lined with geotextile
(bidim®) attached to the bottom. After being packed
with 20 cm of air-dried sieved (φ < 2 mm) soil and
“weighed, each PVC tube was vertically immersed from its bottom in 13,5 cm of deionized (DI) water for 24 h;” afterwards, the column was hold in a support and DI water was dripped for more 24 h to give rise to a 1-cm liquid layer on the soil surface, which was kept with a lateral drain. When the flow became constant in the soil column, the water was replaced
KNO3 and 25-mL effluent fractions were collected in the column bottom until their nitrate concentrations
become equal to 50 mg L-1. The C/C
0 ratios,
calculated from the nitrate concentrations of the
effluent (C) and influent solutions (C0, 50 mg L-1)
were submitted with their respective cumulative numbers of pore volume to the software Disp (Borges Jr. & Ferreira, 2006) for the calculation of the nitrate retardation factor from the numerical solution of the onedimensional convective-dispersive ion transport equation proposed by van Genuchten & Wierenga (1986): x v x D t R ¶ ¶ -¶ ¶ = 
¶ Cr
2 r C 2 r C (1)
where R is the retardation factor, Cr is the ion
concentration in the soil solution (mg L-1), t is the
time (min), D is the dispersive-diffusive coefficient (m2
min-1), x is the distance from soil surface (m), and v
is the flow velocity (m min-1).
The total volume occupied by pores in each soil column was calculated by multiplying the soil volume
(392.7 cm3) by the soil porosity, which in turn was
calculated as 1 - (ρb - ρp), where ρb is the soil bulk
density calculated as the ratio of soil weight by the
soil volume in the PVC tube, and ρp is the soil particle
density.
Statistical analyses
The experimental results were subjected to simple linear correlation and to multiple regression analyses using the Statistical Analysis System - SAS version 9.1 (SAS, 1994).
RESULTS AND DISCUSSION
Soil characterization
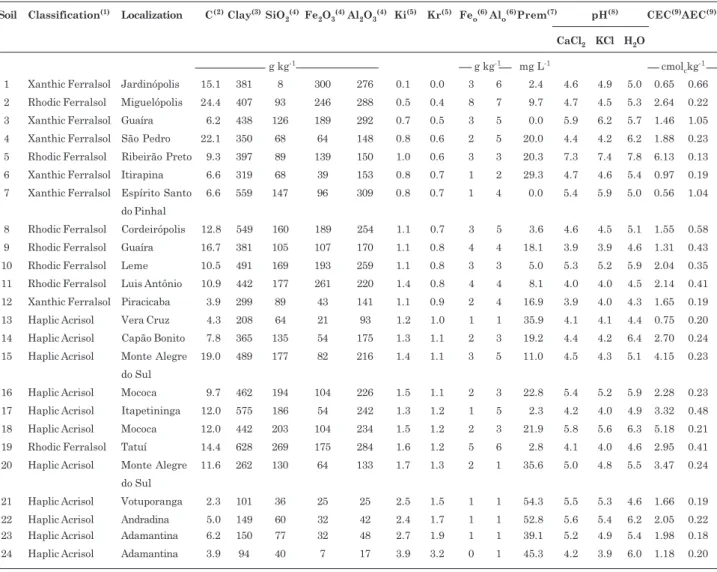
The classification, localization and the evaluated properties of the studied subsoils (Table 1), show that
most of them were clayey (clay > 350 g kg-1) and acidic
(pH CaCl2 < 5.5) (Embrapa, 2006). The sample from
Adamantina (soil 24) was the least weathered (Ki = 3.9; Kr = 3.2) whereas the sample from Jardinópolis (soil 1) was the most weathered one (Ki = 0.1; Kr = 0); these conclusions were based on
the fact that the 9 mol L-1 H
2SO4 digestion dissolves
all soil minerals but quartz. Therefore, the richer in oxides such as gibbsite, hematite, and goethite the soil is, the lesser will be its Ki and Kr values; on the other hand, for soils richer in minerals such as vermiculite, illite, and kaolinite the greater Si contents determined after the sulfuric digestion give rise to higher Ki and Kr values (Embrapa, 2006). Considering the Kr values as an approximate criterion to discriminate kaolinitic (Kr > 0.75) from oxidic (Kr < 0.75) tropical soils (Embrapa, 2006), it
can be inferred that kaolinite was the most abundant mineral in the clay and silt fractions in 16 of the 24 subsoils. The Fe and Al contents extracted with the ammonium oxalate solution ranged from 0 (soil 24) to
8 g kg-1 (soil 2) for Fe and from 1 (soils 13, 20, 21, 22,
23, and 24) to 7 g kg-1 (soil 2) for Al. The Prem values
varied from 0 (soils 3 and 7) to 54.3 mg L-1 (soil 21)
with a mean value of 19.9 mg L-1 and were inversely
correlated with the soil contents of Fe-H2SO4 (r =
-0.70**), Al-H2SO4 (r = -0.93**), Feo (r = -0.56**), and
Alo (r = -0.88**), and positively correlated with the
weathering indexes Ki (r = 0.71**) and Kr (r = 0.66**).
These correlations indicate that Prem can be a suitable estimator of the soil content of Fe and Al oxides. An example of the dependence of Prem on the soil mineralogy can be observed in the soils 1 and 9, which
had equal contents of clay-size particles (381 g kg-1)
but quite different Prem values (2.4 and 18.1 mg L-1,
the lower value in the more oxidic soil). Furthermore, the coefficient of variation of the Prem values among the studied samples was high (84 %); this indicates a great capacity of discriminating the subsoils according to the Fe and Al oxide contents.
The oxidizable carbon (OC) contents in the subsoils
ranged from 2.3 g kg-1 for the Haplic Acrisol of
Votuporanga (soil 21) to 24.4 g kg-1 for the Rhodic
Ferralsol of Miguelópolis (soil 2), with a mean value
of 10.6 g kg-1. No correlation was observed between
the OC contents and the values of cation and the anion exchange capacities (CEC and AEC). On the other hand, the CEC values were directly correlated with
the soil pH measured in water (r = 0.55**) and in
0.01 mol L-1 CaCl
2 (r = 0.47*).
The subsoil AEC ranged from 0.13 (soil 5) to 1.05
cmolc kg-1 (soil 3), with a mean value of 0.35 cmol
c kg-1,
and was correlated with Prem (r = -0.63**) and with
the contents of clay (r = 0.49**), Fe-H2SO4r = 0.44**),
Al-H2SO4 (r = 0.63**) and Alo (r = 0.42**). No
correlation was observed between AEC and the soil pH
measured in water, 0.01 mol L-1 CaCl
2 or 1 mol L-1 KCl.
The multiple regression of AEC with Prem, pH
KCl and pH H2O (Table 2) showed that these variables
explained 52 % of the AEC variation among the studied soils. According to Neter et al. (1990), when the predictor variables of a multiple regression model are correlated to each other, multi-collinearity is said to exist. In this case, the following problems can occur:
(i) parameter estimates may not be significant, despite
the existence of a definite statistical relationship, and
(ii) a parameter estimate may have a sign different
from the expected. Multi-collinearity can be detected by calculating the variance inflation factors (VIF), which measure the inflation of the variances for the regression coefficients above the expected if there is no correlation among the predictor variables; a VIF
value >10 indicates the presence of strong
coefficients are in real agreement with their expected individual effects on AEC. The negative signs of Prem
and pH H2O show that the AEC increases as both
decrease, i.e., the AEC increases as the soil becomes
oxide-richer (low Prem) and more acidic (low pH H2O)
since both situations increase the number of protonated
hydroxyl surface groups (-OH + H+ OH
2+); furthermore, the AEC increases as the soil pH KCl values become higher, which can be ascribed to the positive correlation observed between the point of zero charge and the pH KCl values of Ferralsols and Acrisols with low contents of exchangeable Al and organic matter (Alves & Lavorenti, 2005). Therefore, despite the low value calculated for the determination
coefficient (R2) of the regression model, which could
be improved by increasing the experimental dataset used for the fitting (Cagliari et al., 2011), the obtained Parameter Estimate Standard t value prob>t VIF(1)
error
a0 0.57062 0.25264 2.26 0.0352 0.00 a1 -0.00850 0.00223 -3.82 0.0011 1.04 a2 -0.14204 0.05744 -2.47 0.0225 1.67 a3 0.15083 0.05353 2.82 0.0106 1.63
Table 2. Results of the multiple regression analysis relating the anion exchange capacity (AEC) to remaining phosphorus (Prem), soil pH measured in water (pH H2O), and soil pH measured in 1 mol L-1 KCl (pH KCl)
AEC = a0 + a1 Prem + a2 pH H2O + a3 pH KCl; F-value = 9.32; prob>F = 0.0005; R2 = 0.52; n=24. (1) VIF: variance inflation
factor.
Soil Classification(1) Localization C(2)Clay(3)SiO 2
(4)Fe 2O3
(4)Al 2O3
(4) Ki(5) Kr(5) Fe o
(6)Al o
(6)Prem(7) pH(8) CEC(9)AEC(9)
CaCl2 KCl H2O
g kg-1 g kg-1 mg L-1 cmol
ckg-1
1 Xanthic Ferralsol Jardinópolis 15.1 381 8 300 276 0.1 0.0 3 6 2.4 4.6 4.9 5.0 0.65 0.66
2 Rhodic Ferralsol Miguelópolis 24.4 407 93 246 288 0.5 0.4 8 7 9.7 4.7 4.5 5.3 2.64 0.22
3 Xanthic Ferralsol Guaíra 6.2 438 126 189 292 0.7 0.5 3 5 0.0 5.9 6.2 5.7 1.46 1.05
4 Xanthic Ferralsol São Pedro 22.1 350 68 64 148 0.8 0.6 2 5 20.0 4.4 4.2 6.2 1.88 0.23
5 Rhodic Ferralsol Ribeirão Preto 9.3 397 89 139 150 1.0 0.6 3 3 20.3 7.3 7.4 7.8 6.13 0.13
6 Xanthic Ferralsol Itirapina 6.6 319 68 39 153 0.8 0.7 1 2 29.3 4.7 4.6 5.4 0.97 0.19
7 Xanthic Ferralsol Espírito Santo 6.6 559 147 96 309 0.8 0.7 1 4 0.0 5.4 5.9 5.0 0.56 1.04
do Pinhal
8 Rhodic Ferralsol Cordeirópolis 12.8 549 160 189 254 1.1 0.7 3 5 3.6 4.6 4.5 5.1 1.55 0.58
9 Rhodic Ferralsol Guaíra 16.7 381 105 107 170 1.1 0.8 4 4 18.1 3.9 3.9 4.6 1.31 0.43
10 Rhodic Ferralsol Leme 10.5 491 169 193 259 1.1 0.8 3 3 5.0 5.3 5.2 5.9 2.04 0.35
11 Rhodic Ferralsol Luis Antônio 10.9 442 177 261 220 1.4 0.8 4 4 8.1 4.0 4.0 4.5 2.14 0.41
12 Xanthic Ferralsol Piracicaba 3.9 299 89 43 141 1.1 0.9 2 4 16.9 3.9 4.0 4.3 1.65 0.19
13 Haplic Acrisol Vera Cruz 4.3 208 64 21 93 1.2 1.0 1 1 35.9 4.1 4.1 4.4 0.75 0.20
14 Haplic Acrisol Capão Bonito 7.8 365 135 54 175 1.3 1.1 2 3 19.2 4.4 4.2 6.4 2.70 0.24
15 Haplic Acrisol Monte Alegre 19.0 489 177 82 216 1.4 1.1 3 5 11.0 4.5 4.3 5.1 4.15 0.23
do Sul
16 Haplic Acrisol Mococa 9.7 462 194 104 226 1.5 1.1 2 3 22.8 5.4 5.2 5.9 2.28 0.23
17 Haplic Acrisol Itapetininga 12.0 575 186 54 242 1.3 1.2 1 5 2.3 4.2 4.0 4.9 3.32 0.48
18 Haplic Acrisol Mococa 12.0 442 203 104 234 1.5 1.2 2 3 21.9 5.8 5.6 6.3 5.18 0.21
19 Rhodic Ferralsol Tatuí 14.4 628 269 175 284 1.6 1.2 5 6 2.8 4.1 4.0 4.6 2.95 0.41
20 Haplic Acrisol Monte Alegre 11.6 262 130 64 133 1.7 1.3 2 1 35.6 5.0 4.8 5.5 3.47 0.24
do Sul
21 Haplic Acrisol Votuporanga 2.3 101 36 25 25 2.5 1.5 1 1 54.3 5.5 5.3 4.6 1.66 0.19
22 Haplic Acrisol Andradina 5.0 149 60 32 42 2.4 1.7 1 1 52.8 5.6 5.4 6.2 2.05 0.22 23 Haplic Acrisol Adamantina 6.2 150 77 32 48 2.7 1.9 1 1 39.1 5.2 4.9 5.4 1.98 0.18
24 Haplic Acrisol Adamantina 3.9 94 40 7 17 3.9 3.2 0 1 45.3 4.2 3.9 6.0 1.18 0.20
Table 1. Classification, localization and selected properties of the studied soils
(1) FAO (2006). (2)Oxidizable carbon (Embrapa, 1997). (3)Pipette method (Embrapa, 1997). (4)Soil contents of Si, Al and Fe extracted
by boiling 9 mol L-1 H
2SO4 expressed as their respective oxides (Embrapa, 1997). (5)Weathering indexes given by Ki = 1.7 SiO2/
Al2O3 and Kr = 1.7 SiO2/(0.63 Fe2O3 + Al2O3). (6)Soil contents of oxalate-extractable Fe and Al. (7)Remaining phosphorus (Alvarez
V. et al., 2000). (8)pH measured in 0.01 mol L-1 CaCl
equation was able to indicate the expected individual effects of the predictor variables on AEC. This model allows estimations, for instance, of different AEC values for soils with different mineralogies and similar
pH H2O values or for soils with different mineralogies
and similar clay contents.
Nitrate adsorption and leaching
The subsoil content of adsorbed NO3- ranged from
0 (soil 11) to 58.7 mg kg-1 (soil 7) with a mean value of
10.2 mg kg-1 (Table 3) and was not correlated with the
soil clay content, pH KCl, and pH H2O. On the other
hand, it was inversely correlated with Prem (r= -0.42*)
and directly correlated with AEC (r = 0.71**). The
multiple regression of adsorbed NO3- against Prem,
pH H2O, and pH KCl was not statistically significant
(F-value = 2.07, p > F = 0.1371).
The nitrate breakthrough curves for the studied soils were between those drawn for the Haplic Acrisol of Monte Alegre do Sul (soil 20) and for Xanthic Ferrasol from Guaíra (soil 3) (Figure 1), which had, respectively, the least and the highest nitrate
retardation factors (RNO3-) (Table 3). The mean RNO3
-value (0.93) indicated weak NO3- retention by the
subsoil samples and was about 15 times lower than the value obtained in similar breakthrough experiments for phosphate in Brazilian Ferralsols (Oliveira et al., 2004). This agrees with the weaker outer-sphere and the stronger inner-sphere surface complexations responsible for the respective retentions
of NO3- and phosphate in variable charge soils (Ji,
1997; Zhang & Yu, 1997). The anion exchange capacity was the only evaluated soil property that correlated
with the NO3- retardation factor (r = 0.70**), in close
agreement with the electrostatic nature of NO3
-adsorption.
For the soils 2, 5, 6, 15, 16, 18, and 20, the RNO3
-values ranged from 0.70 to 0.85. It is probable that in
these soils the NO3- ions were electrostatically repelled
rather than attracted, which characterizes the so-called negative adsorption (Ji, 1997). The negative
correlation (r = -0.68**) observed between RNO3- and
the relative amount of negative surface charges, given by the ratio [CEC/(CEC + AEC)] x 100, indicates that
RNO3- values tend to be low in soils where CEC is
much higher than AEC. The RNO3- values lower
than 0.85 were observed in those samples presenting [CEC/(CEC + AEC)] x 100 > 90 %, indicating that
these subsoils are highly susceptible to NO3- leaching
under extreme rainfall conditions.
Finally, subsoils values of Prem, pH KCl, and pH
H2O seem to be promising for the determination of
appropriate amounts of nitric fertilizers for Ferralsols and Acrisols in order to minimize nitrate leaching.
0.0 0.5 1.0 1.5 2.0 2.5 3.0 3.5 4.0
0.0 0.2 0.4 0.6 0.8 1.0
Acrisol Ferralsol
Number of pore volumes
Nitrate relative concentration, C/C
0
Figure 1. Nitrate breakthrough curves of Acrisol samples from Monte Alegre do Sul (soil 20) and Ferralsol from Guaíra (soil 3).
Soil Nitrate RNO3-(4)
KCl(1) H
2O(2) Adsorbed(3)
mg kg-1
1 62.1 53.6 8.5 1.02
2 63.0 38.8 24.2 0.84
3 148.6 117.0 31.6 1.19
4 39.7 26.3 13.4 0.94
5 97.0 96.4 0.6 0.76
6 13.9 9.1 4.8 0.79
7 185.9 127.2 58.7 1.15
8 26.4 14.3 12.1 1.13
9 24.7 24.0 0.8 0.94
10 28.1 26.3 1.8 0.96
11 19.0 19.0 0.0 1.15
12 31.4 29.7 1.7 0.98
13 55.5 55.3 0.1 0.97
14 34.7 13.7 21.0 0.92
15 34.7 25.1 9.6 0.77
16 33.9 30.2 3.6 0.73
17 31.4 10.9 20.5 0.92
18 82.9 81.6 1.3 0.85
19 30.6 29.7 0.9 0.94
20 35.5 25.1 10.4 0.70
21 59.6 57.6 2.0 1.02
22 27.2 22.3 5.0 0.90
23 27.2 18.8 8.4 0.91
24 38.0 33.1 4.9 0.95
Table 3. Soil contents and retardation factors of nitrate in the studied soils
(1) Soil content of 1-mol L-1 KCl-extractable nitrate. (2) Soil
content of water-extractable nitrate. (3) Soil content of adsorbed
nitrate [NO3- adsorved = NO
3- KCl - NO3- H2O (Ryan et al.,
The adequate use of those properties for the above purpose should be further studied considering
other aspects that also affect the NO3- behavior in
cultivated soils. Among them, it can be pointed out the changes in crop N demand according to the growth stage and gypsum application which, in turn, allows for deeper root growth in acidic subsoils.
CONCLUSIONS
1. The multiple regression model based on the
subsoil properties Prem, pH KCl, and pH H2O allows
a reliable estimation of AEC values in the subsurface (20-40 cm) layer of Ferralsols and Acrisols.
2. Considering that AEC is the most important electrochemical soil property related to nitrate adsorption, the resistance of the subsurface layer (20-40 cm) of Ferralsols and Acrisols to nitrate leaching under saturated-flow condition can be estimated based
on the subsoil properties Prem, pH KCl, and pH H2O.
ACKNOWLEDGEMENT
The authors are grateful to the National Council for Scientific and Technological Development (CNPq) for the financial support.
LITERATURE CITED
ADDISCOTT, T.M. Is it nitrate that threatens life or the scare about nitrate? J. Sci. Food Agr., 86:2005-2009, 2006. ADDISCOTT, T.M. & BENJAMIN, N. Nitrate and human
health. Soil Use Manage., 20:98-104, 2004.
ALCÂNTARA, M.A.K. & CAMARGO, O.A. Manipulação de carga e movimento de nitrato em horizontes B de um Latossolo Vermelho. Pesq. Agropec. Bras., 45: 204-212, 2010.
ALVAREZ V, V.H.; NOVAIS, R.F.; DIAS, L.E. & OLIVEIRA, J.A. Determinação e uso do fósforo remanescente. B. Inf. SBCS, 25: 24-32, 2000.
ALVES, M.E. & LAVORENTI, A. Remaining phosphorus and sodium fluoride pH in soils with different clay contents and clay mineralogies. Pesq. Agropec. Bras., 39: 241-246, 2004.
ALVES, M.E. & LAVORENTI, A. Point of zero salt effect: Relationships with clay mineralogy of representative soils of the São Paulo state, Brazil. Pedosphere, 15: 545-553, 2005.
BACHE, B.W. & WILLIAMS, E.G. Phosphate sorption index for soils. J. Soil Sci., 22: 289-301, 1971.
BORGES Jr., J.F.C. & FERREIRA, P.A. Equações e programa computacional para cálculo do transporte de solutos no solo. R. Bras. Eng. Agrí. Amb., 10:604-611, 2006. BRASIL. Fundação Nacional de Saúde. Portaria no 1469 de 29
de dezembro de 2000. Brasília: Fundação Nacional de Saúde, 2001. 32p.
BUURMAN, P.; LAGEN, van B. & VELTHORST, E. Manual for soil and water analysis. Leiden, Backhuys Publishers, 1996. 314p.
CAGLIARI, J.; VERONEZ, M.R. & ALVES, M.E. Remaining phosphorus estimated by pedotransfer function. R. Bras. Ci. Solo,35:203-212, 2011.
DYNIA, J.F. & CAMARGO, O.A. Retenção de nitrato num solo de carga variável influenciada por adubação fosfatada e calagem. Pesq. Agropec. Bras., 34: 141-144, 1999. EMPRESA BRASILEIRA DE PESQUISA AGROPECUÁRIA
-EMBRAPA. Manual de métodos de análises de solos. Rio de Janeiro, Embrapa Solos, 1997. 212p.
EMPRESA BRASILEIRA DE PESQUISA AGROPECUÁRIA -EMBRAPA. Sistema brasileiro de classificação de solos. 2.ed. Rio de Janeiro, Embrapa Solos, 2006. 306p. FLORENCE, T.M. & FARRAR, Y.J. Spectrophotometric
determination of chloride at parts-per-billion level by mercury(II) thiocyanate method. Anal. Chim. Acta, 54:373-377, 1971.
FOOD AND AGRICULTURE ORGANIZATION - FAO. World reference base for soil resources 2006: a framework for international classification, correlation and communication. Rome, FAO, 2006. 145p. (World Soil Resources Report, 103).
HARMAND, J.M.; ÁVILA, H.; OLIVER, R.; SAINT-ANDRÉ, L. & DAMBRINE, E. The impact of kaolinite and oxi-hydroxides on nitrate adsorption in deep layers of a Costarican Acrisol under coffee cultivation. Geoderma, 158:216-224, 2010.
JI, G.L. Electrostatic adsorption of anions. In: YU, T.R., ed. Chemistry of variable charge soils. New York, Oxford University Press, 1997. p.112-139.
MURPHY, J. & RILEY, J.P. A modified single solution method for determination of phosphate in natural waters. Anal. Chim. Acta, 26:31-36, 1962.
NETER, J.; WASSERMAN, W. & KUTNER, M.H. Applied linear statistical models: regression, analysis of variance and experimental designs. Boston, Irwin, 1990. 1181p. OLIVEIRA, E.M.M.; RUIZ, H.A.; FERREIRA, P.A.; ALVAREZ
V., V.H. & BORGES Jr., J.F.C. Fatores de retardamento e coeficientes de dispersão-difusão de fosfato, potássio e amônio em solos de Minas Gerais. R. Bras. Eng. Agrí. Amb., 8:196-203, 2004.
RESENDE, A.V. Agricultura e qualidade da água: contaminação da água por nitrato. Planaltina: Embrapa Cerrados, 2002. 29p. (Documentos, 57)
SAS. SAS: principles of regression analysis - course notes. Cary, SAS Institute, 2004. 655p.
van GENUCHTEN, M.T. & WIERENGA, P.J. Solute dispersion coefficients and retardation factors. In: KLUTE, A. ed. Methods of soil analysis: Part 1. Physical and mineralogical methods. Madison, ASA and SSSA, 1986. p.1025-1031.
YANG, J.E.; SKOGLEY, E.O.; SCHAFF, B.E. & KIM, J.J. A simple spectrophotometric determination of nitrate in water, resin, and soil extracts. Soil Sci. Soc Am. J., 62:1108-1115, 1998.