Development and application of an ex vivo fosphenytoin nasal bioconver-sion/permeability evaluation method
Daniel Antunes Viegas, M´arcio Rodrigues, Joana Francisco, Am´ılcar Falc˜ao, Gilberto Alves, Adriana O. Santos
PII: S0928-0987(16)30121-X
DOI: doi:10.1016/j.ejps.2016.04.018
Reference: PHASCI 3543
To appear in:
Received date: 2 December 2015 Revised date: 2 February 2016 Accepted date: 18 April 2016
Please cite this article as: Viegas, Daniel Antunes, Rodrigues, M´arcio, Francisco, Joana, Falc˜ao, Am´ılcar, Alves, Gilberto, Santos, Adriana O., Development and application of an
ex vivo fosphenytoin nasal bioconversion/permeability evaluation method, (2016), doi:
10.1016/j.ejps.2016.04.018
This is a PDF file of an unedited manuscript that has been accepted for publication. As a service to our customers we are providing this early version of the manuscript. The manuscript will undergo copyediting, typesetting, and review of the resulting proof before it is published in its final form. Please note that during the production process errors may be discovered which could affect the content, and all legal disclaimers that apply to the journal pertain.
ACCEPTED MANUSCRIPT
Development and application of an ex vivo fosphenytoin nasal
bioconversion/permeability evaluation method
Daniel Antunes Viegas
a,b, Márcio Rodrigues
a, Joana Francisco
a, Amílcar Falcão
c,d, Gilberto
Alves
a,b,c, Adriana O. Santos
a,b*
a
Health Sciences Research Centre, University of Beira Interior, Av. Infante D. Henrique, 6200-506
Covilhã, Portugal
b
Faculty of Health Sciences, University of Beira Interior, Av. Infante D. Henrique, 6200-506
Covilhã, Portugal
c
Center for Neuroscience and Cell Biology, University of Coimbra, 3004-504 Coimbra, Portugal
d
Laboratory of Pharmacology, Faculty of Pharmacy, University of Coimbra, Pólo das Ciências da
Saúde, Azinhaga de Santa Comba, 3000-548 Coimbra, Portugal
*Corresponding author: Adriana Oliveira dos Santos
Faculty of Health Sciences and Health Sciences Research Centre, University of Beira Interior
Av. Infante D. Henrique, 6200-506 Covilhã, Portugal
tel.: 00351 275 329 002 / 00351 275 329 003 / extension: 5079; fax: 00351 275 329 099
e-mail: [email protected]
E-mail addresses: [email protected] (D. Antunes Viegas), [email protected] (M.
Rodrigues), [email protected] (J. Francisco), [email protected] (A. Falcão),
[email protected] (G. Alves), [email protected] (A. O. Santos).
ACCEPTED MANUSCRIPT
Abstract
There is an increasing interest in the intranasal delivery of central nervous system-active drugs due to the existence of a direct nose-to-brain connection. However, poor solubility limits the amount of drug that can be administered within an aqueous solution. In the present work, the objectives were to develop an ex vivo bioconversion/permeability evaluation method and to study the ex vivo bioconversion of the hydrophilic phosphate ester prodrug fosphenytoin (FOS) to the active drug phenytoin (PHT) and their comparative nasal permeation.
Bioconversion/permeability studies were performed in excised porcine nasal mucosa mounted in Ussing chambers. The physical integrity of the tissues was evaluated by measurement of the transepithelial electrical resistance (TEER). The simultaneous quantitative assay of FOS, PHT and its major metabolite,
5-(4-hydroxyphenyl)-5-phenylhydantoin (HPPH) was developed and validated according to international
guidelines using a liquid chromatography analytical method. The FOS bioconversion rate and PHT and FOS apparent permeability coefficients (Papp) were determined at different time points. FOS bioconversion was
also qualitatively investigated in human nasal mucus.
The developed liquid chromatography method combines a fast and inexpensive sample preparation with inactivation of the enzymatic metabolism of the prodrug during sample manipulation and storage. It was linear, precise, accurate, and presented a high analyte recovery. FOS was converted ex vivo to PHT but the metabolite HPPH was not detected. The bioconversion rate increased with FOS concentration and with time, which suggests a diffusion-limited process. FOS was also converted to its active drug by human nasal mucus. A novel mathematical data analysis method was developed to reduce the bias introduced by variable mucosal TEER in the permeability results. At comparable FOS and PHT concentrations the Ln(Papp
PHT
) of both compounds showed little difference, which indicates that the use of a hydrophilic and charged prodrug did not hinder overall drug permeation. At the highest tested FOS concentration it was possible to quantify FOS in the receiver chambers, meaning that at a sufficiently high concentration the FOS permeation rate overcame its bioconversion rate. The Ln(Papp
PHT
) tended to similar equilibrium values as the assay
progressed, but with higher FOS concentrations that equilibrium was attained faster. Acidic pH reduced the permeability of both PHT and FOS.
ACCEPTED MANUSCRIPT
The developed bioconversion/permeability evaluation method will constitute an important tool to select the most promising formulations before proceeding to in vivo studies.Importantly, it allowed the demonstration of phosphatase activity and FOS bioconversion in nasal mucosa, as well as the prodrug’s nasal permeation potential. Furthermore, this study demonstrates the possibility of formulating phosphate prodrugs of poorly soluble central nervous system-active drugs as a strategy to increase the solubilized drug doses administered through the nasal route.
Keywords: Ex vivo; Nasal mucosa; Permeability; Bioconversion; Fosphenytoin; Phenytoin.
Chemical compounds studied in this article
5,5-Diphenylhydantoin sodium (PubChem CID: 657302); 10,11-Dihydrocarbamazepine (PubChem CID: 19099); 5-(4-Hydroxyphenyl)-5-phenylhydantoin (PubChem CID: 17732); Fosphenytoin sodium (PubChem CID: 56338)
ACCEPTED MANUSCRIPT
Introduction
Central nervous system (CNS) diseases affect over 1.5 billion people worldwide and will become the main health problem of the 21st century, which entails a large burden to healthcare systems worldwide (Palmer, 2010). This grim reality highlights the need to devote increasing research time and means to the development of new and improved treatments for these disorders. However, the management of these diseases is difficult because the blood-brain barrier limits the passage of most drugs. Furthermore, even those that are able to cross it frequently present limitations such as poor bioavailability, first-pass metabolism and peripheral side effects when administered orally (Serralheiro et al., 2013b).
In order to circumvent some of the drawbacks of the oral administration of CNS-active drugs, intranasal delivery has been gaining prominence as an alternative route because, besides allowing the passage of drugs to the systemic circulation, it has the ability to bypass the blood-brain barrier and directly target drugs to the CNS, mainly through olfactory and trigeminal nerve pathways, in a non-invasive manner (Mittal et al., 2014). Plus, intranasal delivery provides a fast onset of therapeutic action, which is of utmost importance in emergency situations such as status epilepticus (Serralheiro et al., 2013b). Just considering the application of the intranasal route of administration to the brain delivery of antiepileptic drugs, there are promising results from in vivo studies of carbamazepine (Barakat et al., 2006; Samia et al., 2012; Serralheiro et al., 2014), lamotrigine (Serralheiro et al., 2015), valproic acid (Eskandari et al., 2011), clobazam (Florence et al., 2011), clonazepam (Vyas et al., 2006), among others. Despite all its advantages, intranasal delivery also presents some hindrances such as the small volumes that can be administered through this route (25-200 μL), which is problematic for poorly soluble drugs, that encompass many existent drugs and around 40% of the molecules under development (Alelyunas et al., 2010; Bahadur and Pathak, 2012). For such drugs, unless they are extremely potent, the most common approach of formulating simple aqueous solutions (Jogani et al., 2008) is clearly not adequate, and alternative formulation strategies are required.
Since the nasal epithelium is a highly permeable membrane (Bahadur and Pathak, 2012) and there is extensive work on permeation enhancing excipients for nasal drugs (Illum, 2012), we hypothesized that the use of soluble prodrugs (Stella and Nti-Addae, 2007) would be a valuable strategy for the design of nasal medicines of poorly soluble CNS-active drugs such as phenytoin (PHT). This is an anticonvulsant with limited aqueous solubility (20-25 μg/mL) (Stella, 1996) pertaining to the class II of the biopharmaceutics classification system (Heimbach et al., 2003) that presents some drawbacks: an erratic absorption when
ACCEPTED MANUSCRIPT
administered through the oral route (Atef and Belmonte, 2008) and is predominantly metabolized by cytochrome P450 (CYP) 2C9/10 to 5-(4-hydroxyphenyl)-5-phenylhydantoin (HPPH) (Chollet, 2002), a metabolite that has been associated with one of the most common side effects of this drug, gingival
hyperplasia (Ieiri et al., 1995; Kamali et al., 1999). PHT has a commercially available hydrophilic phosphate ester prodrug, fosphenytoin (FOS), that is rapidly converted to its parent active drug by alkaline
phosphatases (Stella, 1996) and was selected as the model molecule to test our hypothesis.
The primary objective of this work was to develop a fast, inexpensive, and accurate ex vivo FOS and PHT nasal bioconversion/permeability evaluation method, using porcine nasal mucosa. This included the development, optimization, and validation of a liquid chromatography (LC) analytical method for the simultaneous determination of the concentrations of FOS, PHT and HPPH (Fig. 1) in the media of both donor and receiver compartments of Ussing chambers, which is described herein for the first time. The second aim of the present work was to evaluate whether there is bioconversion of FOS to PHT by the mucosa, and to study their comparative nasal permeation in simple buffered solutions.
Material and methods
2.1. Chemicals
Sodium di-hydrogen phosphate anhydrous and the American Chemical Society (ACS) reagent grade chemicals potassium chloride, calcium chloride dehydrate, sodium hydrogen carbonate and perchloric acid 70% were from Panreac Química S.A.U. (Castellar del Vallès, Barcelona, Spain). di-Sodium hydrogen phosphate anhydrous (ACS reagent grade) was from Panreac AppliChem (Darmstadt, Germany). Sodium chloride (Analytical reagent grade), D-glucose anhydrous (Analytical reagent grade), methanol (HPLC grade) and triethylamine (Laboratory reagent grade) were from Fischer Scientific UK (Loughborough,
Fig. 1. Chemical structures of fosphenytoin (FOS), phenytoin (PHT), 5-(4-hydroxyphenyl)-5-phenylhydantoin (HPPH), and 10,11-dihydrocarbamazepine, which was used as the internal standard (IS).
ACCEPTED MANUSCRIPT
Leicestershire, United Kingdom). Magnesium chloride hexahydrate, 5,5-diphenylhydantoin sodium salt (commonly known as phenytoin sodium) (> 99%), 10,11-dihydrocarbamazepine (> 99%) and 5-(4-hydroxyphenyl)-5-phenylhydantoin (98%) were purchased from Sigma-Aldrich, Inc. (St. Louis, Missouri, United States of America). Fosphenytoin sodium USP (99.88%) was kindly supplied by JPN Pharma (Tarapur, Maharashtra, India). Ultrapure water was used throughout the work (Milli-Q water system, Merck Millipore, Billerica, Massachusetts, United States of America).
2.2. Tissue preparation and Ussing chamber set up
Nasal mucosa was excised from freshly slaughtered pigs in the nearest slaughterhouse (Oviger, Alcains, Castelo Branco, Portugal). The nasal tissue was obtained by cutting the pig heads in two halves by the septum, followed by its removal and unrolling of the nasal concha in order to access the upper lateral region of the cavity mucosa. A rectangular piece of mucosa was cut with a scalpel, transferred with tweezers to a falcon tube and put on ice for immediate transport to the laboratory. Immediately before mounting, the mucosas were immersed and gently washed in ice-cold oxygenated Krebs-Ringer Bicarbonate (KRB) buffer adjusted to pH 7.4 (1.5 mM NaH2PO4, 0.83 mM Na2HPO4, 1.67 mM MgCl2, 1.20 mM CaCl2, 4.56 mM KCl,
15 mM NaHCO3, 10 mM D-glucose and 119.78 mM NaCl, saturated with oxygen by gassing it with a
mixture of 95%/5% O2/CO2 (Osth et al., 2002a)). Square pieces of nasal mucosa were cut and mounted on
NaviCyte vertical 9 mm circular Ussing chambers with an exposed tissue surface area of 0.64 cm2 (Warner Instruments, Holliston, Massachusetts, United States of America). A heater block (Warner Instruments) connected to an external circulating water bath set to 37ºC was used, leading to an actual equilibrium temperature of about 33ºC in the Ussing chambers. Prewarmed KRB was added to both half-chambers (3.5 mL each, donor and receiver, bathing the mucosal and submucosal sides, respectively). The media
circulation and stirring was assured through a gas-lift process using the incorporated gas manifold of the heater block with a mixture of 95%/5% O2/CO2 (1-2 bubbles/s).
2.3. Tissue integrity
The physical integrity of the nasal mucosa was assessed by measuring the transepithelial electrical resistance (TEER) using an EVOM2, Epithelial Voltohmmeter and its STX2 “chopstick” electrodes containing a silver/silver-chloride pellet and a silver electrode from World Precision Instruments (Sarasota, Florida,
ACCEPTED MANUSCRIPT
United States of America). In order to compensate for the electrical resistance of the Ussing chambers and buffer media, a control chamber was left without nasal mucosa, taking care to prevent leaking. The TEER (ohms.cm2) of each mucosa was thus calculated by subtracting the electrical resistance of the control chamber from the electrical resistance of the Ussing chambers containing nasal mucosa and multiplying the result by the exposed tissue area (0.64 cm2). TEER measurements were performed right after adding KRB to the Ussing chambers, after 30 min of preincubation to allow the buffer and mucosas to reach the desired temperature and a state of electrophysiological equilibrium and at the end of the permeability studies. The inclusion criterion for the mucosas was that the TEER was between 15 and 45 ohms.cm2 after the
preincubation time. If any mucosa did not fulfill this criterion, it was replaced by a different one and the preincubation period was reset.
2.4. Bioconversion and permeability studies
The drug or prodrug donor solutions for the bioconversion and permeability studies were prepared in oxygenated KRB, pH 7.4, or oxygenated phosphate buffer adjusted to pH 4.5 (25 mM NaH2PO4, 1.67 mM
MgCl2, 1.2 mM CaCl2, 4.56 mM KCl, 10 mM D-glucose and 119.78 mM NaCl in ultrapure water, saturated
with oxygen by gassing it with a mixture of 95%/5% O2/CO2).
After the preincubation and TEER measurements described in Section 2.3, the buffer was replaced in the receiver chambers by 3.5 mL of fresh prewarmed KRB and by 3.5 mL of prewarmed drug or prodrug donor solution in the donor chambers.
In the experiments with PHT, 25 μL samples were collected from the donor chambers at the beginning of the incubation (initial drug concentration) to microtubes containing a mixture of 20 μL of perchloric acid (PCA) 10% and 75 μL of blank matrix (KRB that was incubated with nasal porcine nasal mucosa for an equivalent time of the complete assay without any drug). One hundred μL samples were collected from the receiver chambers at 30 min intervals, up to 120 min, to microtubes containing 20 μL of PCA 10%. In the experiments where FOS was used, in order to determine the initial concentration of FOS, 10 or 25 μL samples (according to the prodrug concentration and consequent necessary dilution) were collected from the donor chambers at the beginning of the incubation period to microtubes containing 90 or 75 μL of blank matrix, respectively, and 20 μL of PCA 10%. After that, different sample volumes (according to the
ACCEPTED MANUSCRIPT
transferred to microtubes containing 20 μL of PCA 10% at 30 min intervals, up to 120 min. This procedure was used to quantify FOS and PHT concentrations in the receiver and donor chambers, and thus determine the total amount of PHT that was being formed during the assay and estimate the bioconversion rate of this process. Samples were thoroughly mixed with the blank matrix and/or PCA 10% by using a vortex mixer at each collection time and stored at -20ºC at the end of the study, until further sample preparation (as described in Section 2.6.3) and LC analysis, within the validated stability timeframe.
2.5. Qualitative evaluation of FOS bioconversion by human nasal mucus
Nasal mucus was self-collected by three human volunteers by gently scrubbing a sterile plastic loop on the interior wall of the nasal cavity. Each mucus sample was mixed with 0.4 mL of a FOS solution (29 μg/mL in KRB, pH 7.4) by immersion of the loop in the solution, and incubated at 37ºC. At each time point (1, 2.5 and 4 h), a sample was collected for quantification of FOS and PHT as described in section 2.4. This was a simple, safe and non-invasive procedure to investigate the occurrence of FOS bioconversion in human nasal mucus.
2.6. Analytical method
2.6.1. Stock solutions, calibration standards and quality control samples
Stock solutions (5 mg/mL) of PHT, FOS, HPPH and IS were individually prepared in methanol and stored at -80ºC. From these stock solutions, individual intermediate solutions for all analytes (100 μg/mL) were prepared by dilution with methanol to facilitate the preparation of the lowest concentrated spiking solutions. A working solution of IS (100 μg/mL), for a final concentration of 14.3 μg/mL, was prepared in a mixture of water-methanol (50:50, v/v) and stored at 4ºC. Eleven combined (PHT, FOS and HPPH) spiking solutions with final concentrations of 0.2, 0.4, 1, 3, 10 and 30 μg/mL for the calibration standards and 0.2, 0.6, 15, 27 and 150 μg/mL (15 μg/mL after a tenfold dilution) for the quality control (QC) samples were also prepared in a mixture of water-methanol (50:50, v/v) and stored at 4ºC. Six calibration standards in the concentration range of 0.2-30 μg/mL were prepared daily by spiking 80 μL aliquots of blank matrix (obtained as explained in Section 2.4), containing 20 μL of PCA 10%, with 20 μL of the appropriate combined spiking solutions and 20 μL of IS working solution. QC samples at four concentration levels covering the calibration curve
ACCEPTED MANUSCRIPT
range, more specifically, the lower limit of quantification (LLOQ; QCLLOQ), low (QC1), medium (QC2) and
high (QC3) concentrations were independently prepared daily in the same manner as the calibration standards
to monitor the performance of the analytical method. Additional QC samples only containing FOS at the high concentration level (QC3FOS) were similarly prepared just for the stability studies. In order to evaluate
the dilution integrity (tenfold dilution), another QC sample (QCDil) was prepared daily by spiking 80 μL of
blank matrix with 20 μL of the highest concentrated combined spiking solution, followed by the transfer of 10 μL of the obtained mixture to a microtube containing 20 μL of PCA 10% and 90 μL of blank matrix and then spiked with 20 μL of IS working solution.
2.6.2. Equipment and chromatographic conditions
The chromatographic analysis was performed in an ultra high performance liquid chromatography (UHPLC) system (1290 Infinity Binary LC System) coupled to a diode array detector (1260 Infinity DAD; G4212B), both from Agilent Technologies (Santa Clara, California, United States of America). All components were controlled using the ChemStation software, also from Agilent Technologies. The chromatographic separation of FOS, PHT, HPPH, and IS was achieved in 15 min at 30ºC on a reversed-phase LiChroCART®
Purospher® STAR column (C18, 55 mm × 4 mm; 3 μm particle size) from Merck KGaA (Darmstadt,
Germany). The aqueous component of the mobile phase was composed of 10 mM NaH2PO4 and 0.25 %
triethylamine (v/v) in ultrapure water, with the pH adjusted to 3.0, and the organic component was methanol. The final ratio of aqueous-organic components (64:36, v/v) was achieved with the Jet Weaver V35 Mixer of the UHPLC system. This mobile phase was pumped isocratically at a flow rate of 1.0 mL/min, the injection volume was 20 μL and the detection was carried out at a wavelength of 215 nm for both the analytes and IS.
2.6.3. Sample preparation
Frozen samples from the bioconversion and permeability studies, containing 20 μL of PCA 10%, were allowed to reach room temperature and spiked with 20 μL of IS working solution. Afterwards, the samples were centrifuged for 5 min at 13,000 RPM (16,060 RCF) at room temperature in a MIKRO 20 centrifuge from Hettich (Tuttlingen, Germany) and 100 μL of supernatants were transferred to the sample glass vials of the chromatographic system for injection.
ACCEPTED MANUSCRIPT
2.6.4. Analytical method validation
The method was validated according to the international guidelines for bioanalytical method validation of the Food and Drug Administration (FDA) and European Medicines Agency (EMA) and considering their
acceptance criteria for selectivity, linearity, LLOQ, precision, accuracy, dilution integrity, recovery and stability (European Medicines Agency, 2011; U.S. Food and Drug Administration, 2001).
The selectivity of the method was evaluated by analyzing six independent samples of blank matrix (obtained as described in Section 2.4) to ensure that there was no significant interference from endogenous
compounds, metabolites or degradation products at the retention times of FOS, PHT, HPPH, and IS. In order to study the linearity, calibration curves were prepared using the calibration standards described in Section 2.6.1 and assayed on five different days. The homoscedasticity of the calibration curves was evaluated and the data were subjected to a weighted least squares linear regression using 1/y2 as the
weighting factor, according to a procedure developed by Almeida et al. (Almeida et al., 2002). Calibration curves were only accepted if the back-calculated concentrations of the calibration standards deviated no more than ±15% from the nominal concentration value (± 20% for the LLOQ).
The LLOQ was defined by analyzing five replicates and verifying that the analyte response was at least five times higher than the blank response.
The inter-day precision and accuracy of the method was studied by analyzing QC samples on five different days, while the intra-day precision and accuracy of the assay was determined by analyzing five replicates of the QC samples in a single day. The acceptance criteria were as follows: precision (expressed as percentage of the coefficient of variation, CV) must be lower than or equal to 15% (20% for the LLOQ) and accuracy (expressed as bias) must be within ± 15% (± 20% for the LLOQ).
In order to determine the dilution integrity, QCDil samples were analyzed on five different days and on the
same day using the 15% criteria for inter and intra-day precision and accuracy, respectively.
To assess the recovery of the analytical method, the absolute recovery of the analytes and IS was determined in QC1, QC2 and QC3.
The stability studies were made using QC1 and QC3, as well as QC3FOS, containing only FOS to better
investigate its stability due to the possible conversion of FOS to PHT during sample manipulation and storage. Stability in the different tested conditions was accepted when the stability/reference samples ratio
ACCEPTED MANUSCRIPT
stayed within 85-115%. In order to simulate sample handling and storage before analysis, the short-term and long-term stability of unprocessed samples was evaluated at room temperature for 4 h and -20ºC for 28 days. Furthermore, the post-preparative stability of processed samples was also determined at room temperature for 24 h in order to simulate the maximum time that samples might have to stay in the UHPLC autosampler before being analyzed.
2.7. Data analysis and P
appweighting
The experiments were repeated at least in five different mucosa pieces (n = 5-10) and data were expressed as mean ± standard error of the mean (SEM). Both linear regression analysis and analysis of variance (one-way or two-way ANOVA, followed by a Sidak or Tukey post-hoc test) were performed using the trial version of GraphPad Prism® 6 for Mac from GraphPad Software, Inc. (La Jolla, California, United States of America). The bioconversion surface plot was constructed with JMP® Pro 11 for Mac from SAS Institute Inc. (Cary, North Carolina, United States of America), kindly provided by SAS Institute, Software, Lda. (Lisbon, Portugal). A p-value of 0.05 was considered as the minimal significance level for the statistical tests.
The FOS to PHT bioconversion rate (μM/min/cm2) was calculated using the following equation:
Bioconversion rate = [PHT]T / (t ∙ A) (Eq. 1),
where [PHT]T (μM) is the combination of the molar concentration of PHT in both the donor and receiver
chambers at the different sampling times, t (min) is the incubation time and A (cm2) is the exposed area of the porcine nasal mucosa.
The permeability of both PHT and FOS through the nasal mucosa was estimated by calculating the apparent permeability coefficient (Papp) (10
-6
cm/s) according to the following general equation:
Papp = 10 6
ACCEPTED MANUSCRIPT
where Q (nmol) is the total molar amount of PHT or FOS that permeated to the receiver chambers during the incubation time, C0 (μM) is the initial PHT or FOS molar concentration in the donor chambers, t (s) is the
incubation time and A (cm2) is the exposed tissue area.
Eq. 2 can also be written discriminating which drug was quantified as follows:
Papp PHT = 106 ∙ QPHT / (C0 ∙ t ∙ A) (Eq. 3), and/or Papp FOS = 106 ∙ QFOS / (C0 ∙ t ∙ A) (Eq. 4),
where QPHT and QFOS (nmol) are, respectively, the total molar amount of PHT and FOS that permeated to the receiver chambers during the incubation time. When a FOS solution was used in the donor chambers, its permeability was expressed as Papp
PHT
or, whenQFOS was above the lower limit of quantification of the analytical method, both Papp
PHT
andPapp FOS
.
Considering the high inter- and intra-assay variability of the TEER values, which we were unable to control, and their influence in Papp
PHT
andPapp FOS
, we developed a weighting system to eliminate, as much as possible, the interference of TEER on permeability, by calculating what the permeability would have been if TEER had a constant value. After converting the experimental Papp values to their natural logarithm [ln(Papp)exp] to
obtain a normal distribution (which has already been done in similar works (Osth et al., 2002a)), the linear function equation between ln(Papp) and TEER was derived by linear regression. In the regression equation of
the type y = mx + b, y is the predicted ln(Papp) [ln(Papp)p] and x is the average TEER [μTEER] from the
measurements taken in each experiment at the end of the preincubation time and at the end of the permeability assay. Therefore we have:
ln(P
app)
p= m ∙ µ
TEER+ b
(Eq. 5)
The linear regression acceptance criteria were a F-test p-value < 0.05, a coefficient of determination (r2) > 0.5, compliance with the assumption of normality of the residuals (p-value > 0.05) by the
D’Agostino-ACCEPTED MANUSCRIPT
Pearson omnibus K2 test and meeting of homoscedasticity (visual verification that the residuals were randomly distributed around the x-axis of a Residual vs μTEER plot).
The residuals (ε) were calculated as follows:
ε = ln(Papp)exp - ln(Papp)p (Eq. 6),
so, by combining Eq. 5 and Eq. 6 we get:
ε = ln(Papp)exp - (m ∙ µTEER + b) (Eq. 7)
Then, the predicted ln(Papp) [ln(Papp)p] were calculated considering a constant reference value of TEER,
chosen to be the average from all permeability studies (25.4 ohms.cm2). The individual weighted ln(Papp)
[ln(Papp)w] values were finally calculated by adding the residuals resulting from the linear regression to the
predicted ln(Papp) [ln(Papp)p]. The equation is:
ln(Papp)w = (m ∙ 25.4 + b) + ln(Papp)exp - (m ∙ µTEER + b) (Eq. 8),
Eq. 8 can be further simplified to:
ln(Papp)w = ln(Papp)exp + m ∙ (25.4 - µTEER) (Eq. 9).
Results and discussion
3.1. Development and optimization of the experimental conditions for the ex vivo
bioconversion and permeability studies
Porcine nasal mucosa mounted in vertical Ussing chambers was selected as the basis for the bioconversion and permeability evaluation, as it was considered an effective and economic method both for the present work and for screening purposes during the initial stages of future formulation development. This ex vivo approach, which is based on the use of excised tissues, allows greater resemblance to in vivo conditions than regular cell culture methods (Merkle et al., 1998; Osth et al., 2002a). Concerning the intranasal route of administration, having in account the obvious difficulties in obtaining human tissues from nasal biopsies, the selected model follows the tendency of most published studies, which are performed in animal nasal mucosa
ACCEPTED MANUSCRIPT
mounted in Franz diffusion cells or Ussing chambers in combination with electrophysiological
measurements to assess tissue integrity (Merkle et al., 1998). Even though the majority of researchers used to resort to tissues from rabbits, cows and sheep (Merkle et al., 1998; Schmidt et al., 2000), recently, porcine nasal mucosa has been used in a large array of studies, both with small molecule drugs and proteins in simple solutions or more complex formulations (Carvalho et al., 2013; Osth et al., 2002b; Samson et al., 2012; Sintov et al., 2010; Wadell et al., 2003). In addition to the similarities to humans regarding general morphology, cell types and electrophysiological parameters (Wadell et al., 1999), this model is also advantageous from an ethical point of view, because only animals already intended for slaughter are used, and it offers a considerable tissue area. Furthermore, the viability (cell metabolic activity) of porcine nasal mucosa in ex vivo studies has already been validated (Wadell et al., 1999). We also qualitatively confirmed the viability of the mucosas using resazurin, which was reduced to resorufin, indicating the presence of metabolic active cells (data not shown).
Nasal cavity mucosa was used since septum mucosa has pervasive connective tissue that greatly influences drug permeability (Wadell et al., 1999). We also found that even though septum mucosa was easier to excise, it was less homogeneous than nasal cavity mucosa in thickness and appearance, showing a large variability between different animals, which is further reinforced by results that showed a greater coefficient of variation in the determination of electrophysiological parameters (Wadell et al., 1999).
The usage of biological membranes requires special care in their handling and strict control over the buffer media, pH, temperature and oxygenation because it is crucial to assure the physical integrity and viability of the tissues (Maitani et al., 1997; Wadell et al., 1999) and, therefore, the reliability of the results.
The integrity of the tissues, more specifically of its tight junctions, was assessed by measuring the TEER (Osth et al., 2002a) because it is easy to determine and it has already been used as the single
electrophysiological parameter for that purpose in other permeability studies with Ussing chambers (Fortuna et al., 2012).
We also tested two procedures for the transport of the mucosas to the laboratory after excision: in gassed KRB (wet) and on dry tubes (dry) placed on ice. This was done by periodically comparing the TEER of mucosas transported in both conditions during 180 min (60 min of preincubation and 120 min of incubation). No substantial differences were found between tissues transported by wet or dry methods (Fig. S1 of the supplementary material) and as a result, the dry method was chosen to simplify the procedures.
ACCEPTED MANUSCRIPT
Having in account that the usual preincubation times to reach a state of electrophysiological equilibrium vary between 20 and 120 min (Merkle et al., 1998), we measured the TEER at 0, 30 and 60 min of preincubation to evaluate how it changed during this period. Thirty min was selected as the final preincubation time because, even though the TEER suffered a sharp decline during the first 30 min, it remained fairly stable after that (Fig. S2 of the supplementary material), which indicates that this time is sufficient to achieve the equilibration of the nasal mucosa.
The total duration of the bioconversion/permeability studies was optimized from 150 min to 120 min because this timeframe allowed us to obtain the desired results and is already extensive enough.
Additionally, there is previous indication that after being in diffusion chambers for 2 h, the epithelium of porcine nasal mucosa does not suffer considerable morphological changes, as observed by histological analysis, while swelling/edema and epithelial cell loss occurred after longer incubations (Wadell et al., 1999).
3.2. Analytical method development and optimization
3.2.1. Development and optimization of the chromatographic conditions
Since the desired application of this analytical method was to simultaneously determine the concentrations of FOS, PHT, and HPPH in samples from ex vivo bioconversion and permeability studies, the aim was to use a common detection system (DAD) and the simplest chromatographic elution conditions (isocratic), which require less complex and expensive equipment. The mobile phase was optimized regarding the organic solvent (acetonitrile or methanol), aqueous component composition and pH and aqueous-organic
components ratio. Concerning the choice of organic solvent, acetonitrile was tested at 17.5-25% (v/v) but was replaced by methanol (35-40%, v/v) due to its more favorable polarity that allowed changing the order of elution of HPPH and FOS, delaying the latter, in order to avoid interferences at the beginning of the chromatographic run. Higher percentages of both organic solvents led to shorter run times but also to an overlap of the peaks of both the analytes and IS with interferences. The aqueous component pH was
evaluated on the range of 3.0-6.5. Only FOS was affected by this change, with lower values of pH leading to higher retention times, which provided a better peak separation from HPPH and avoidance of major
ACCEPTED MANUSCRIPT
effect being more pronounced in the case of FOS. As a result of this optimization process, the selected mobile phase was composed by an aqueous component with 10 mM NaH2PO4 and 0.25% triethylamine
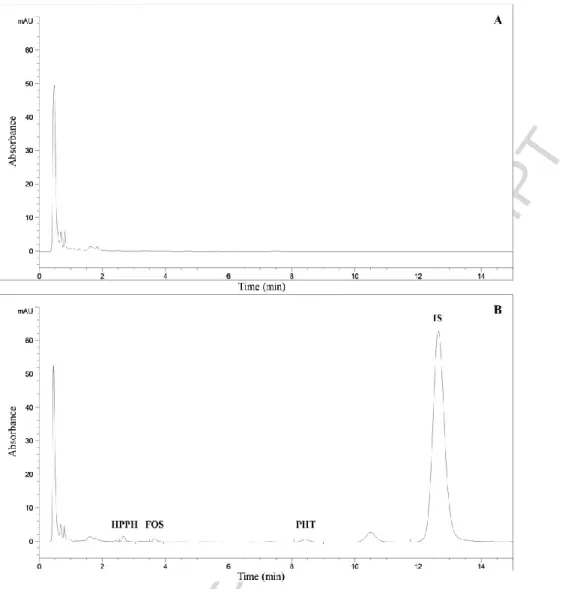
(v/v), pH adjusted to 3.0 with HCl, and methanol as the organic component, mixed in a ratio of 64:36, v/v, respectively. Using this mobile phase, the elution order of the compounds was HPPH, FOS, PHT and IS (Fig. 2).
The influence of column temperatures of 30 and 35ºC was appraised, with the former being preferred because, even though the higher temperature resulted in shorter retention times and narrower peaks for all analytes, it had a negative impact in peak resolution.
Eleven compounds were analyzed in order to select a suitable IS to correct for experimental variability during sample preparation and analysis in the course of the first optimization trials (chlorpropamide, coumarin, 10,11-dihydrocarbamazepine, gatifloxacin, ketoprofen, oxazepam, paroxetine, tamoxifen, tolbutamide, venlafaxine and warfarin). 10,11-Dihydrocarbamazepine was ultimately chosen due to the combination of a retention time that allowed a good resolution of all the peaks and assessment of the performance of the chromatographic separation until the end of each run and because it displayed an adequate chromatographic behavior and high absolute recovery.
Several wavelengths ranging from 210 to 280 nm were assessed using the DAD (based on values already described in the literature for these analytes in different matrices (Alvariza et al., 2013; Burstein et al., 1999; Cwik et al., 1997; Ferreira et al., 2014; Kapoor and Siegel, 2013; Kugler et al., 1998; Serralheiro et al., 2013a)) in order to choose the ones that offered the best equilibrium between selectivity and sensitivity. A wavelength of 215 nm was selected for the detection of both the three analytes and IS because it granted a stable baseline with a minimal level of interferences at the relevant retention times, allowing the achievement of good LLOQs.
3.2.2. Optimization of the sample preparation procedure
Considering the vast amount of samples that were/are supposed to be analyzed with this analytical method, the objective was to develop a fast, simple and inexpensive sample preparation procedure that conferred high absolute recoveries for both the analytes and IS, to increase the sensitivity of the assay to the furthest extent possible, and was highly reproducible. Since the matrix obtained from the bioconversion and permeability studies was fairly simple and only contained residual amounts of proteins, it became clear that a simple
ACCEPTED MANUSCRIPT
protein precipitation step followed by centrifugation would be sufficiently efficient for the extraction of the analytes. The tested precipitating agents were methanol, trichloroacetic acid 20% and PCA 7 and 10%. Methanol was able to adequately precipitate the proteins and provided a stable base line with only some interferences during the first minute of the chromatographic run but was excluded due to the volume that was necessary to add to the samples to effectively precipitate the proteins, with the consequent dilution of the samples (1:2). Trichloroacetic acid was immediately excluded because it had a high absorbance at the tested wavelengths, resulting in a wide peak that eluted for the first 3 min of the chromatographic run and
interfered with the retention times of some of the analytes. PCA 10% was ultimately selected because its use resulted in an appropriate protein precipitation, a stable baseline, with the major interferences eluting during the first 2 min of the chromatographic run, and required a minimal dilution of the samples, which in turn allowed to obtain the most sensitivity.
Other aspect that required careful consideration was the need to fully stop the conversion of FOS to PHT during sample manipulation and storage in the cases where the prodrug was present in the donor solution. Since immediately putting and handling the samples on ice only provided a partial and, therefore,
insufficient solution, the collection of the samples to microtubes containing 20 μL of PCA 10% followed by agitation by vortex was tested, with the results showing that this procedure caused a total inactivation of the enzymatic degradation/metabolism of FOS. Hence, the use of PCA 10% in the sample preparation procedure constituted a strategy that simultaneously precipitated all the proteins and terminated the bioconversion of FOS, thus eliminating any inaccuracy of the results due to the continued formation of PHT after sampling. Samples were frozen at this point and simply thawed at room temperature before adding the IS and
centrifuging them to obtain the supernatants that were injected into the chromatograph, further expediting the sample preparation.
3.3. Analytical method validation
3.3.1. Selectivity
After analyzing the extracts of blank matrix samples from six different sources and comparing them with matrix samples spiked with the analytes at the LLOQ and IS, no significant interferences from endogenous compounds, metabolites or degradation products were found at the retention times of HPPH, FOS, PHT and
ACCEPTED MANUSCRIPT
3.3.2. Linearity
Linearity was evaluated with calibration standards spanning from 0.2 to 30 μg/mL. As there was lack of random distribution of the error in the residuals vs concentration plot (heteroscedasticity after applying a F-test), a weighted linear regression analysis was performed as previously described (Almeida et al., 2002). The 1/y2 weighting factor was selected for all analytes because it offered the best goodness of fit, considering the plots of percentage relative error (%RE) vs concentration and the sum of absolute %RE values across the concentration range. The back-calculated concentrations of the calibration standards for all analytes were within the deviation from the nominal concentrations recommended by the FDA and EMA guidelines, ranging from -11.2 to 16.2% for the LLOQ and from -6.8 to 9.6% for the other calibration standards. The obtained calibration curves were therefore linear for the three analytes over the complete concentration range (Table 1). Since the total plasmatic therapeutic window of PHT is 10-20 μg/mL (Stella, 1996), most of
Fig. 2 Representative chromatograms obtained by the developed LC method at 215 nm. A - Blank matrix. B - Matrix spiked with the analytes at the concentration of the LLOQ (0.2 μg/mL) and internal standard. HPPH: 5-(4-hydroxyphenyl)-5-phenylhydantoin; FOS: Fosphenytoin; PHT: Phenytoin; IS: Internal standard.
ACCEPTED MANUSCRIPT
the chromatographic conditions described in Section 2.6.2 might be useful in future in vivo pharmacokinetic studies of the chosen formulations, after a suitable sample preparation and analyte extraction procedure has been developed and optimized for the relevant matrices (brain and plasma).
Table 1 Mean calibration curve parameters for 5-(4-hydroxyphenyl)-5-phenylhydantoin (HPPH), fosphenytoin (FOS) and phenytoin (PHT) obtained with the weighted linear regression analysis using the 1/y2 weighting factor (n = 5).
Analyte Concentration range (μg/mL) Equationa r2
HPPH 0.2-30 y = 0.000036x – 0.000993 0.9989
FOS 0.2-30 y = 0.000023x – 0.000614 0.9996
PHT 0.2-30 y = 0.000035x – 0.000392 0.9996
1 y represents analyte-IS peak area ratio; x represents analyte concentration (μg/mL).
3.3.3. LLOQ, precision, accuracy and dilution integrity
The LLOQs for HPPH, FOS and PHT were experimentally defined as 0.2 μg/mL with both an adequate inter- and intra-day precision (CV ≤ 10.0%) and accuracy (bias between 4.8 and 16.5%) (Table 2). The achieved LLOQ for FOS is especially good since it is lower than the ones reported in the literature (Cwik et al., 1997; Kapoor and Siegel, 2013).
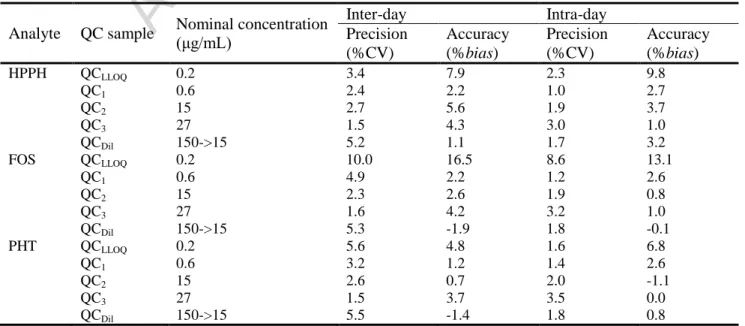
Table 2 Mean inter- and intra-day precision (% of the coefficient of variation, CV) and accuracy (%bias) for the determination of 5-(4-hydroxyphenyl)-5-phenylhydantoin (HPPH), fosphenytoin (FOS) and phenytoin (PHT) in quality control (QC) samples at the lower limit of quantification (QCLLOQ), low (QC1), medium (QC2) and high (QC3) concentrations of the calibration curve range and
in samples subjected to a tenfold dilution (QCDil) (n = 5).
Analyte QC sample Nominal concentration (μg/mL)
Inter-day Intra-day Precision (%CV) Accuracy (%bias) Precision (%CV) Accuracy (%bias) HPPH QCLLOQ 0.2 3.4 7.9 2.3 9.8 QC1 0.6 2.4 2.2 1.0 2.7 QC2 15 2.7 5.6 1.9 3.7 QC3 27 1.5 4.3 3.0 1.0 QCDil 150->15 5.2 1.1 1.7 3.2 FOS QCLLOQ 0.2 10.0 16.5 8.6 13.1 QC1 0.6 4.9 2.2 1.2 2.6 QC2 15 2.3 2.6 1.9 0.8 QC3 27 1.6 4.2 3.2 1.0 QCDil 150->15 5.3 -1.9 1.8 -0.1 PHT QCLLOQ 0.2 5.6 4.8 1.6 6.8 QC1 0.6 3.2 1.2 1.4 2.6 QC2 15 2.6 0.7 2.0 -1.1 QC3 27 1.5 3.7 3.5 0.0 QCDil 150->15 5.5 -1.4 1.8 0.8
ACCEPTED MANUSCRIPT
Regarding the QC samples covering the low, medium and high concentration spectrum of the calibration curve range, the inter and intra-day precision (CV ≤ 4.9%) and accuracy (bias ranging from -1.1 to 5.6%) (Table 2) were within the values recommended by the FDA and EMA guidelines, showing that the described LC analytical method is reproducible and accurate over the established concentration range.
Concerning the dilution integrity evaluation after a tenfold dilution of the QCDil samples with blank matrix,
the inter and intra-day precision (CV ≤ 5.5%) and accuracy (bias between -1.9 and 3.2%) (Table 2) were also acceptable according to the criteria established by the FDA and EMA guidelines, which is especially
important in this case since a dilution of the samples collected from the donor chambers was often required.
3.3.4. Recovery
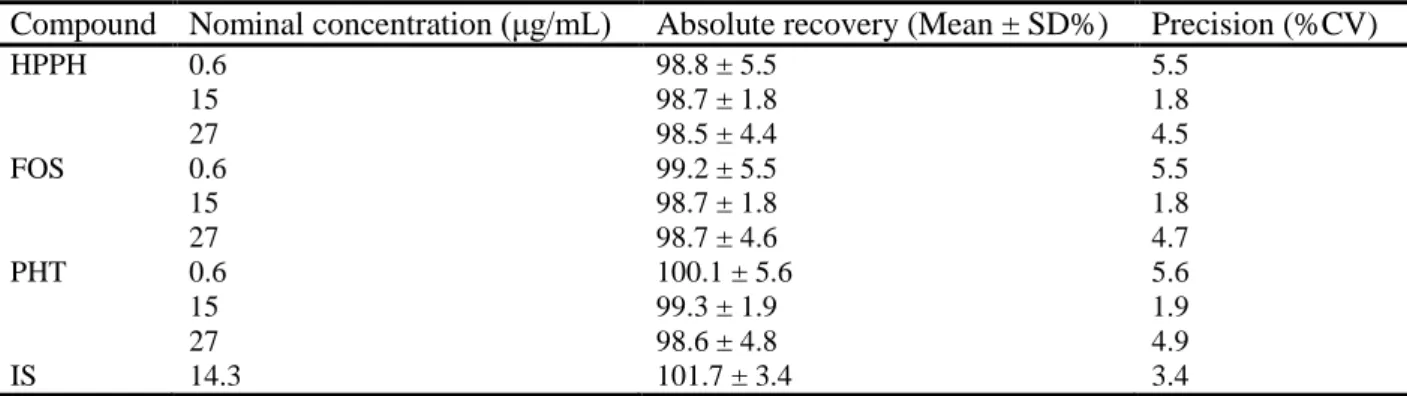
The absolute recoveries for all analytes at the three studied concentration levels (low, medium and high) were extremely high, ranging from 98.5 ± 4.4% to 100.1 ± 5.6% and exhibited a high level of precision (CV ≤ 5.6%) (Table 3). These values show that the developed sample preparation procedure led to a complete recovery of the analytes from the matrix obtained from the Ussing chambers, and allowed the present analytical method to reach a high degree of sensitivity since no analyte was lost during sample preparation. Furthermore, an absolute mean recovery of 101.7 ± 3.4% with a precision of 3.4% was achieved for the IS (Table 3). In combination, these results demonstrate that the extent of recovery of the analytes and IS was high, consistent, precise and reproducible.
Table 3 Absolute recovery and precision (% of the coefficient of variation, CV) of 5-(4-hydroxyphenyl)-5-phenylhydantoin (HPPH), fosphenytoin (FOS), phenytoin (PHT) and internal standard (IS) from quality control (QC) samples at low (QC1), medium (QC2) and
high (QC3) concentrations of the calibration curve range (n = 5 for the analytes and n = 15 for the IS).
Compound Nominal concentration (μg/mL) Absolute recovery (Mean ± SD%) Precision (%CV)
HPPH 0.6 98.8 ± 5.5 5.5 15 98.7 ± 1.8 1.8 27 98.5 ± 4.4 4.5 FOS 0.6 99.2 ± 5.5 5.5 15 98.7 ± 1.8 1.8 27 98.7 ± 4.6 4.7 PHT 0.6 100.1 ± 5.6 5.6 15 99.3 ± 1.9 1.9 27 98.6 ± 4.8 4.9 IS 14.3 101.7 ± 3.4 3.4
ACCEPTED MANUSCRIPT
3.3.5. Stability
All the analytes were stable at the two studied concentrations levels (low and high), in conditions likely to be encountered in every step of the analytical method, namely, during sample handling, storage and analysis. The stability/reference samples ratio ranged from 94.6 to 104.3% (Table 4), which are well within the values recommended by the FDA and EMA guidelines. Specifically, the analytes were shown to be stable in
unprocessed samples at room temperature for 4 h and stored at -20ºC for 28 days and in processed samples at room temperature for 24 h. Importantly, the results obtained with QC3FOS, which only contained FOS, were
similar to the ones obtained with QC3, that comprised a mixture of the three analytes, demonstrating that the
use of PCA 10% in the sample preparation did not allow the continued conversion of FOS to PHT by inhibiting the activity of the alkaline phosphatases present in the matrix.
Table 4 Stability of 5-(4-hydroxyphenyl)-5-phenylhydantoin (HPPH), fosphenytoin (FOS) and phenytoin (PHT) in unprocessed and processed quality control (QC) samples at low (QC1) and high (QC3 and QC3FOS) concentrations of the calibration curve range under
conditions that mimic sample handling, storage and analysis (n = 5).
Analyte QC sample Nominal
concentration (μg/mL)
Unprocessed sample Processed sample Room temperature (4 h) -20ºC (28 days) Room temperature (24 h) HPPH QC1 0.6 96.6% 96.8% 104.3% QC3 27 97.1% 97.9% 98.2% FOS QC1 0.6 96.7% 97.9% 100.3% QC3 27 97.2% 99.1% 98.4% QC3FOS 27 94.6% 99.0% 99.8% PHT QC1 0.6 95.9% 97.6% 103.4% QC3 27 96.9% 98.6% 98.4%
3.4. Bioconversion and permeability studies
3.4.1. Ex vivo bioconversion
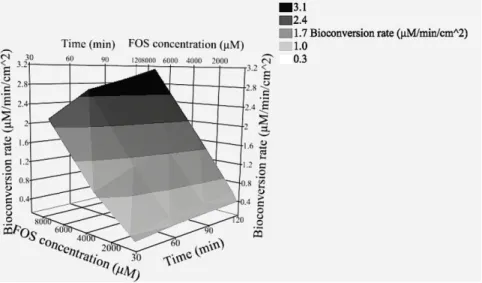
The existence of in situ bioconversion of phosphate prodrugs into the active drug by the nasal mucosa would increase the interest of the prodrug strategy, since it is expected to increase the total permeation of the drug. In the ex vivo studies performed with porcine nasal mucosa mounted in Ussing chambers and simple prodrug buffered solutions the bioconversion of FOS to PHT was detected at a rate ranging from approximately 0.26 to 3.14 μM/min/cm2
. The bioconversion rate increased with both time (two-way ANOVA, p-value < 0.0001), which suggests a diffusion-limited process, and FOS donor solution concentration (two-way ANOVA, p-value < 0.0001) (Fig. 3). These results demonstrate, for the first time, the existence of alkaline phosphatase
ACCEPTED MANUSCRIPT
activity in this tissue, resulting in the bioconversion of FOS to PHT. Importantly, if an ex vivo nasal mucosa model comprising a high dilution of the enzymes present in the mucus due to rinsing and the large chamber volumes has this level of bioconversion activity, the in vivo potential is very promising. In fact, by following the procedure described in Section 2.5, it was possible to detect the bioconversion of FOS to PHT by nasal mucus from healthy human volunteers at all sampling times (1, 2.5 and 4 h), which clearly indicates that even just the mucus displays phosphatase activity (data not shown). This means that the strategy envisaged by Kapoor et al. (Kapoor and Siegel, 2013), based on adding alkaline phosphatase to the formulation to facilitate drug absorption, is unnecessary.
Regarding the possible in situ metabolism of PHT to HPPH, it was not possible to detect the metabolite either in the donor or receiver chambers in any of the bioconversion and permeability studies, independently of drug concentration. This lack of PHT metabolism by the nasal mucosa, at least at detectable levels, can also impact the potential success of the strategy of administering FOS by the intranasal route in a very meaningful way since the active drug is not lost due to metabolic conversion during absorption, which can augment its bioavailability. This can possibly be explained by the fact that even though the existence of CYPs in the nasal cavity has been reported in the literature, the predominant isoforms are CYP1A, CYP2A and CYP2E, whereas PHT is mainly metabolized by CYP2C9/10 (Chollet, 2002; Wu et al., 2008).
3.4.2. Transepithelial electrical resistance
After performing several preliminary studies to evaluate the TEER of different regions of the cavity nasal mucosa originating from both nasal cavities of the same pig or using distinct pigs, it soon became clear that
Fig. 3 Surface plot of the mean ex vivo bioconversion rate of fosphenytoin (FOS) to phenytoin by porcine nasal mucosa in function of time and FOS concentration as calculated at 30 to 120 min of incubation in KRB at pH 7.4 (n = 8-10). KRB: Krebs-Ringer Bicarbonate buffer.
ACCEPTED MANUSCRIPT
this parameter presents a high degree of variability, even between adjacent mucosal pieces. Mucosas
presenting either very low, very high or highly variable TEER during the preincubation stage were replaced, and TEER was controlled in all used mucosas before adding the donor solution and at the end of the 120 min incubation, and the average TEER (between the beginning and the end of the incubation) was calculated. The average TEER from all the bioconversion/permeability studies ranged from 21 to 30 ohms.cm2. Initial drug concentrations in the donor chambers were quantified experimentally and are summarized in Table S1 (Supplementary material). There were statistical significant differences between the TEER of the study with FOS in KRB at 3398 μM and the TEER of the studies with FOS in KRB at 304 μM and PHT in KRB at 313 μM (Fig. 4).
These TEER values were lower than the reference figures described in the literature (Osth et al., 2002a; Wadell et al., 1999). However, no direct comparisons can be established since a different nasal cavity region was selected for mucosa excision, and it has been reported that both the TEER and other electrophysiological parameters can fluctuate severely depending on the exact region of the nasal cavity from where the mucosa was excised (Osth et al., 2002a).
Since TEER serves as a surrogate measure of the integrity of the tissues (Fortuna et al., 2012), the TEER influence in drug permeability was modeled by linear regression analysis in the following data sets, which complied with the acceptance criteria described in Section 2.7: PHT in KRB at 313 μM, FOS in KRB at 304 μM and FOS in KRB at 3398 μM. A novel data analysis method was developed (described in Section 2.7) to weight the permeability results and compensate for the interference of the TEER of each individual mucosa, which allowed us to safely compare all data sets.
ACCEPTED MANUSCRIPT
3.4.3. PHT and FOS permeability and pH influence
Drug permeability is usually expressed as the apparent permeability coefficient (Papp) (Fortuna et al., 2012;
Osth et al., 2002a; Pund et al., 2013; Wadell et al., 1999). However, the linear regression analysis model that we developed required the logarithmic transformation of this coefficient to obtain a normal distribution, and we will express it as Ln(Papp). We started with the highest PHT concentration that we were able to attain in
KRB (313 μM) and used similar and increasing FOS concentrations to make the necessary comparisons and study the concentration effect. At comparable PHT and FOS concentrations, despite the fact that the two-way ANOVA showed a statistical significant difference between the Ln(Papp
PHT
) of both compounds (p-value = 0.0028), this disparity was really small, such that there were no statistical significant differences at any of the individual studied time points using the Sidak post-hoc test (Fig. 5, A). Hence, it is safe to assume that the use of the prodrug instead of the active drug did not constitute a severe hindrance to the overall drug permeation across the nasal mucosa.
This similar overall drug permeation across the nasal mucosa may have been due to the combination of the bioconversion of FOS to PHT, previously to drug permeation, and permeation of the prodrug itself, followed by bioconversion. Despite the hydrophilic nature of FOS, this last statement is supported by the fact that when the highest prodrug concentration (7378 μM) was tested, FOS was quantifiable in the receiver chambers with a stable Ln(Papp
FOS
), meaning that at sufficiently elevated concentrations, its permeation rate overcame the bioconversion rate (Fig. 5, C).
Fig. 4 Average transepithelial electrical resistance (TEER) of the porcine nasal mucosas obtained from the measurements made in each experiment at the end of the preincubation time and drug/prodrug incubation for all phenytoin and fosphenytoin bioconversion/permeability studies (n = 5-10). Mean ± SEM. FOS: Fosphenytoin; PHT: Phenytoin. * represents a statistical significant difference between the average TEER of the studies (p-value < 0.05) after performing an analysis of variance (one-way ANOVA), followed by a Tukey post-hoc test.
ACCEPTED MANUSCRIPT
By increasing the FOS concentration in the donor solution, Ln(Papp PHT
) tended to similar equilibrium values as the assay progressed, but higher prodrug concentrations led to a faster attainment of that equilibrium because the starting Ln(Papp
PHT
) was greater (Fig. 5, B). Indeed, taking into account the studied FOS
Fig. 5 Natural logarithm of the apparent permeability coefficients of phenytoin [Ln(PappPHT)] and fosphenytoin [Ln(PappFOS)] at
different drug/prodrug concentrations. A - Comparison of Ln(PappPHT) at identical PHT and FOS donor solution concentrations in
KRB at pH 7.4 (n = 6-9). B – Comparison of Ln(PappPHT) at different FOS donor solution concentrations in KRB at pH 7.4 (n =
6-10). C - Ln(PappFOS) with FOS donor solution of 7378 μM in KRB at pH 7.4 (n = 7). Mean ± SEM. Data points are missing at 30 min
in graph A and B because PHT concentrations in the receiver chambers were below the lower limit of quantification of the analytical method. FOS: Fosphenytoin; KRB: Krebs-Ringer Bicarbonate buffer; PHT: Phenytoin; (w): Weighted Ln(PappPHT).
ACCEPTED MANUSCRIPT
(3398 vs 7378 μM, p-value < 0.001) and in one case at 60 min (304 vs 7378 μM, p-value < 0.01), using a Sidak post-hoc test. This reinforces the possible advantage of using the prodrug strategy since, due to its large intrinsic solubility, FOS can be used at much higher concentrations than PHT, presenting a good apparent permeability sooner, which is crucial when using the intranasal route of administration due to the difficulties in retaining drug formulations in the nose. In combination with the results from the bioconversion studies, the conclusions that can be drawn from these data pave the way for the success of using prodrugs not only of PHT but any other CNS-active drug that is equally limited by low solubility and can benefit from the synthesis of phosphate prodrugs.
Taking into consideration the higher polarity and charged nature of FOS in comparison to PHT, it is reasonable to assume that the former mainly permeates the nasal mucosa using the paracellular pathway through hydrophilic porous and tight junctions, while the latter should predominantly resort to the transcellular route due its higher lipophilicity.
In order to better compare our results to the ones available in the literature, an exponential transformation of the Ln(Papp
PHT/FOS
) results can be performed, leading to Papp PHT/FOS
values ranging from approximately 3.8 to 8.7 x10⁻⁶ cm/s, depending on the time and initial donor drug concentration. These values are within the scope of the ones obtained in porcine nasal mucosa by Wadell et al. for the permeation markers D-glucose and mannitol (6.6 and 5.7 x10⁻⁶ cm/s, respectively) (Wadell et al., 1999), which strongly suggests that the integrity of our tissues was not compromised.
Since there is a correlation between permeability in the nasal cavity and drug charge, lipophilicity and molecular weight, it is also useful to compare the Papp of the studied active drug (PHT) with the ones
reported for molecules with similar physicochemical properties. In that regard, an in situ gel of venlafaxine displayed a Papp of approximately 5.9 x10
-6
cm/s in an ex vivo study with sheep nasal mucosa (Pund et al., 2013), while a saline and Krebs-Ringer solution (pH 7.4) of diazepam presented a Papp of about 6.8 and 6.6
x10-6 cm/s, respectively, in rabbit nasal mucosa (Maitani et al., 1997). Once again, these values are relatively similar and in accordance with what we obtained for PHT and FOS.
Since, to the best of our knowledge, there has not yet been performed any ex vivo permeability study in nasal mucosa with PHT or FOS, there is not direct term of comparison. However, there is an ex vivo study with PHT in rat jejunum that presented a Papp of approximately 22 x10
-6
cm/s (Watanabe et al., 2004), which shows that PHT permeates across intestinal mucosa to a much higher extent than nasal mucosa.
ACCEPTED MANUSCRIPT
The previous results were obtained at pH 7.4, but the physiological pH of the nasal mucosa is 5.0-6.5 (Bahadur and Pathak, 2012). Furthermore, at lower pH, FOS is expected to be less charged considering its pKa of 2.04 and 5.89 (Fischer et al., 2003). Therefore, we evaluated the influence of a pH change to 4.5 in PHT and FOS permeability. Surprisingly, the decrease of pH from 7.4 to 4.5 led to a significant reduction of the permeability of both the active drug (Fig. 6, A) and the prodrug (Fig. 6, B). Specifically, after performing a two-way ANOVA, the statistical significance of the global effect of pH as the source of variation was characterized by a p-value of 0.0001 when PHT was quantified in the receiver chambers and of 0.0127 for the assay of FOS. These results contradict what is reported in the literature for other drugs in ex vivo studies made in rabbit nasal mucosa, where a reduction of pH increased the permeability of diazepam, lucifer yellow (Maitani et al., 1997) or even a protein, namely, insulin (Maitani et al., 1992).
Considering that most pH-related changes in permeability are due to the alteration of drug ionization and/or charge, these findings are particularly surprising for FOS since at an acidic pH, it theoretically presents mainly one negative charge instead of the two at physiological pH, which should have led to a lower electrostatic repulsion from the negative charge of the nasal epithelium and higher permeation. However, these results might hint that FOS permeation depends on other factors such as active transport that were partly impaired by the lower pH, besides simple diffusion based on a concentration gradient.
Even though the natural pH of nasal mucosa is slightly acidic, the use of a higher value such as 7.4, for which we obtained better permeability results for both PHT and FOS and showed greater potential, should not be problematic. For example, the nasal mucosal irritation caused by pH changes was evaluated in rats using in situ nasal perfusion and it was found that phosphate buffers with pH 3-10 led to a minimal and equivalent release of total protein and, specifically, of lactate dehydrogenase and 5’-nucleotidase at pH 8, which revealed a good intracellular and membrane integrity, respectively (Pujara et al., 1995). Furthermore, the use of physiological pH can also prove to be advantageous from a safety point of view based on the findings of a study that performed an in vitro evaluation of the rat tracheal ciliary beat frequency, which is a good indicator of mucotoxicity. Notably, van de Donk et al. reported that this parameter was not influenced by Locke-Ringer solutions with pH ranging from 7 to 10, while lower or higher values decreased the frequency (van de Donk et al., 1980).
ACCEPTED MANUSCRIPT
4. Conclusions
The developed ex vivo bioconversion/permeability evaluation method combined with the novel TEER-effect modeling procedure in data analysis is fast, inexpensive, and accurate and it constitutes a valuable tool for the future comparative evaluation of different formulations, while respecting the 3Rs principles by reducing the number of animals used in experimentation. Importantly, it already allowed us to demonstrate the existence of phosphatase activity and FOS bioconversion in nasal mucosa, as well as the favorable nasal permeability of this phosphate ester prodrug. Overall, this study demonstrates the feasibility of formulating phosphate prodrugs of poorly soluble CNS-active drugs in order to increase the solubilized drug doses administered through the nasal route, thus improving direct nose-to-brain drug delivery.
Fig. 6 Natural logarithm of the apparent permeability coefficients of phenytoin [Ln(Papp PHT
)] and fosphenytoin [Ln(Papp FOS
)] at different pH. A - Comparison of Ln(PappPHT) at similar FOS donor solution concentrations in KRB at pH 7.4 and phosphate buffer at
pH 4.5 (n = 5-7). B – Comparison of Ln(PappFOS) at similar FOS donor solution concentrations in KRB at pH 7.4 and phosphate
buffer at pH 4.5 (n = 5-7). Mean ± SEM. FOS: Fosphenytoin; KRB: Krebs-Ringer Bicarbonate buffer; PHT: Phenytoin. *, ** and *** represent a statistical significant difference between Ln(PappPHT) or Ln(PappFOS) at each time point in function of pH (p-value <
0.05, < 0.01 and < 0.001, respectively), after performing an analysis of variance (two-way ANOVA), followed by a Sidak post-hoc test.
ACCEPTED MANUSCRIPT
Acknowledgements
This work was supported by the Portuguese Foundation for Science and Technology (FCT), through the strategic project PEst-OE/SAU/UI0709/2014. The authors also thank the fellowship of Joana Francisco supported by the Programa Operacional Regional do Centro 2007-2013 QREN (Programa “Mais Centro” CENTRO-07-ST24-FEDER-002014). JPN Pharma (Tarapur, India) for donating fosphenytoin sodium, Oviger (Alcains, Portugal) and its staff for providing the porcine nasal mucosas and SAS Institute, Software, Lda. (Lisbon, Portugal) for supplying a license for JMP® Pro 11. Joana Sousa, MSc (University of Coimbra, Coimbra, Portugal) for the explanations regarding the excision and handling of porcine nasal mucosa in ex
vivo studies and Dário Ferreira, PhD (University of Beira Interior, Covilhã, Portugal) for critically reviewing
the novel mathematical data analysis and weighting method.
References
Alelyunas, Y.W., Empfield, J.R., McCarthy, D., Spreen, R.C., Bui, K., Pelosi-Kilby, L., Shen, C., 2010. Experimental solubility profiling of marketed CNS drugs, exploring solubility limit of CNS discovery candidate. Bioorg. Med. Chem. Lett. 20, 7312–7316. doi:10.1016/j.bmcl.2010.10.068 Almeida, A.M., Castel-Branco, M.M., Falcão, A.C., 2002. Linear regression for calibration lines revisited:
weighting schemes for bioanalytical methods. J. Chromatogr. B Analyt. Technol. Biomed. Life Sci. 774, 215–222.
Alvariza, S., Fagiolino, P., Vázquez, M., Rosillo de la Torre, A., Orozco Suárez, S., Rocha, L., 2013. Verapamil effect on phenytoin pharmacokinetics in rats. Epilepsy Res. 107, 51–55. doi:10.1016/j.eplepsyres.2013.09.001
Atef, E., Belmonte, A.A., 2008. Formulation and in vitro and in vivo characterization of a phenytoin self-emulsifying drug delivery system (SEDDS). Eur J Pharm Sci 35, 257–263.
doi:10.1016/j.ejps.2008.07.004
Bahadur, S., Pathak, K., 2012. Physicochemical and physiological considerations for efficient nose-to-brain targeting. Expert Opin Drug Deliv 9, 19–31. doi:10.1517/17425247.2012.636801 Barakat, N.S., Omar, S.A., Ahmed, A. a. E., 2006. Carbamazepine uptake into rat brain following
ACCEPTED MANUSCRIPT
Burstein, A.H., Cox, D.S., Mistry, B., Eddington, N.D., 1999. Phenytoin pharmacokinetics following oral administration of phenytoin suspension and fosphenytoin solution to rats. Epilepsy Res. 34, 129–133.
Carvalho, F.C., Campos, M.L., Peccinini, R.G., Gremião, M.P.D., 2013. Nasal administration of liquid crystal precursor mucoadhesive vehicle as an alternative antiretroviral therapy. Eur J Pharm Biopharm 84, 219–227. doi:10.1016/j.ejpb.2012.11.021
Chollet, D.F., 2002. Determination of antiepileptic drugs in biological material. J. Chromatogr. B Analyt. Technol. Biomed. Life Sci. 767, 191–233.
Cwik, M.J., Liang, M., Deyo, K., Andrews, C., Fischer, J., 1997. Simultaneous rapid high-performance liquid chromatographic determination of phenytoin and its prodrug, fosphenytoin in human plasma and ultrafiltrate. J. Chromatogr. B Biomed. Sci. Appl. 693, 407–414.
Eskandari, S., Varshosaz, J., Minaiyan, M., Tabbakhian, M., 2011. Brain delivery of valproic acid via intranasal administration of nanostructured lipid carriers: in vivo pharmacodynamic studies using rat electroshock model. Int J Nanomedicine 6, 363–371. doi:10.2147/IJN.S15881 European Medicines Agency, 2011. Guideline on bioanalytical method validation.
Ferreira, A., Rodrigues, M., Oliveira, P., Francisco, J., Fortuna, A., Rosado, L., Rosado, P., Falcão, A., Alves, G., 2014. Liquid chromatographic assay based on microextraction by packed sorbent for therapeutic drug monitoring of carbamazepine, lamotrigine, oxcarbazepine, phenobarbital, phenytoin and the active metabolites carbamazepine-10,11-epoxide and licarbazepine. J. Chromatogr. B Analyt. Technol. Biomed. Life Sci. 971, 20–29.
doi:10.1016/j.jchromb.2014.09.010
Fischer, J.H., Patel, T.V., Fischer, P.A., 2003. Fosphenytoin: clinical pharmacokinetics and comparative advantages in the acute treatment of seizures. Clin Pharmacokinet 42, 33–58.
doi:10.2165/00003088-200342010-00002
Florence, K., Manisha, L., Kumar, B.A., Ankur, K., Kumar, M.A., Ambikanandan, M., 2011. Intranasal clobazam delivery in the treatment of status epilepticus. J Pharm Sci 100, 692–703. doi:10.1002/jps.22307
ACCEPTED MANUSCRIPT
Fortuna, A., Alves, G., Falcão, A., Soares-da-Silva, P., 2012. Evaluation of the permeability and P-glycoprotein efflux of carbamazepine and several derivatives across mouse small intestine by the Ussing chamber technique. Epilepsia 53, 529–538. doi:10.1111/j.1528-1167.2012.03409.x Heimbach, T., Oh, D.-M., Li, L.Y., Forsberg, M., Savolainen, J., Leppänen, J., Matsunaga, Y., Flynn, G.,
Fleisher, D., 2003. Absorption rate limit considerations for oral phosphate prodrugs. Pharm. Res. 20, 848–856.
Ieiri, I., Goto, W., Hirata, K., Toshitani, A., Imayama, S., Ohyama, Y., Yamada, H., Ohtsubo, K., Higuchi, S., 1995. Effect of 5-(p-hydroxyphenyl)-5-phenylhydantoin (p-HPPH) enantiomers, major metabolites of phenytoin, on the occurrence of chronic-gingival hyperplasia: in vivo and in vitro study. Eur. J. Clin. Pharmacol. 49, 51–56.
Illum, L., 2012. Nasal drug delivery - recent developments and future prospects. J Control Release 161, 254–263. doi:10.1016/j.jconrel.2012.01.024
Jogani, V., Jinturkar, K., Vyas, T., Misra, A., 2008. Recent patents review on intranasal administration for CNS drug delivery. Recent Pat Drug Deliv Formul 2, 25–40.
Kamali, F., Ball, D.E., McLaughlin, W.S., Seymour, R.A., 1999. Phenytoin metabolism to 5-(4-hydroxyphenyl)-5-phenylhydantoin (HPPH) in man, cat and rat in vitro and in vivo, and susceptibility to phenytoin-induced gingival overgrowth. J. Periodont. Res. 34, 145–153. Kapoor, M., Siegel, R.A., 2013. Prodrug/Enzyme Based Acceleration of Absorption of Hydrophobic
Drugs: An in Vitro Study. Mol. Pharmaceutics 10, 3519–3524. doi:10.1021/mp400272m Kugler, A.R., Annesley, T.M., Nordblom, G.D., Koup, J.R., Olson, S.C., 1998. Cross-reactivity of
fosphenytoin in two human plasma phenytoin immunoassays. Clin. Chem. 44, 1474–1480. Maitani, Y., Asano, S., Takahashi, S., Nakagaki, M., Nagai, T., 1992. Permeability of insulin entrapped in
liposome through the nasal mucosa of rabbits. Chem. Pharm. Bull. 40, 1569–1572.
Maitani, Y., Ishigaki, K., Takayama, K., Nagai, T., 1997. In vitro nasal transport across rabbit mucosa: Effect of oxygen bubbling, pH and hypertonic pressure on permeability of lucifer yellow, diazepam and 17 β-estradiol. International Journal of Pharmaceutics 146, 11–19.


![Fig. 5 Natural logarithm of the apparent permeability coefficients of phenytoin [Ln(P app PHT )] and fosphenytoin [Ln(P app FOS )] at different drug/prodrug concentrations](https://thumb-eu.123doks.com/thumbv2/123dok_br/18178631.874277/26.892.98.679.86.862/natural-logarithm-permeability-coefficients-phenytoin-fosphenytoin-different-concentrations.webp)
![Fig. 6 Natural logarithm of the apparent permeability coefficients of phenytoin [Ln(P app PHT )] and fosphenytoin [Ln(P app FOS )] at different pH](https://thumb-eu.123doks.com/thumbv2/123dok_br/18178631.874277/29.892.90.675.86.586/natural-logarithm-apparent-permeability-coefficients-phenytoin-fosphenytoin-different.webp)