Integration of Water Ecosystem Services Provision
Objectives into Forest Management Planning Models
Review of decision support system tools implemented in the field
of water resources management
Lyazzat Syrlybayeva
Dissertation to obtain a Master’s Degree in
Mediterranean Forestry and Natural Resources Management
(MEDfOR)
Supervisors: Professor José Guilherme Calvão Borges
Dr. Patricia María Rodríguez González
Jury:President: Doutor Pedro César Ochôa de Carvalho, Professor Auxiliar do Instituto Superior de Agronomia da Universidade de Lisboa.
Members: Doutora Patricia María Rodríguez González, Investigadora Auxiliar do Instituto Superior de Agronomia da Universidade de Lisboa;
Doutor Francisco Carlos Silva Nunes Godinho, Consultor do Conselho Nacional da Água;
Doutora Brigite Roxo Botequim, Bolseira de Investigação Pós-Doc do Instituto Superior de Agronomia.
2
“Be the change you wish to see in the world.”
Mahatma Gandhi
3 ACKNOW LEDGEMENTS
I would like to express my sincere gratitude for every single person and every single opportunity that came along my way to make this achievement possible. With all my heart I want to dedicate this work to my mother and father, who in spite of all the hardships, are always there for me to encourage and give me strength.
My appreciation to the European Union’s Erasmus Mundus Programme for gifting the chance to pursue educational goals to so many people around the world. To consortium directors of the MEDfOR Programme: Professors José Guilherme Calvão Borges, University of Lisbon; Davide Pettenella, Univeristy of Padua; Felipe Bravo, University of Valladolid. I would also like to thank MEDfOR Programme’s secretary and co-coordinator Catarina Tavares, for all the invaluable services and her patience.
My heartfelt gratitude to my supervisors Professor José Guilherme Calvão Borges and Dr. Patricia María Rodríguez González, for their guidance, valuable advice and an endless support that helped to make this thesis a reality.
To all members of the ALTERFOR project group, who were always available for help and suggestions, I say thank you.
4 ABSTRACT
In recent years, an integration of water production values for forest ecosystems into forest management planning models has become increasingly important in sustainable forest management. The reason is that both for surface and groundwater resources quantity and quality – forests play a vital role. The main objective of this work is to produce an analysis of forest management planning methods that have been implemented the most frequently for assessing an optimal integrated forest and water management for forested catchments. The research was developed within the framework of Alternative Models and Robust Decision-Making for Future Forest Management (ALTERFOR) Project; being developed to assess Decision Support System (DSS) tools that support sustainable forest management by means of including a variety of ecosystem services. For that purpose, we use a taxonomy of water related ecosystem services based on the classification scheme estimated based on the findings of the project. The taxonomy is used to develop a query of relevant references from 2754 journals, encompassing 46 scientific categories, stored in the ISI Web of Science database over the last 30 years. Query results were analyzed, and decision-making methods were classified and assessed according to their supporting role to forest managers in addressing specific ecosystem services. As forest managers are often confronted with conflicting preferences by owners and stakeholders regarding ecosystem services target levels, the query will further address the potential of decision-making methods to facilitate negotiation and consensus building.
Keywords: Water ecosystem services, sustainable forest management, operations research
5 RESUMO
Nos últimos anos, a integração dos valores de produção de água dos ecossistemas florestais em modelos de planeamento de gestão florestal tem vindo a tornar-se cada vez mais importante na gestão sustentável da floresta. Isto acontece porque as florestas têm um papel vital na quantidade e na qualidade tanto das águas superficiais, como das águas subterrâneas. O principal objetivo deste trabalho é analisar os métodos de planeamento de gestão florestal que têm sido implementados mais frequentemente, para avaliar uma gestão integrada ideal da floresta e da água em bacias hidrográficas florestais.
A pesquisa foi desenvolvida no âmbito do projeto dos Modelos Alternativos e Tomada de Decisão para a Gestão Florestal do Futuro (ALTERFOR), para avaliar as ferramentas do Sistema de Apoio à Decisão (DSS) que sustentam a gestão florestal sustentável através da inclusão de uma variedade de ecossistemas. Para esse feito, foi utilizada uma taxonomia de ecossistemas associados à água baseada num esquema de classificação, por sua vez estimado a partir das conclusões do projeto. A taxonomia foi utilizada para desenvolver uma consulta de referências relevantes de 2754 revistas, abrangendo 46 categorias científicas, armazenadas na base de dados da ISI Web of Science nos últimos 30 anos. Foram analisados os resultados da consulta, bem como os métodos de tomada de decisão foram avaliados e classificados de acordo com o seu papel de apoio aos gestores florestais, na abordagem de ecossistemas específicos. Como os gerentes florestais são frequentemente confrontados com preferências conflituosas por parte de proprietários e das restantes partes interessadas sobre os níveis alvo dos vários tipos de ecossistema, essa consulta abordará ainda mais o potencial dos métodos de tomada de decisão para facilitar a negociação e o alcance de consensos.
Palavras chave: Ecossistemas aquáticos, gestão florestal sustentável, técnicas de pesquisa
6 RESUMO AL ARGADO
O papel das florestas - neste mundo em rápido desenvolvimento, com uma elevada taxa de urbanização problemas climáticos alarmantes - é muito significativo; bem como a importância reconhecida que as florestas têm no ciclo hidrológico. As bacias hidrográficas são uma fonte de grande proporção de água utilizada para fins domésticos, agrícolas, industriais e ecológicos nas áreas a montante e a jusante. Um dos maiores desafios do momento é maximizar a ampla gama de benefícios florestais em múltiplos setores e, ao mesmo tempo, não prejudicar os recursos hídricos e a função do ecossistema. Isso pode ser abordado através da compreensão mais aprofundada das interações entre as florestas e a água (Calder, 2006).
O objetivo deste estudo é apresentar técnicas de planeamento de gestão florestal multiusos que têm sido utilizadas para incluir a produção e a proteção de água nas estratégias de gestão florestal. Neste contexto, foi desenvolvida uma revisão científica e analisado até que ponto a integração dos recursos hídricos na resolução de problemas de gestão florestal avançou. Os artigos foram avaliados através de critérios, que devem ajudar os gestores florestais e os autores das tomadas de decisão a ter dados disponíveis sobre os conhecimentos de campo anteriores.
Para esta pesquisa utilizámos uma taxonomia de ecossistemas aquáticos, com base no esquema de classificação estimado no âmbito dos Modelos Alternativos e Tomadas de Decisão complexas para o Projeto Futuro de Gestão Florestal (ALTERFOR). Para determinar todas as publicações relevantes, utilizámos a taxonomia para desenvolver uma consulta de referências. Como resultado, realizámos uma pesquisa bibliográfica, abrangendo aproximadamente os últimos 30 anos, dos estudos de campo e dos artigos de revisão relacionados com a integração dos recursos hídricos no planeamento de gestão florestal. Utilizámos uma lista de termos comuns para alocar publicações no nosso campo de interesse. Além desses, os termos específicos foram os seguintes: Floresta + Água, Floresta + Hidrologia, Floresta + Gestão de Bacias Hidrográficas, Floresta + Proteção de Bacias Hidrográficas.
É importante referir que com o conjunto "Floresta + Água" obtivemos o maior número de resultados. No entanto, a maioria das publicações que foram classificadas como relevantes continham explicações sobre os processos hidrológicos dentro das florestas, como a disponibilidade de água no solo e o teor de água, mas também sobre as operações florestais
7
que afetam o nível de produção de água. São parâmetros extremamente relevantes, mas foram excluídos dado o objetivo desta pesquisa. Portanto, o rastreio de todos os resumos resultou em 21 documentos relevantes selecionados. Nesses artigos e revisões científicas foi considerada a integração dos ecossistemas aquáticos nos modelos de resolução de problemas de planeamento de gestão florestal e foram explicados os resultados dos correspondentes estudos e revisões.
Selecionadas as publicações, foi definido um conjunto de campos cobertos por todos os artigos analisados. Os critérios de maior significância foram a "relevância" dos estudos para o planeamento de gestão florestal; em caso de relevância, foram avaliados também outros critérios. Em primeiro lugar, foram tomadas em consideração a origem da pesquisa e a data de publicação. Em segundo lugar, analisámos quais das técnicas operacionais de pesquisa foram revistas no artigo. É importante para tirar uma conclusão sobre os métodos de planeamento de gestão florestal mais utilizados, quando o objetivo não é focar exclusivamente a produção de madeira: neste caso, também em ecossistemas aquáticos. Devido à diversidade das publicações científicas incluídas nesta pesquisa, foi imperativo classificá-las de acordo com uma nomenclatura comum para caraterizar as dimensões do problema. Portanto, as dimensões do FORSYS (Sistema de Apoio à Decisão de Gerenciamento Florestal) foram aplicadas para completar os dados de análise nas publicações selecionadas com relevância para o objetivo da pesquisa.
A pesquisa sobre a integração dos ecossistemas aquáticos nos modelos de resolução de problemas no planeamento de gestão florestal revelou as técnicas mais utilizadas na busca de uma solução equilibrada. De acordo com os resultados, a Programação Linear (LP) foi a técnica predominante, com recurso a outras como a Programação de Objetivos (GP) e a Tabu Search (TS), entre outras. Isto significa que o grupo de abordagens contínuas foi preferido relativamente ao grupo de abordagens discretas. Curiosamente, o elevado número da abordagem LP foi implementado em estudos originados na Turquia, produzindo planos de gestão orientados para a madeira que também consideram os aspetos ambientais, particularmente a produção de água.
Considerando que mais de metade dos artigos relevantes selecionados tinham como base um equilíbrio entre objetivos económicos e ambientais, o seu principal objetivo era garantir que os ecossistemas aquáticos correspondessem aos aspetos produtivos. Muitos estudos revelaram, no entanto, que esse equilíbrio é difícil de conseguir, a menos que os objetivos dos decisores estejam bem ponderados e as restrições ambientais não sejam severamente restritas.
8
Um grande número de artigos foi revisto para esta pesquisa, embora o número de publicações relevantes sem foco exclusivo nos ciclos e processos hidrológicos nas florestas fosse bastante baixo. Tendo refletido sobre os dados desta pesquisa, podemos afirmar que a maioria dos planos de gestão estava orientada ao nível da floresta. É importante considerar a bacia hidrográfica e a respetiva gestão à escala, a fim de compreender as ligações naturais entre as áreas a montante e a jusante. Isto permite-nos concluir que a abordagem transdisciplinar é essencial, ou seja, é fundamental utilizar uma estratégia que atravessa fronteiras multidisciplinares para criar uma abordagem holística.
9 TABLE OF CONTENTS
ACKNOWLEDGEMENTS ... 3
ABSTRACT ... 4
RESUMO ... 5
RESUMO ALARGADO ... 6
LIST OF FIGURES ...10
LIST OF TABLES ...10
1.
INTRODUCTION ...11
1.1 RESEARCH PROBLEM: FOREST AND WATER INTERACTION ... 11
1.2 RESEARCH PROBLEM: FOREST MANAGEMENT PLANNING ... 14
1.3. GOAL OF THE RESEARCH ... 15
2.
MATERIAL AND METHODS...16
2.1 EVALUATION OF WATER-RELATED ECOSYSTEM SERVICES ... 16
2.2 DATA COLLECTION AND PROCESSING ... 17
2.2.1. ANALYSIS OF THE OUTCOME OF DATA PROCESSING ... 19
3.
RESULTS ...23
3.1. GRAPHICAL REPRESENTATION OF GENERAL OUTPUTS... 23
3.2. GRAPHICAL REPRESENTATION OF RELEVANT ARTICLES ... 27
3.3. CLASSIFICATION OF RELEVANT PUBLICATIONS ACCORDING TO WATER ECOSYSTEM SERVICES INDICATORS ... 32
3.3.1. PUBLICATIONS ASSESSED ACCORDING TO WATER YIELD INDICATOR .... 32
3.3.2. PUBLICATIONS ASSESSED ACCORDING TO FLOOD PROTECTION INDICATOR ... 35
3.3.3. PUBLICATIONS ASSESSED ACCORDING TO WATER FLOW MAINTENANCE INDICATOR ... 35
3.3.4. PUBLICATIONS ASSESSED ACCORDING TO EROSION CONTROL INDICATOR ... 35
3.3.5. PUBLICATIONS ASSESSED ACCORDING TO CHEMICAL CONDITIONS INDICATOR ... 37
4.
DISCUSSIONS AND CONCLUSIONS ...38
10 LIST OF FIGURES
Figure 1-1. Groundwater recharge relative to canopy cover (Ellison et al., 2017) ________ 13 Figure 3-1. The percentage of publications relevant to the aim of the study, and water
services indicators _________________________________________________________ 23 Figure 3-2. The percentage of “Yes” category publications according to each indicator ___ 24 Figure 3-3. The number of “Yes” category articles per water ecosystem services indicator 24 Figure 3-4. The frequency of publications per water services indicator 1 _______________ 25 Figure 3-5. The frequency of publications per water services indicator 2 _______________ 25 Figure 3-6. The frequency of publications per water services indicator 3 _______________ 26 Figure 3-7. The frequency of publications per water services indicator 4 _______________ 26 Figure 3-8. The frequency of publications per water services indicator 5 _______________ 27 Figure 3-9. Frequency of “Relevant” category publications per year___________________ 31 Figure 3-10. The percentage of “Relevant” category publications per water indicator _____ 32
LIST OF T ABLES
Table 2-1. Basic level, indicators related with stand-level DSS outputs ... 16 Table 2-2. The list of specific and common words used in the survey ... 18 Table 2-3. Forest management problem type dimensions (Eriksson et al., 2014) ... 19 Table 3-1. The list of all selected “Relevant” publications classified according to the
11 1. INTRODUCTION
1.1 R ESEARCH PROBLEM : FOREST AND W ATER INTERAC TION
Fresh water is vital to sustain human health and life; however, the availability and quality of water today is more threatened by overuse, misuse and pollution in many regions over the globe, comparing to the past. Pressure on water resources is expected to increase – by the year 2025 – 1.8 billion people are predicted to be living in regions with absolute water scarcity, whilst the other two-thirds of the world’s population might experience water stress conditions (FAO, 2013).
The role of forests – in this rapidly developing world, with high urbanization rate and alarming climatic issue – is very significant; as well as the recognized importance forests have in the hydrological cycle. Forested catchments are a source of large proportion of water used for domestic, agricultural, industrial, and ecological purposes in both upstream and downstream areas. A major challenge here is to maximize the wide range of forest benefits in multiple sectors and, at the same time, not let a detriment to water resources and ecosystem function. This can be addressed by means of better understanding the interactions between forests and water (Calder, 2006).
A meta-study conducted for the World-Wide Fund for Nature (WWF) about forest protection playing a vital role in drinking-water provision, including a survey consisting of information of more than 100 of the world’s most populous cities, has revealed that there is a clear link amongst forests and water quality coming out of a catchment (Stolton & Dudley). Due to low input of nutrients, pesticides and other chemicals – natural and managed forests contribute in higher quality of water, comparing to more intensive land uses, i.e. agriculture. Although, not only the quality of water is affected by forests, but also water-related risks, such as floods, landslides or droughts are reduced; forests also help to prevent desertification and salinization. Therefore, the benefits of forests for the water supply are multiple (FAO, 2013). Anthropogenic land-use transformations and deforestation have also influenced climate, ecosystems, the sustainable ways of livelihoods, as well as wildlife (Steffen et al., 2015). The 18% of current global warming trends could be explained by land cover change. Whereas, deforestation is one of the causes that influences warming, changes the amount of rainfall and availability of water, whilst emission of greenhouse gases is another adversity (Ellison et al, 2017).
12
Climate change is expected to have an adverse effect on water availability and quality globally. The Fourth Assessment Report of the Intergovernmental Panel on Climate Change (IPCC) forecasted alterations in the current amount, the temporal and the spatial variation of precipitation, most likely in every region of the world. Increase in precipitation levels or change in its pattern, may lead to harmful impacts, such as torrential rain, floods and landslides, which will have a negative effect on human lives, infrastructure and quality of water. It is worth stating that forests play an important role in climate change mitigation: regulation of microclimates, carbon storage and sequestration, as well as provision of products to substitute fossil energy (FAO, 2013).
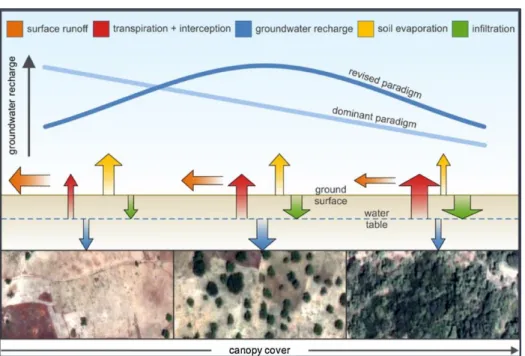
Additionally, forests are often described as “sponges”, which store rain water and slowly release it to maintain groundwater and streams in the times of dry periods. Three major properties of forest watersheds generally responsible for the quantity and quality of water flow are – interception, evapotranspiration, and infiltration. Important hydrological changes may occur due to removal of forest cover from a forested watershed. For instance, it may result in decreased level of interception of rainfall by the forest canopy, decrease in evapotranspiration and decreased rainfall interception by surface litter, as well as an increase of runoff volumes (Stednick, 1996).
Research by Ellison et al. (2017) graphically illustrated in Figure 1-1. represents the definition of revised paradigm or optimum tree cover theory, suggesting that an absence of tree cover on degraded land reduces the amount of water, which can infiltrate into the soil. Consequently, it moves slowly and through Evapotranspiration (ET) is easily lost, which leads to low groundwater recharge. On the other end, denser tree cover can also lead to reductions in groundwater recharge, when the loss from transpiration and interception surpasses the hydrologic gains from infiltration. Whereas, intermediate tree cover on degraded lands may maximize groundwater recharge.
13
Figure 1-1. Groundwater recharge relative to canopy cover (Ellison et al., 2017)
Apart from the recognized significance in the hydrological cycle, forests provide a wide range of ecosystem services. The ecosystem services concept helped to broaden the framework of perception of ecosystems from focusing solely on tangible products to a consideration of ecosystem services more inclusively (Ellison et al., 2017). The Water Framework Directive (WFD) requires a positioning that states: rather than targeting the availability of water with good chemical quality, it is more ambitious to ensure good ecological quality of the natural environments. Thus, approaches using ecosystem services could potentially support WFD objectives. There is a number of key regulatory functions, which are supported by aquatic ecosystems: flood plains regulate the water regime (storage during floods and release during low levels of water), as well as distribution of water in time (prevention of flood risk), the scale of runoff and water body recharge. The maintenance of fluvial corridors and biodiversity, reduced flood risks in vulnerable zones, which is promoted by the preservation and restoration of river dynamics. Often, due to hydro-morphological alterations, which alter river dynamics and correct functioning of the aquatic ecosystem, the capacity of aquatic systems degrades: as well as supporting services, such as soil formation, nutrient cycles, photosynthesis, water cycle (Blancher et al., 2011).
14
1.2 R ESEARCH PROBLEM: FOREST MAN A GEMENT PLANNING
Forest management planning is an essential tool in forestry-related decision making; it provides support for decision making in forestry, particularly, providing the best solution set for management of a forest planning area. Typically, forest planning problems are described to have several different treatment schedules for each stand in a forest, as a possible alternative. A large number of different production programmes help to obtain treatment schedules for stands with a variety of combinations: the end result of these programmes, normally, is a forest planning management plan, with a recommended production programme for a forest, with predictions of the consequences of implementing the plan.
The question forest management planning seeks to answer is the definition of the timing and location of forest management options, in order to approximate or optimize management objectives; that are single or multiple and relate to goods and services that are traded or non-traded, subject to resource constraints. Therefore, the output of a management planning process ideally includes:
i. an efficient set of actions,
ii. trade-offs between management goals,
iii. impacts of changing and uncertain parameters.
The main phases in a forest planning process – problem identification and modelling: (Davis et al., 2001)
1. Clarification of criteria and preferences of decision maker(s) 2. Identification and acquisition of management goals
3. Criteria for assessing the impacts of decisions on the goals
4. Project, activities, generation of management alternative or variables decision for forest stands
5. Definition of an objective function 6. Expression of a set of constraints
The rapid growth of the world’s population and economies, increases the demand on forest resources, which makes the constant supply of ecosystem services crucial. This has raised new demands both for tools that are able to support an understanding of environmental issues, and for the development and evaluation of alternative management options. To solve various decision problems with integration of database management systems – including analytical and operational research models – Decision Support Systems (DSS) have been proven not
15
only to solve, but to provide a range of reporting capabilities. The report and special issue of the European Cooperation in Science and Technology (COST) Action FORSYS (the Forest Management Decision Support Systems) is the latest compilation of forest management decision support systems. The main purpose of the FORSYS was to identify and assess the support, which computerized tools can provide to enhance forest management planning problems in real-world context (Vacik et al., 2014). Holsapple & Whinston (1996) described features of a DSS in terms of “a computer-based system composed of a language system, presentation system, knowledge system, and problem-processing system whose common purpose is the support of decision-making activities”. Application of a DSS in fields of forest management planning and decision-making supports the maintenance of the processes in the forest ecosystem in a balanced and sustainable order. At the same time attempting to satisfy the societal needs for a broad variety of demanded ecosystem services (Reynolds et al., 2008).
1.3. GOAL OF THE RESEARCH
The aim of this study is to present multiple-use forest management planning techniques that have been used to accommodate water production and protection objectives to form forest management strategies. In this context, a review of publications has been developed, and analyzed to what extent the integration of water resources in forest management problem solving has advanced. The articles have been assessed through criterions, which shall help forest managers and decision makers to have availability of data regarding the previous expertise in the field.
16 2. MATERIAL AND METHODS
2.1 EVALUATION OF W ATER -RELATED ECOSYSTEM SERVIC ES
According to the Millennium Ecosystem Assessment (MA) classification scheme, fresh water is not only a provisioning service, referring to the human consumption in agriculture, domestic and industrial use; but, also vital in sustaining inland water ecosystems: like rivers, lakes and wetlands. These ecosystems provide regulating, cultural and supporting services, which contribute through maintenance of water quality, buffering of flood flows and erosion control, as well as climate regulation, recreation, scenic values and maintenance of fisheries.
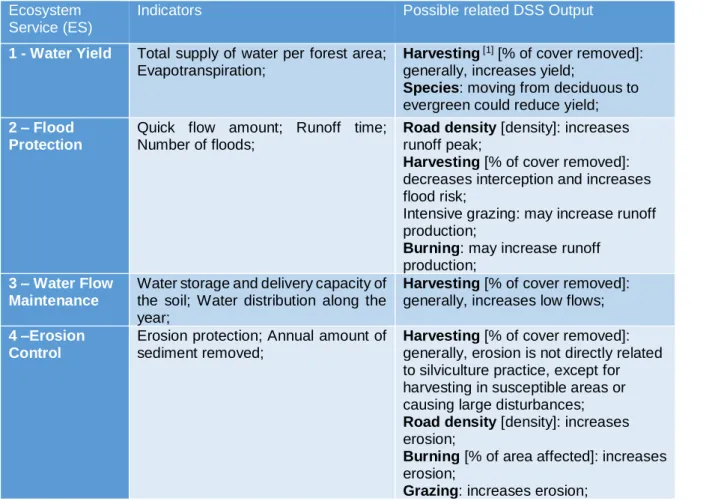
For the purpose of this research, however, we used a taxonomy of water related ecosystem services based on the classification scheme estimated within the framework of Alternative Models and Robust Decision-Making for Future Forest Management (ALTERFOR) Project. As seen in Table 2-1. each water ecosystem service has indicators related with identified DSS outputs.
Table 2-1. Basic level, indicators related with stand-level DSS outputs
Ecosystem Service (ES)
Indicators Possible related DSS Output
1 - Water Yield Total supply of water per forest area; Evapotranspiration;
Harvesting [1] [% of cover removed]: generally, increases yield;
Species: moving from deciduous to evergreen could reduce yield; 2 – Flood
Protection
Quick flow amount; Runoff time; Number of floods;
Road density [density]: increases runoff peak;
Harvesting [% of cover removed]: decreases interception and increases flood risk;
Intensive grazing: may increase runoff production;
Burning: may increase runoff production;
3 – Water Flow Maintenance
Water storage and delivery capacity of the soil; Water distribution along the year;
Harvesting [% of cover removed]: generally, increases low flows; 4 –Erosion
Control
Erosion protection; Annual amount of sediment removed;
Harvesting [% of cover removed]: generally, erosion is not directly related to silviculture practice, except for harvesting in susceptible areas or causing large disturbances; Road density [density]: increases erosion;
Burning [% of area affected]: increases erosion;
17
5 – Chemical Conditions
Water quality; Concentration of Nitrogen, Phosphorus; Concentration of toxic elements;
Applied chemicals [kg/ha/year]: potentially increases nutrients, toxins; Harvesting [% of cover removed]: increases nutrient leaking, based on intensity;
Burning [% of area affected]: increase nutrients and other water quality parameters;
Species: broadleaves are generally associated with less nitrogen leak than conifers;
Age: minimum of nutrients leaks when forest reaches maturity, increases for old-growth forests;
[1] With harvesting in the following tables we describe all different operations involving trees removal
2.2 D ATA COLLEC TION AND PROCESSING
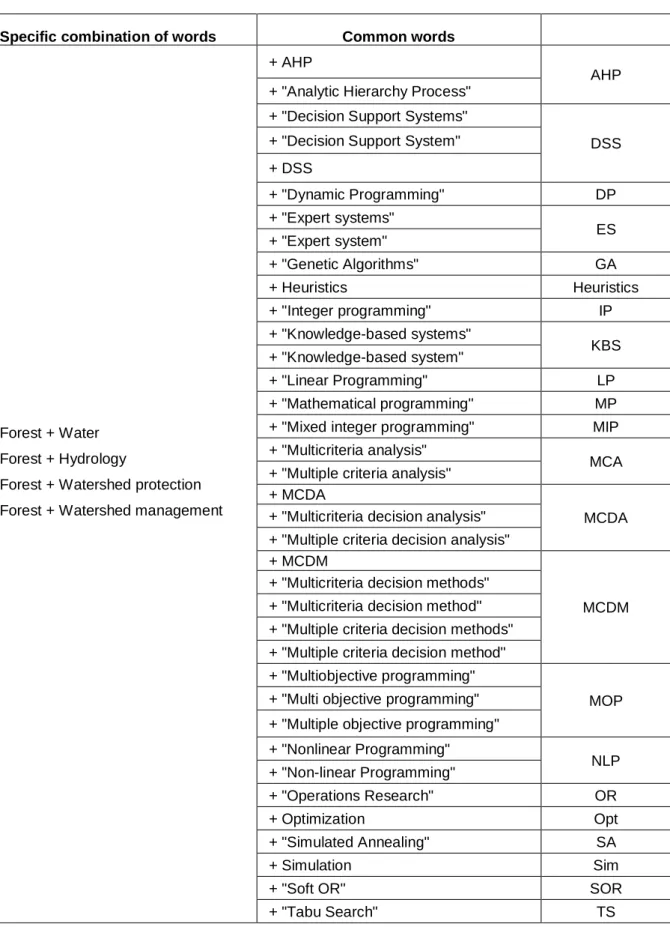
The taxonomy is used to develop a query of relevant references amongst 2754 journals, encompassing 46 scientific categories, stored in the ISI Web of Science database. To determine all relevant publications, we performed a literature search, encompassing approximately the last 30 years, for field studies and review papers related to integration of water resources in forest management planning. With a timeframe: 1986-2017, we searched the database, using a set of specific and common words. The list of common terms, used to allocate publications in the field of our interest, are presented below in Table 2-2. In addition to common, the specific terms were as follows: Forest + Water, Forest + Hydrology, Forest + Watershed Management, Forest + Watershed Protection. For further selection and reviewing of all the relevant publications, we focused on the studies which give an insight on forest management planning models that are used in solving real world problems.
The initial number of papers returned per combination of “specific word + common word”, which was ranked “relevant” in Web of Science, was 4039. During the process, most of the scientific articles and review papers that were relevant to “Simulation” technique and an identical common word, were identified to be less relevant to this research. The field of use of hydro-economic simulation models is to examine and evaluate “what if” scenarios, which consist of specific management decisions under conditions, such as climate or water demands. Simulation models are relatively precise and excellent for the ability to mimic field behavior (Heinz et al., 2007). Nevertheless, contents of the abovementioned publications were related to simulation of a variety of processes in forest management, and the studies, as an outcome, have not proposed a solution to problems of management planning within a forest.
18
Table 2-2. The list of specific and common words used in the survey The list of specific and common words used in the survey Specific combination of words Common words
Forest + Water Forest + Hydrology
Forest + Watershed protection Forest + Watershed management
+ AHP
AHP + "Analytic Hierarchy Process"
+ "Decision Support Systems"
DSS + "Decision Support System"
+ DSS + "Dynamic Programming" DP + "Expert systems" ES + "Expert system" + "Genetic Algorithms" GA + Heuristics Heuristics + "Integer programming" IP + "Knowledge-based systems" KBS + "Knowledge-based system" + "Linear Programming" LP + "Mathematical programming" MP + "Mixed integer programming" MIP + "Multicriteria analysis"
MCA + "Multiple criteria analysis"
+ MCDA
MCDA + "Multicriteria decision analysis"
+ "Multiple criteria decision analysis" + MCDM
MCDM + "Multicriteria decision methods"
+ "Multicriteria decision method" + "Multiple criteria decision methods" + "Multiple criteria decision method" + "Multiobjective programming"
MOP + "Multi objective programming"
+ "Multiple objective programming" + "Nonlinear Programming" NLP + "Non-linear Programming" + "Operations Research" OR + Optimization Opt + "Simulated Annealing" SA + Simulation Sim
+ "Soft OR" SOR
19
Therefore, 3.365 publications, which were relevant to the “Simulation” technique were omitted from the initial number of results. The next step was to check the result of 674 articles for any possible repetitions, and after the test, the number of articles was reduced to 470. Furthermore, the reviews were scanned according to their title and abstract. After which, assessed according to the parameters aforementioned in Table 2-1.
It is important to note that the set “Forest + Water” gave the highest number of results amongst the others. However, most of the publications that were ranked relevant – explained hydrological processes within forests, such as water availability in soil, water content level, as well as explanation of forest operations affecting water yield level; all of these is immensely significant, but the aim of this survey excluded these parameters. Therefore, the outcome after scanning all the abstracts resulted in 21 selected relevant papers. These articles and review papers considered water related ecosystem services integration in the forest management planning problem solving models and explained the outcomes of their studies and reviews.
2.2.1. ANALYSIS OF THE OUTCOME OF DATA PROCESSING
Once the publications have been selected, the next step was to define a set of fields covered by all the articles analyzed. The criteria of the highest significance were the “relevance” of the studies to forest management planning; in case, if relevant, further criterions were evaluated. Firstly, the origin of the research and date published were taken into consideration. Secondly, we analyzed which of the operations research techniques were reviewed in the article. This is important to be able to draw a conclusion regarding the most frequently used forest management planning methods, when the aim is multiple, and not focused solely on wood production: in this case, also on water related ecosystem services.
Due to the diversity of the scientific publications included in this survey it was imperative to classify them according to a common nomenclature in order to characterize the problem dimensions. Therefore, the FORSYS framework dimensions (presented in Table 2-3.) were applied to complete the analysis and process data within publications selected to be relevant to the research aim.
Table 2-3. Forest management problem type dimensions (Eriksson et al., 2014) Temporal scale
➢ Long-term (strategic) management planning. Planning horizon extending over more than 10 years.
20
➢ Medium-term (tactical) management planning. Planning horizon extending from 2 to 10 years.
➢ Short-term (operational) management planning. Planning horizon extending over 1 year or less, typically including planning periods of one month or less.
Spatial context
➢ Spatial with neighborhood relations. The interactions of decisions made for neighboring stands (or other areal units) are of importance, i.e. a decision made for one stand may i) constrain decisions for neighboring stands or ii) influence the outcome of decisions made for neighboring stands.
➢ Spatial with no neighborhood interrelations. Locations of forest operations are of importance, but it is assumed that a decision made for one stand does not constrain decisions for neighboring stands or influence the outcome of decisions made for neighboring stands.
➢ Non-spatial. Stands may be aggregated into strata or analysis units without considering their mutual locations. There is no concern with locational specificity or neighborhood interrelations.
Spatial scale
➢ Stand level. Focused on units with homogenous ecological, physiographic and development features.
➢ Forest level. Focused on forest landscapes with several stands managed for (a) common purpose(s).
➢ Regional/national level. Focused on sets of landscapes that may all be managed for different objectives.
Decision-making dimension
➢ A single decision-maker makes the decision on his/her own, e.g. the forest owner. ➢ One or more decision-makers have the power to decide. In addition, there can be
other parties (stakeholders) with no formal decision-making power that are influenced or may influence the decision.
Objective dimension
21
➢ Multiple. The management planning problem addresses two or more objectives, any pairs of which could be conflicting, complementary or neutral with respect to each other.
Goods and services dimension
➢ Market wood products. The management planning problem addresses the supply of wood products that are traded in the market (Round wood, pulpwood, biomass…) ➢ Market non-wood products. The management planning problem addresses the
supply of non-wood products that are traded in the market (fruits, cork…)
➢ Market services. The management planning problem addresses the supply of services that may be traded in the market (recreation, hunting, fishing…)
➢ Non-market services. The management planning problem addresses the supply of services that are typically not traded in the market (public goods, aesthetic values, water, biodiversity…)
Consequently, for the next step, it was important to identify the temporal scale of forest management planning: it can be either strategic, tactical or operational. In the context of forest, strategic planning usually stands for long term planning and for larger areas, with time horizons from 10 years onwards. Whereas, in tactical forest planning, the time horizon is typically from 2 to 10 years. This type of planning typically includes stand wise recommendations. And, operational planning helps to carry out these recommendations in greater details. Generally, operational plans are used to describe how to implement the objectives identified in strategic plans.
Thereafter, the spatial context of each case, particularly, assessment of neighborhood relations: whether it was with or without neighborhood interrelations. This is to understand, if interactions of decisions made in neighboring stands can influence the outcome of decisions made in the stands next to each other. Subsequent criteria were the spatial scale of each article that has been analyzed: stand, forest and regional/national levels. The scale of stand level consists of homogenous units according to ecological, physiographic and development features. In case of a forest level, we consider forest landscape with several stands, which typically have a common purpose. Finally, regional/national level is a set of landscapes that may address different objectives and are managed accordingly.
The other information that has been evaluated and recorded is whether there was one or more decision maker, as well as the main objective dimension: either single or multiple. Last, but
22
not the least, the analysis of goods and services evaluation was applied, to understand whether it was market wood/non-wood products, or market/non-market services.
The classification of the relevant scientific publications according to the FORSYS dimensions was significant during the analysis process; it helped to identify the relationship between forest management planning methods and water ecosystem services indicators. Furthermore, the analysis of publications provides more information, which is essential to identify a link between preference-given planning methods in relation to certain temporal or spatial scales, the main dimension of objectives, or the origin of case studies. In other words, it was important to examine the data according to the Operations Research (OR) techniques chosen to deal with each research, bearing in mind that each situation had a variety of factors affecting the choice of management tools.
23 3. RESULTS
3.1. GRAPHICAL REPRESEN TA TION OF GENERAL OU TPU TS
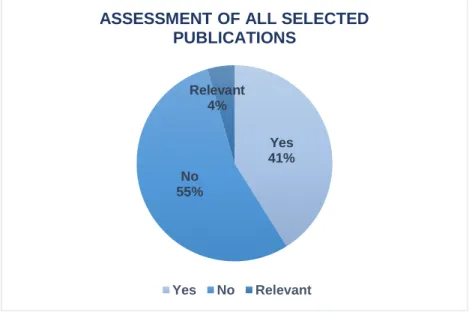
As previously presented in 2.2 Data Collection and Processing section a total of 470 publications have been ranked according to the Table 2-1; according to the classification of water ecosystem services presented by ALTERFOR project group. All the selected papers were assessed to have a link/ a relevant study subject to the indicators identified in the table. The publications that have been ranked as “Relevant” – the ones that are related to the decision-making process in forest management planning, i.e. they explain the implementation of different techniques, as well as solutions they provide. The rest of 449 publications, which have been divided into “Yes” or “No” categories, accordingly representing a clear link with water ecosystem services indicators, or the opposite. The percentage of the outcome could be seen in Figure 3-2.
Figure 3-1. The percentage of publications relevant to the aim of the study, and water services indicators
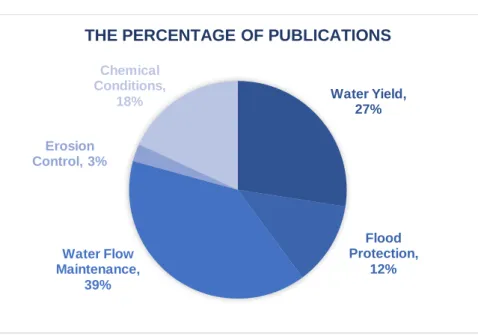
The 193 of publications ranked as “Yes” (41%) have been further analyzed to identify to which exact water ecosystem services indicator (out of five) they could be related to. From presented below Figure 3-2. we can see the percentage of each indicator: whilst, Water Flow Maintenance has the highest number of the relevant publications; Erosion Control has the least. Yes 41% No 55% Relevant 4%
ASSESSMENT OF ALL SELECTED PUBLICATIONS
24
Figure 3-2. The percentage of “Yes” category publications according to each indicator
At the same time, numbers presented in Figure 3-3. graphically represent the amount of scientific publications that belong to each category of water services indicator.
Figure 3-3. The number of “Yes” category articles per water ecosystem services indicator
The graphs presented the next allow us to follow the timeline of frequency of publications related to each indicator of water ecosystem services. Subsequently, graphs are allocated in an order they were introduced in the Table 2-1.
Water Yield, 27% Flood Protection, 12% Water Flow Maintenance, 39% Erosion Control, 3% Chemical Conditions, 18%
THE PERCENTAGE OF PUBLICATIONS
53 24 76 5 35 0 10 20 30 40 50 60 70 80
Water Yield Flood Protection Water Flow Maintenance Erosion Control Chemical Conditions Number of articles
25
Figure 3-4. The frequency of publications per water services indicator 1
A development throughout the last 15 years was more or less steady, while, there is a dramatic increase in 2016.
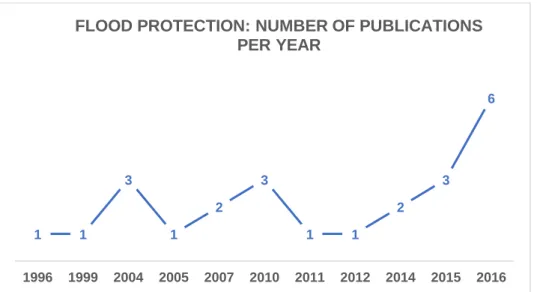
Figure 3-5. The frequency of publications per water services indicator 2
The indicator 2 is seen to have an increase in the recent years and comparing to the indicator 1 – the increase is steadier, with some noticeable downshift in the years of 2011 and 2012.
1 1 1 2 1 2 4 1 4 4 1 3 4 3 7 4 10 WATER YIELD: NUMBER OF PUBLICATIONS PER
YEAR 1 1 3 1 2 3 1 1 2 3 6 1996 1999 2004 2005 2007 2010 2011 2012 2014 2015 2016 FLOOD PROTECTION: NUMBER OF PUBLICATIONS
26
Figure 3-6. The frequency of publications per water services indicator 3
The Water Flow Maintenance indicator has the highest number of publications comparing to all the rest indicators; also, it has one of the oldest publications starting from 1987. Despite the decrease in 2016, the last 15 years have been fruitful in terms of scientific publications in the field.
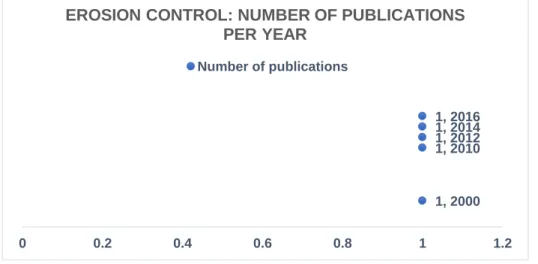
Figure 3-7. The frequency of publications per water services indicator 4
The Erosion Control indicator having the least number of relevant published papers, showed the stable development every consequent 2 years after 2010.
1 1 1 1 2 2 3 1 2 1 3 6 3 6 4 8 5 6 5 10 5 WATER FLOW MAINTENANCE: NUMBER OF
PUBLICATIONS PER YEAR
1, 2000 1, 2010 1, 2012 1, 2014 1, 2016 0 0.2 0.4 0.6 0.8 1 1.2
EROSION CONTROL: NUMBER OF PUBLICATIONS PER YEAR
27
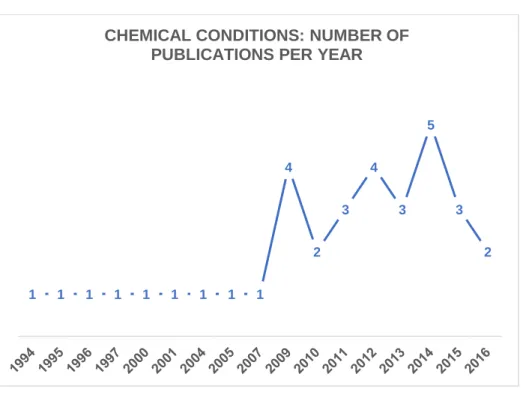
Figure 3-8. The frequency of publications per water services indicator 5
For the indicator 5 the main development of scientific studies was throughout the years of 2007 and 2014; whereas, the period between 2011 and 2015 was rather stable, as well as from 1994 to 2007.
3.2. GRAPHICAL REPRESEN TA TION OF RELEVANT ART ICLES
Presented below Table 3-1 is the classification of “Relevant” publications according to the FORSYS dimensions. This information helps to assess qualifications of the most frequently used forest management planning techniques that address water resources within forest ecosystems. 1 1 1 1 1 1 1 1 1 4 2 3 4 3 5 3 2 CHEMICAL CONDITIONS: NUMBER OF
28 Table 3-1. The list of all selected “Relevant” publications classified according to the FORSYS dimensions
References Country OR technique
Temporal
Scale Spatial Context Spatial Scale Decision maker Objective Goods/Services
Baskent, E. Z., &
Celik, D. A. (2013) Turkey ETÇAP Model Strategic
Non-spatial/
Spatial, with NI Forest level Single Multiple
Market wood products; Non-market services
Baskent, E. Z., &
Keles, S. (2009) Turkey LP Strategic Non-spatial Forest level Single Multiple
Market wood products; Non-market services Baskent, E. Z., & Kucuker, D. M. (2010)
Turkey LP Strategic Non-spatial Forest level Single Multiple
Market wood products; Non-market services Baskent, E. Z., Keles, S., & Kadiogullari, A. I. (2014)
Turkey ETÇAP Model Strategic Non-spatial/
Spatial, with NI Forest level Single Multiple
Market wood products; Non-market services Bettinger, P., Johnson, K. N., & Sessions, J. (1996)
USA Tabu Search Tactical Spatial, with NI Regional level Single Multiple
Market non-wood products; Market & non-market services
Bettinger, P., Johnson, K. N., & Sessions, J. (1998)
USA Tabu Search Tactical Spatial, with NI Regional level Single Multiple
Market wood products; Market & non-market services Bettinger, P.,
Sessions, J., & Johnson, K. N. (1998)
USA Tabu Search Tactical Spatial, with NI Regional level Single Multiple
Market wood & non-wood products; Non-market services
29 Brack, C. L., & Marshall, P. L. (1996) Australia LP/ MIP Tactical Non-spatial/
Spatial, with NI Forest level Single Multiple
Market wood products; Market & non-market services
Eriksson, L. O., Lofgren, S., & Ohman, K. (2011)
Sweden LP Strategic Non-spatial Forest level Single Single Non-market services
Garcia-Prats, A., del Campo, A. D., & Pulido-Velazquez, M. (2016)
Spain NLP (HYDRUS
model) Strategic N/A Forest level Single Multiple
Market wood products; Non-market services
Karahalil, U., Keles, S., Baskent, E. Z., & Kose, S. (2009)
Turkey LP Strategic Non-spatial Regional level Single Multiple
Market wood products; Non-market services
Keles, S., & Baskent,
E. Z. (2011) Turkey ETÇAP Model Strategic
Non-spatial/
Spatial, with NI Forest level Single Multiple
Market wood products; Non-market services Keles, S., & Baskent,
E. Z. (2011a) Turkey ETÇAP Model Strategic
Non-spatial/
Spatial, with NI Forest level Single Multiple Non-market services Keles, S.,
Yolasigmaz, H. A., & Baskent, E. Z. (2007)
Turkey LP Strategic Non-spatial Forest level Single Multiple
Market wood products; Market & non-market services
Kucuker, D. M., &
Baskent, E. Z. (2010) Turkey LP Strategic Non-spatial Forest level Single Multiple
Market wood products; Non-market services
30
Kucuker, D. M., &
Baskent, E. Z. (2015) Turkey LP Strategic Non-spatial Forest level Single Multiple
Market wood products; Non-market services
Loehle, C. (2000) USA SWAP
algorithm Tactical Spatial, without NI Forest level N/A Multiple
Market wood products; Market & non-market services
Naesset, E. (1997) Norway LP Tactical Non-spatial Regional level N/A Single Non-market services
Silva, M., Weintraub, A., Romero, C., & De la Maza, C. (2010)
Chile
Mixed-integer linear
programming
Tactical Spatial, with NI Forest level Single Multiple Market & non-market services
Tecle, A., Duckstein, L., & Korhonen, P. (1994) USA MCDM (PARETO RACE approach)
N/A N/A Regional level N/A Multiple Market & non-market
services
Zengin, H., Asan, U., Destan, S., Unal, M. E., Yesil, A.,
Bettinger, P., & Degermenci, A. S. (2015) Turkey Mixed-integer goal programming
Strategic Spatial, with NI Forest level Single Multiple
Market wood products; Non-market services
31
Only few studies focused on implementation of OR techniques to focus on dynamics of processes of integrating water resources into management planning and harvest scheduling of a forest.
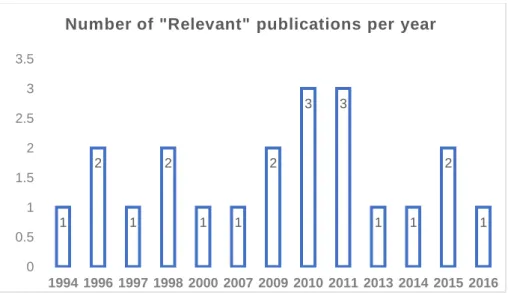
All the studies originating from Turkey, Chile, Spain and Sweden are rather recent; they have been published in the last 20 years, whereas the publications from the USA and Norway are dated before 2000s. This might represent that throughout the phase of the last 20 years, in the field of multiple-use forest management – the LP technique was given preference over the rest, at least by scientists from Turkey. The frequency of publications per year is represented chronologically in Figure 3-9.
Figure 3-9. Frequency of “Relevant” category publications per year
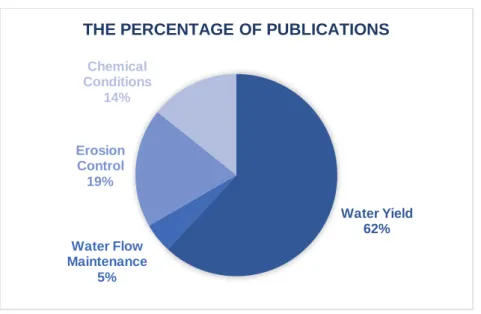
Out of 21 publications that were rated as “Relevant” (4%) – Water Yield indicator has the highest percentage. The outcome might be related to the dominance of publications originating from Turkey. The reason is that water quality value is rather complicated to integrate in a model, due to insufficient data and information, therefore most of the studies concentrate on water production – water yield (Keles & Baskent, 2011). Interestingly, the Erosion Control indicator was addressed solely by publications from the USA; producing solutions to improve aquatic habitat quality by reducing stream sediment level. Figure 3-10. visually represents the output of classification of the “Relevant” publications.
1 2 1 2 1 1 2 3 3 1 1 2 1 0 0.5 1 1.5 2 2.5 3 3.5 1994 1996 1997 1998 2000 2007 2009 2010 2011 2013 2014 2015 2016 Number of "Relevant" publications per year
32
Figure 3-10. The percentage of “Relevant” category publications per water indicator
3.3. CLASSIFICATION OF R ELEVANT PUBLICATION S ACCORDING TO W ATER ECOSYSTEM SERV ICES INDICATORS
The aim of multiple-use-forest-management is to manage ecosystem services in a way that an optimal mix could be generated of forest goods and services. There are several decision support systems that have been employed in assessing the level of integration of water resources, water yield production and water protection throughout this study. Therefore, in the next paragraphs, OR techniques used in the survey are going to be briefly presented, along with the result of survey regarding each technique, as well as their benefits and possible weaknesses in accommodating water value in forest management planning.
3.3.1. PUBLIC ATIONS ASSESSED ACCORDING TO W ATER YIELD INDICATOR
To generate an optimal schedule among management decision alternatives, mathematical optimization technique, such as LP is widely used in forest management field (Keles et al., 2007). It is generally required that all goals within mathematical methods are numerically defined. Whenever, quantitative objectives and units are considered, mathematical programming technique, such as LP, can be helpful to solve a multiple-use forest planning problem (Kangas & Kuusipalo, 1993).
Significant obstacles in multiple-use-forest planning include: (1) determining decision criteria, which is constructed by means of decomposing the original decision problem into a hierarchy according to weights placed on them via estimation of the level of priority; (2) evaluating decision alternatives at each level of hierarchy, identifying, which factor has a greater
Water Yield 62% Water Flow Maintenance 5% Erosion Control 19% Chemical Conditions 14%
33
significance in decision-making with regards to each criterion; (3) using significance of each element at each level to compare them, in order to understand decision-maker’s perception of the criteria and the evaluations of decision alternatives’ importance (Kangas, 1992; Kangas & Kuusipalo, 1993).
Lately, integration of ecosystem services into forest management planning models has become significant in the scope of sustainable forest management, particularly such values as water and carbon. One of the many studies published in Turkey, incorporates three forest values: water, timber and carbon, into forest management planning system, using the LP method. A variety of planning alternatives were presented, with their results being further analyzed. In this study, a solution to approach the LP was to identify a single overriding management objective and express the rest as constraints. Forest management planning scenarios showed diverse results: for instance, protection of forest ecosystems for a long period and an ending forest inventory have a vital role on the amount of carbon sequestration, although have negative effects on water production. Meanwhile, increased production of timber result in higher economic return both in timber and water, yet in less amount of carbon. In case carbon emissions were omitted, the rest of the forest values would act complementarily, and the reason would be an increase in the forest values simultaneous with forest growth (Baskent & Keles, 2009).
Similar study was carried out with six important selected forest values – soil conservation, carbon sequestration, visual quality, timber, water and oxygen production – integrated into a linear programming-based forest management planning model. The quantity and quality, or both, of values provided by forest ecosystems, such as the protection of soils, recreation facilities, regulation of water resources and a variety of timber products – depend on a wide range of forest characteristics: tree species, crown closure of stands, basal area, mean diameter of stand, number of stems, standing timber volume and leaf area index of trees. Generally, quantity and structure of the forest play a vital role in computing the outputs of non-wood forest products and services. Although it is rather complicated to maximize timber production and all other goods and services at the same time. For example, total water production rate decreased by 18% when a soil loss target was incorporated; another factor that influenced decrease of water production rate is the increase of residual basal forest area. Forest management operations, such as harvesting, trigger a change in hydrology of forested watershed, and the reason is that harvesting alters the canopy thickness and saturation, as well as modifies evapotranspiration characteristics (Keles et al, 2007).
34
Alternative study from Turkey by Karahalil et al. (2009) presents the results of integrating forest values, such as soil conservation, water production and timber production with the LP technique. This study explains the LP technique as a powerful tool used to generate an optimal solution and enables to proceed further with a sensitivity analysis. Amongst several strategies developed during the study, the reason behind one strategy to yield a lower NPV when compared to the others – is the soil loss binding constraint, in addition to maximizing water production NPV. Additionally, the period of afforestation of bare lands played an important role, such as: the strategy that yielded a lower NPV was afforested in the first period, whereas the strategy with a higher one, was afforested in the last period.
There are two different case studies that explain how the LP technique was used to analyze the dynamics of a forest under the integration of carbon sequestration, timber and water production, along with other forest management goals, on the same study area. Kucuker and Baskent (2015) concluded that the amount of forest products and services derived from forest ecosystem are dependent upon minimum harvesting age, and forest management activities. They have postulated that water yield from afforested catchments tends to decline when plantation age is increased. Furthermore, they stated that the lowest amount of timber was generated by strategies, which objectives were to maximize the NPV of water. One of the reasons is that model restricts the basal area of forest, by decreasing it. Thus, reforests less amount of forest opening areas in the first periods, which leads to very low NPV of water at the end of planning horizon, and the reason is an adverse effect of reforested areas on water production (Kucuker & Baskent, 2010).
There were some studies carried out In Turkey, that developed and used forest level optimization model – ETÇAP. It is helpful in simulating the development of a forest ecosystem and long-term effects of various management activities on the forest ecosystem, structure and its functions over the long period of time. The model provides area and volume control management policies; therefore, it is possible to target volume or area to be harvested or treated. This is one of the main advantages of implementing ETÇAP model, which usually allows the user to combine forest management planning techniques, such as LP, Simulated Annealing (SA), and other combinatorial optimization or conventional simulation methods. The objective of the study by Garcia-Prats et al. (2016), originating from Spain, was to develop a new hydro-economic modeling framework to assess and design the optimal forest and water integrated management of forested catchments. The model implemented in the study is HYDRUS-1D, it is a software package for simulation of one-dimensional movement of water, heat, and solutes in variably saturated media. The optimization modeling framework explicitly
35
integrates changes in water yield in the catchment (groundwater recharge changes) induced by forest management, and the value of the additional water provided to the system.
3.3.2. PUBLIC ATIONS ASSESSED ACCORDING TO FLOOD PROTEC TION INDICATOR
There were no relevant publications that would address the flood protection indicator.
3.3.3. PUBLIC ATIONS ASSESSED ACCORDING TO W ATER FLOW MAINTENANCE INDICATO R
The Skog (= Forest) Geographical Information System (SGIS) is a strategic planning system that aids the planner in selecting site-specific management schedules that will conform to environmental and recreational standards. The technique was implemented in a Norwegian forest practice by Naesset (1997), in order to provide long-term forest management planning regime, whilst allocating both timber production and environmental goals, in this particular case – the maintenance of a water flow. The SGIS helps the planner to search for individual forest stands or subareas comprising of several stands that should be devoted to restricted timber management practices. Moreover, it simulates a number of treatment schedules for every forest stand and selects the optimal combination of stand treatment schedules for the whole forest by support of LP. Finally, SGIS displays results in maps and tabular forms.
3.3.4. PUBLIC ATIONS ASSESSED ACCORDING TO EROSI ON CONTROL INDICATOR
In spatial forest planning, whenever the problem involves non-linear relationships, or a large-scale problem – many researchers have used specialized Integer Programming (IP) formulations, such as Monte Carlo Integer Programming (MCIP), SA, Genetic Algorithm (GA), and Tabu Search (TS). A meta-heuristic technique TS has been applied a lot in spatial forest planning and was successful in a wide variety of problem areas. In comparison with SA, the technique of TS overcomes local optimality in a more orderly fashion. Instead of relying on a functional probability of accepting non-improvement solutions, the technique continuously forces the process into new regions in terms of solution space. These manipulations are accomplished by means of short-term and long-term memory search strategies. This is the process how better solutions are sought-for in the solution space, while avoiding unproductive cycling (Murray & Church, 1995). The TS technique does not always offer optimal solutions; however, the solutions provided are always good and feasible. This could be explained by the
36
technique remembering its moves, which helps to avoid becoming trapped in local minimum solutions. This is a force to explore other areas of solution space (Bettinger et al., 1997). Bettinger et al. (1998) used the TS technique to present a land-management scheduling model, which ensures the compatibility of aquatic habitat quality, as well as commodity production goals in forest management planning. In this case, TS was helpful to select feasible land-management activities, such as timber harvesting and road system management, considering aquatic habitat goals and an even flow constraint, as represented by temperature indices and stream sediment.
The study that incorporated forest ecosystem values using lexicographic goal programming (LGP) in a Chilean forest dates to 2010. The aim to optimize economic values was expressed by increasing NPV, whereas environmental goals were defined in terms of soil erosion, contamination of water resources, and a visual impact of harvesting criterions. Since the goals of economic and environmental character are conflicting, the LGP model was developed to generate only alternatives, defining: first, an equilibrium among different environmental goals, and giving possibility of achieving a Paretian solution, providing the trade-offs between NPV and environmental protection (Silva et al., 2010).
In the study by Loehle (2000) in order to identify water quality (sediment production) restrictions, SWAP generated flexible buffers where width was determined by both clear-cut size and landscape position variables. The SWAP algorithm is a modification of interchange methods, implemented to be a feasible tool for optimizing natural resource objectives when spatially distributed processes are involved. The strength of the algorithm is that it is able to allocate spatial structures, which control some distributed processes such as stream peak flow or sediment delivery to a stream. The SWAP method is spatial with neighborhood relations, unlike the LP, which is usually non-spatial, i.e. it does not allocate specific spatial structures. The algorithm is not necessarily limited to non-point source pollution problems such as sediment yield; it might be possible to develop various extensions, including landslide risk, biodiversity, distributed hydrology, and wildlife populations. It is worth noting that the SWAP algorithm was the only technique amongst others, to address the watershed catchment/basin scale within a forest, when providing a solution for management planning.
37
3.3.5. PUBLIC ATIONS ASSESSED ACCORDING TO CHEMICAL CONDITIONS INDICATOR
Multiple-use forest planning strives for simultaneous optimization of several incompatible objectives that are conflicting amongst themselves. The multi-objective programming models have been developed as a tool to aid forest planners and decision makers in such environments (Rustagi & Bare, 1987). In the past, the two most widespread models for multi-objective forest management planning have been multi-multi-objective LP and Goal Programming (GP). The main difficulty that arises when using GP is the requirement to determine and fix the weights for each of the objectives. The purpose of the fuzzy set theory is that human objectives are often conflicting, imprecise, and not commensurable. Therefore, instead of applying weights, every goal could be modelled with a desired outcome (target) and minimum allowable outcome (threshold). Maness and Farell (2004) have used GP framework with an approach of fuzzy sets. Thus, rather than having criteria weights, they have approached the problem with targets, threshold, and triggers. With targets being the desired outcome for each goal; thresholds being the minimum acceptable outcome for each goal, and triggers being the management activities that occur because determine the valuation structure of each indicator. This optimization structure is termed by the authors as 3-T approach (Bettinger et al., 1996). As it was mentioned in the section 3.2.4 regarding the publications addressing the erosion control indicator, the study by Silva et al. (2010) also allocated an aim to reduce the contamination of water resources criterion. The attributes of this criterion are expressed in terms of percentage of river length protection and riparian strip type. (Silva et al., 2010). There is another case study from Sweden about quality rather than quantity, unlike the rest of publications mentioned in this survey, it aims to produce an analysis of forestry management operations that limit the amount of chemical substances reaching lakes and streams. The results claim that, in case, where maintenance of water quality is implemented as a constraint, it may have an economic impact on the outcome of forest production. Alteration of the timing and reductions in the extent of final felling – these would be the consequences affecting forest management, in case of a water quality constraint. This is an example of integration of water production in forest management through restriction of levels of nitrogen, phosphorus, methyl mercury and dissolved organic carbon. The results have shown that maintaining or improving water quality to the level stipulated by the EU Water Framework Directive goals may significantly influence economy of forest sector, in case the guideline is implemented as a constraining factor. Mainly, changes would occur in timing and reductions in the extent of final felling (Eriksson et al., 2011).
38 4. DISCUSSIONS AND CONC LUSIONS
During this survey, we came across a large number of reviews and scientific papers relevant to the research aim of evaluating the level of integration of water related resources in forest management planning problem solving. It is worth noting, however, that most of the latter are relevant to hydrological cycles and processes, to soil water content evaluation and assessment, to evapotranspiration and other cycles of water within forests.
Today there is a significant number of publications that explain an application of different techniques to approach forest related problems. For example, Turner et al. (2002) incorporated water yield coefficients into LP model, as did Rowse and Center (1998), who also attempted to emulate spatial concerns with area control methods. Chikumbo et al. (2001) developed a heuristic planning model that utilized water yield coefficients, and Bettinger et al. (1998) directly incorporated a water quality measures into a heuristic. Furthermore, Hajkowicz et al. (2005) used MIP along with water yield coefficients to minimize budget expenditures in an agricultural environment using a raster representation of the landscape. Stand-level analyses of water yield trade-offs have also been explored using nonlinear relationships by Spring et al. (2005), and simplistic assessments of water yield that use rainfall and runoff levels have also been used to assess management scenarios for large areas as it could be seen from Bai et al. (2012). However, robust empirical or physics-based water yield models tend to contain nonlinear functions, as shown in the study of Swallow et al. 1990) and are rarely designed for direct insertion into linear forest planning models; further, most water yield models from around the world have been developed for agricultural and urban uses (Bettinger et al. 2007b).
The survey of the integration of water ecosystem services into forest management planning problem solving models has revealed the techniques most frequently implemented to seek a balanced solution. According to the findings, LP was the technique to predominate in the outcome of this survey, with employment of other techniques, such as GP, TS and others. This means that the group of continuous approaches was given more preference in comparison to discrete approaches. Interestingly, the high number of the LP approach was implemented in studies originated from Turkey, producing timber-oriented management plans that also consider environmental aspects, particularly water production.
Considering that more than half of the selected relevant articles comprised of sustaining a balance between economic and environmental goals, their main objective was for the ecosystem services to correspond to productive aspects. A lot of case studies revealed,