Affiliative structures and social development in preschool children groups
120
0
0
Texto
(2)
(3) I. AFFILIATIVE STRUCTURES STRUCTURES AND SOCIAL DEVELOPMENT DEVELO IN PRESCHOOL CHILDREN CHILDRE GROUPS João Rodrigo Daniel. Tese orientada por Professor Doutor António José dos Santos (ISPA – Instituto Universitário). Tese submetida como requisito parcial para para obtenção do grau de. Doutoramento em Psicologia Área de Especialidade............................Psicologia do Desenvolvimento. 2010.
(4) II. Tese apresentada para cumprimento dos requisitos necessários à obtenção do grau de Doutor em Psicologia na área de especialização Etologia realizada sob a orientação de António José dos Santos, apresentada no ISPA - Instituto Universitário no ano de 2010.. O presente trabalho foi financiado pelo Programa Operacional Ciência e Inovação (POCI 2010) da Fundação para a Ciência e Tecnologia (SFRH/BD/27489/2006).. Agradecimentos.
(5) III. Para a Inês.
(6) IV.
(7) V. Um agradecimento especial ao Professor António José dos Santos e à Professora Manuela Veríssimo cujo apoio tem sido essencial ao longo dos muitos anos de aprendizagem. Este trabalho não seria ainda possível sem ajuda dos restantes membros (presentes e passados) do grupo de investigação em Psicologia de Desenvolvimento da UIPCDE (ISPA – Instituto Universitário). Um muito obrigado à Professora Inês Peceguina por ter acompanhado todo este percurso. Grato ainda ao Professor Brian Vaughn pela troca de ideias em diversas fases deste trabalho..
(8) VI.
(9) VII. Palavras-chave: estruturas afiliativas, relações entre pares, modelos p*, competência social. Key words: affiliative structures, peer relations, p* models, social competence. Categorias de Classificação da tese 2800 Developmental Psychology 2910 Social Structure & Organization.
(10) VIII.
(11) IX. RESUMO O grupo de pares é um dos principais contextos de desenvolvimento da criança durante a idade pré-escolar. Contudo, a maioria dos estudos sobre o desenvolvimento social da criança focam-se na procura de características individuais negligenciando os constrangimentos relacionais inerentes à ecologia do grupo de pares. A abordagem da etologia social, por contraponto, enfatiza a existência de diferentes nichos sociais que influenciam/constrangem o comportamento dos indivíduos, sugerindo que as diferenças individuais devem ser compreendidas à luz das relações diádicas e dos papéis sociais ocupados no interior do grupo de pares. Os trabalhos empíricos aqui apresentados são uma tentativa para estabelecer uma ligação entre estas duas tradições de estudo das relações afiliativas em crianças de idade préescolar. Partindo de uma amostra de 247 crianças Portuguesas, provenientes de 19 salas de aula diferentes, algumas das quais observadas em dois ou três anos consecutivos, foram analisados num primeiro estudo os padrões colectivos de proximidade social. Através da análise hierárquica de clusters da semelhança dos perfis de associação diádicos, em cada uma das salas, foram identificados três tipos de subgrupos afiliativos: (a) subgrupos em que as crianças para além de apresentarem perfis de associação semelhantes partilham, ainda, uma elevada proximidade mútua; (b) subgrupos de crianças com perfis de associação semelhantes, mas que tendem a não passar muito tempo juntas (baixa proximidade mútua); e (c) crianças não agrupadas. Diferenças significativas no viés intra-grupo para medidas comportamentais e sociométricas indicam que os subgrupos identificados não são meros artefactos estatísticos e que os diferentes tipos de subgrupos (elevada proximidade mútua vs. baixa proximidade mútua) são funcionalmente distintos. No segundo estudo, e recorrendo a desenvolvimentos recentes no campo da análise de redes sociais, analisaram-se os processos estruturais que estarão, potencialmente, na origem e desenvolvimento das estruturas afiliativas dos grupos de pares em crianças de idade préescolar. Os resultados deste estudo mostram que as relações afiliativas, nas 19 salas de aula, são altamente recíprocas, estabelecidas preferencialmente entre crianças do mesmo sexo e com a tendência para a criação de tríades transitivas. Estes resultados ajudam a compreender a existência dos subgrupos afiliativos identificados no primeiro estudo. No último estudo investigou-se a relação entre os níveis individuais de competência social e o tipo de subgrupo a que as crianças pertencem. A competência social foi avaliada tendo por base sete indicadores diferentes agrupados em três famílias distintas – motivação social e envolvimento, perfis de atributos comportamentais e psicológicos e aceitação de pares. As crianças pertencentes aos subgrupos mais coesos (elevada proximidade mútua) foram as que apresentaram níveis mais altos de competência social, enquanto as crianças não agrupadas eram geralmente menos competentes que os seus pares. Estes resultados sugerem que a pertença a um subgrupo mais coeso, entre outros factores, pode contribuir para um desenvolvimento social mais ajustado. Em suma, os trabalhos empíricos apresentados adoptam uma abordagem multi-método na tentativa de melhor compreender as estruturas afiliativas dos grupos de pares de crianças em idade pré-escolar, e o modo como estas estruturas se relacionam com o desenvolvimento da competência social..
(12) X. ABSTRACT The peer group is one of the main contexts for the development of preschool children. Nevertheless, most studies on child social development focus on individual characteristics neglecting the relational constraints inherent to peer group ecology. On the other hand, the social ethology approach emphasizes the existence of different social niches that influence/constrain individual behavior, stating that individual differences should be understood in the light of dyadic relationships and the social roles occupied within the peer group. The empirical works here presented are an attempt to establish a bridge between both traditions in the study of preschool children affiliative relationships. With a sample of 247 Portuguese children from 19 different classrooms, some of which were observed in two or three consecutive years, the collective patterns of social proximity were analyzed in the first study. Through the hierarchical cluster analysis of dyadic association similarity profiles, in each classroom, three types of affiliative subgroups were identified: (a) subgroups in which children besides having similar association profiles also share high mutual proximity; (b) children’ subgroups with similar association profiles but that do not tend to spend a lot of time together (low mutual proximity); and (c) ungrouped children. Significant differences found for in-group bias of behavioral and sociometric measures indicate that the identified subgroups are not mere statistical artifacts and that the different types of subgroups (high mutual proximity vs. low mutual proximity) are functional distinct. In the second study, recent developments in the field of social network analysis were used to investigate potential structural processes in the origin and development of affiliative structures in preschool peer groups. The results of this study show that the affiliative relations in the 19 classrooms were highly reciprocal, sex segregated and with a tendency to create transitive triads. These results help to explain the existence of the affiliative subgroups identified in the first study. In the last study the relation between individual levels of social competence and the type of affiliative subgroup to which children belong was assessed. Social competence was evaluated using seven different indicators, grouped into three distinct families – social motivation and engagement, profiles of behavioral and psychological attributes and peer acceptance. Children belonging to more cohesive subgroups (high mutual proximity) were the ones who presented higher levels of social competence, while ungrouped children were generally least competent than their peers. These results suggest that belonging to a more cohesive subgroup, among other factors, can contribute to a better social development. In sum, the empirical works here presented adopt a multi-method approach in an attempt to better understand the affiliative structures of preschool peer groups, and the way these structures relate to social competence development..
(13) XI. Index Chapter I: General Introduction References Chapter II: Affiliative Subgroup Bias in Preschool Peer Groups. 1 8 13. Abstract. 14. Introduction. 15. Method. 19. Results. 24. Discussion. 28. References. 32. Chapter III: Exponential Random Graph Models of Preschool Classrooms. 39. Abstract. 40. Introduction. 41. Method. 46. Results. 53. Discussion. 60. References. 64. Chapter IV: Affiliative Structures and Social Competence in Preschool Children. 71. Abstract. 72. Introduction. 73. Method. 77. Results. 82. Discussion. 84. References. 89. Chapter V: General Discussion References. 95 102.
(14) XII. Tables Index Chapter II: Affiliative Subgroup Bias in Preschool Peer Groups Table 1 – Number of Boys and Girls Present in Each Affiliative Subgroup. 25. Table 2 – Affiliative Subgroups by Age Class. 26. Table 3 – Cross-tabulation of Subgroup Type and Subgroup Sociometric Status Classifications. 26. Table 4 - In-group Bias Multilevel Models. 27. Table 5 - Estimated Means of In-Group Bias According to Subgroup Type. 28. Chapter III: Exponential Random Graph Models of Preschool Classrooms Table 1 – Descriptive Statistics for 3-Year-Olds Affiliative Networks. 54. Table 2 – Descriptive Statistics for 4-Year-Olds Affiliative Networks. 55. Table 3 – Descriptive Statistics for 5-Year-Olds Affiliative Networks. 56. Table 4 – Meta-Analysis of Parameter Estimates. 57. Table 5 – Effects of Group Composition (Regression Coefficients). 59. Chapter IV: Affiliative Structures and Social Competence in Preschool Children Table 1 – Changes in Subgroup Type from 3 to 4 Years of Age and from 4 to 5 Years of Age. 83. Table 2 – Individual Social Competence, Measurement Families and Respective Indicators, According to Subgroup Type. 84.
(15) XIII. Figures Index Chapter II: Affiliative Subgroup Bias in Preschool Peer Groups Figure 1 – Dendogram of a Peer Group. 23. Chapter III: Exponential Random Graph Models of Preschool Classrooms Figure 1 – Structural Configurations. 49.
(16) XIV.
(17) 1. Chapter I General Introduction.
(18) 2. The term ethology refers to the biological study of behavior (Tinbergen, 1963) and its appearance as a modern discipline is associated with the work developed during the 1930s by Nikolaas Tinbergen, Konrad Lorenz and Karl von Frisch, joint winners of the 1973 Nobel Prize in Physiology or Medicine. Nevertheless its origins can be traced back to Darwin’s (1872) The Expression of the Emotions in Man and Animals. Rooted in Darwin’s theory of evolution (Darwin, 1859) earlier ethological studies brought a new approach to already existing problems (studied through the lens of disciplines such as psychology, physiology, ecology, sociology, taxonomy, and evolution), rather than the creation of new research questions (Hinde, 1982). These relations with other disciplines became one of the most important aspects of ethology (Hinde, 1982). When in 1951 Tinbergen provided the first summary of ethological theory in The Study of Instinct, he tended to emphasize questions of proximal causality and behavioral development for documenting and explaining individual differences (Hinde, 1966). Only when social ethology branched from classical ethology, in the 1960’s and 1970’s, the emphasis was moved to the adaptive function of behavior and the evolution of behavioral structures (Crook, 1970a, 1970b; Kummer, 1971). The rise of social ethology, as a distinct branch, occurred as the result of the accumulation of information about non-human primates’ social behavior which influenced the conceptions of individual adaptation and social development. Crook’s socio-ethological view highlighted that individual behavioral variation should be understood in terms of the dyadic relationships and the social roles within the social group because relying solely on global measures of individual activity neglected the fundamental importance of the transitory adjustments individuals experience when moving from one social setting to another. He saw social structure as a group characteristic, a dynamic system expressing the continuing interaction of multiple ecological and social processes, within a certain adaptive range for a given species, rather than a specific attribute of species. Starting from Tinbergen’s four why questions (causation, development/ontogeny, evolution/phylogeny and function/adaptation), Kummer (1971) framed the research program of social ethology by distinguishing five levels or dimensions of behavioral analysis: (a) structural analysis – a description of the organizational conditions of a living system, such as the anatomical underpinnings of a particular behavior pattern or the spatial arrangement of group members; (b) causal analysis – the underlying processes that lead to the appearance of the behavioral structures under study; (c) functional analysis – the emerging processes.
(19) 3. associated with the observed activities that increase the survival value of the living system; (d) ontogeny – the study of organic, social, and ecological processes that shape changes during the course of individual development; and (e) evolution – the long-term processes that determine survivorship and directly shape the genetic heritage on which ontogeny depends. Kummer’s (1971) structural viewpoint reflected the emphasis on the constant dynamic transformation of living systems. Although related to psychology from an early stage, Hinde (1982) considers the highlights of the relationship between ethology and psychology to be Bowlby’s (1969) use of ethological concepts in his attachment theory, and the use of methods drawn from ethology to study young children’s social behavior (Blurton-Jones, 1972; McGrew, 1972). Child social ethology extended theoretical and methodological notions from primatology at a time when observation procedures and behavioral measures in child psychology often lacked the methodological and conceptual rigor of animal ethology (Santos, 1993). Even before the formal creation of social ethology, primatologists had already argued that group social organization involved both cohesive and dispersive mechanisms working together within the group. Nevertheless human social ethology studies, following the direction of research with non-human primates, focused their initial attention on social dominance (Omark, Strayer & Freedman, 1980; Strayer & Strayer, 1976), importing the concepts of dominance and hierarchy from animal studies, especially those on non-human primates. Dyadic dominance describes the relative balance of social power between two members in a social group, while a dominance hierarchy is a higher-order structural principle that summarizes the organization of power relations among all group members. The assessment of social dominance was based upon determining winner and loser roles evident during episodes of social conflict. Most researchers initially accepted social dominance as a primary dimension of peer group social organization and only later a comparable interest in the function of cohesive behaviors emerged. Traditional primatological view of social dominance stressed that primate social activities were influenced by dominance status differences between individuals (Chance, 1967; Chance & Jolly, 1970; Seyfarth, 1977), with dominant individuals being central group members. Like their non-human primate counterparts, dominant toddlers and preschoolers also play an important role in the peer group, being observed, imitated, and liked more by other children (Abramovitch & Grusec, 1978; Hawley & Little, 1999; LaFreniere &.
(20) 4. Charlesworth, 1983; Pellegrini et al., 2007; Strayer & Trudel, 1984; Vaughn & Waters, 1980, 1981). Nevertheless, Vaughn and Waters (1981) soon questioned the social ethology assumption about the role of dominance as a central organizational principle in early peer groups, and argued instead that it was social competence and not social power that attracted peers. These first criticisms lead years later to the substitution of the view of dominance as an agonistic strategy leading to submission for a view that allowed the use of both prosocial and coercive tactics to gain and maintain control over classroom resources (Charlesworth, 1988; Hawley, 1999). This new conceptualization tried to account for, not only, findings that showed that high rates of initiating aggression did not necessarily translate into increased utilization of resources (LaFreniere, 1996; LaFreniere & Charlesworth, 1987), but also for non-ethological literature showing that aggressive behavior can lead to maladaptation in the short and long term, as well as peer rejection (Coie & Dodge, 1983; Dodge, Coie, Pettit & Price, 1990; Newcomb, Bukowski & Pattee, 1993; Pettit, Bakshi, Dodge & Coie, 1990). At the core of this change is the idea that if social dominance is adaptive in terms of evolutionary sense, then it should not be associated with behavior that is maladaptive in the psychological sense (Hawley, 2002). Connecting prosocial and coercive behavior in the service of competition considers both types of behavior as pathways to resource control. This link, however, is not consensual given that affiliation and dominance may have distinct motivational systems, with different evolutionary and ontogenetic histories, rather than being alternative pathways to resource control (Strayer, 1989). This view of dominance also reduces socio-contextual processes to a psychometric calculus of individual differences (Strayer, 1980a) neglecting emergent aspects of group dynamics (Santos & Winegar, 1999). Some critical challenges were also raised by this approach. While dominance hierarchies reflect asymmetries between group members and can be reduced to rank orders, affiliation networks cannot be reduced to a rational rank order (Vaughn & Santos, 2009). This means that while dominant children can be described in terms of individual descriptors that correlate with dominance rank (Hawley, 2002; Vaughn & Santos, 2009), affiliative networks can only be described using group-level descriptors (Vaughn & Santos, 2009). But even reducing dominance structures to a rank order entails the loss of information about who does what to whom (Vaughn & Santos, 2009)..
(21) 5. Clarifying the processes underlying the coordination of dispersive and cohesive activities in children’s play groups served as stimulus to deepen the research on the development of affiliative structures. Representing these structures was the problem that Strayer (1980a, 1980b) tried to tackle when he introduced behavioral sociometry to child ethology, adapting sociometric procedures from sociology (Moreno, 1934). The study of the affiliation had been delayed at that point by a lack of adequate structural models for representing cohesive structures (Santos, 1993). Strayer’s behavioral sociograms summarized preschool groups’ affiliation structures by depicting affiliative links between pairs of group members. These links or behavioral preferences were determined by comparing the relative frequency of initiated affiliative acts to a fixed value (e.g., average initiated acts directed to all classmates). The sociograms provided a visual representation that seemed to indicate that individuals were organized in distinct affilitative subgroups and that the hierarchical models used to represent dominance structures could not be used to represent affiliative structures, because cohesive social structures lacked the asymmetric and transitive social roles characteristic of dominance hierarchies (Santos, 1993). Even though Strayer’s behavioral sociograms provided some insights into group organization, the information they contained proved analytically difficult and did not allow easy quantitative comparisons within or across groups (Vaughn & Santos, 2009). It was only with the introduction of multivariate analytical techniques, borrowed and adapted from the study of school-age children’s social networks (Cairns, Cairns, Neckermann, Gest & Gariépy, 1988; Cairns, Perrins & Cairns, 1985) that the characterization of affiliative structures of preschool children gained a considerable boost. Relying on direct observations of naturally occurring affiliative behavior in preschool classrooms Santos, Strayer, and associates (Santos, 1990, 1993; Santos, Vaughn & Bonnet, 2000; Santos, Vaughn & Bost, 2008; Santos, Vaughn, Strayer & Daniel, 2008; Strayer & Santos, 1996) showed that the use of hierarchical cluster procedures, focusing upon similarity of dyadic association profiles, was a valuable tool for the structural analysis of affiliative structure in preschool peer groups. Their findings indicated that the vast majority of children were members of cohesive subgroups. Later, density-based measures of selective association were employed to provide complementary information on subgroup cohesion. The fact that two children could associate with the same peers (and have a similar association profile) but not necessarily associate with each other lead Santos et al. (2000) to refine the analysis and.
(22) 6. define two types of subgroup categories. One refering to subgroups of children with similar profiles of proximity and significant proximity to each other (high mutual proximity – HMP) and another refering to subgroups of children who do not show significant proximity to each other (low mutual proximity – LMP). Children who were not members of either subgroup type constituted a third social category, referred to as ungrouped. More recently Santos, Vaughn and Bost (2008) provided one of the rare attempts to bridge the two conceptual and methodological traditions within developmental science of peer relationships: child and clinical psychology vs. socio-ethological and sociological traditions. The first focused on the individual child and the effects her or his behavioral character, experiential attributes, and/or relationships may have on her or his own development or on the behavior and opinions of others. The second, focused on the structural features of children’s groups, on the processes underlying structure and/or the affordances and constraints on behavior and character development of such group structures. To accomplish this, Santos et al. (2008) stratified subgroups according to the sociometric acceptance level and analyzed the relations between subgroups sociometric level and the degree of in- vs. out-of-subgroup bias of behavioral and sociometric measures. In a general sense, the core idea underlying the three empirical studies presented in this thesis (and most all other studies referred above) is that the peer group acts has an important context for development in preschool years. The first study extends Santos, Vaughn and Bost (2008) report from a sample of African-American children to a Portuguese sample, using a different statistical approach that allowed testing the influence of subgroup sociometric level on subgroup bias together with the influence of other important variables such as age and subgroup sex composition. The hierarchical clusters procedures used by Strayer, Santos and associates have proven to be a valuable tool for describing preschoolers’ cohesive structures. These procedures can now be complemented with recent developments in social network analysis that permit the elaboration of statistical models that go considerably further than just describing this structures. In the second study, the framework of exponential random graph models (Robins & Pattison, 2005; Robins, Pattison, Kalish & Lusher, 2007; Snijders, Pattison, Robins, Handock & 2006; Wasserman & Robins, 2005) was used to study how the influence of different social processes (reciprocity, transitivity, popularity and sex homophily) might work together on the creation of affiliative structures..
(23) 7. Finally, the third empirical investigation represents a new attempt to bridge social ethology and child psychology traditions in the study of preschool children’s social development. The main purpose was to assess the extent to which the different levels of cohesion in the social units to which children belong (identified with the hierarchical cluster techniques of Strayer and Santos) relate to individual levels of social competence..
(24) 8. References Abramovitch, R., & Grusec, J. (1978). Peer imitation in a natural setting. Child Development, 49, 60-65. Blurton-Jones, N. (1972). Ethological studies of child behaviour. London, England: Cambridge University Press. Bowlby, J. (1969). Attachment and loss. London, England: Hogarth. Darwin, C. (1859). On the origin of species by means of natural selection, or the preservation of favoured races in the struggle for life. New York, NY: Appleton. Darwin, C. (1872). The expression of emotions in man and animals. New York, NY: Appleton. Cairns, R. B., Perrin, J. E., & Cairns, B. D. (1985). Social structure and social cognition in early adolescence: Affiliative patterns. The Journal of Early Adolescence, 5, 339–355. Cairns, R. B., Cairns, B. D., Neckerman, H. H., Gest, S. D., & Gariépy, J-L. (1988). Social networks and aggressive behavior: Peer support or peer rejection? Developmental Psychology, 24, 815-823. Chance, M. R. A. (1967). Attention structure as the basis of primate rank orders. Man, 2, 503518. Chance, M. R. A., & Jolly, C. J. (1970). Social groups of monkeys, apes and man. London, England: Jonathan Cape. Charlesworth, W. R. (1988). Resources and resource acquisition during ontogeny. In K. B. M. Donald (Ed.), Sociobiological perspectives on human development (pp. 24–77). New York, NY: Springer. Coie, J. D., & Dodge, K. A. (1983). Continuities and changes in children's social status: A five-year longitudinal study. Merrill-Palmer Quarterly, 29, 261-282. Crook, J. H. (1970a). Social organization and the environment: Aspects of contemporary social ethology. Animal Behavior, 18, 197-209. Crook, J. H. (1970b). The socio-ecology of primates. In Jonh H. Crook (Ed.), Social behaviour in birds and mammals: Essays on the social ethology of animals and man (pp. 103-166). London, England: Academic Press..
(25) 9. Dodge, K. A., Coie, J. D., Pettit, G. S., & Price, J. M. (1990). Peer status and aggression in boys’ groups: Developmental and contextual analyses. Child Development, 61, 12891309. Hawley, P. H. (1999). The ontogenesis of social dominance: A strategy-based evolutionary perspective. Developmental Review, 19, 97-132. Hawley, P. H. (2002). Social dominance and prosocial and coercive strategies of resource control in preschoolers. International Journal of Behavioral Development, 26, 167176. Hawley, P. H., & Little, T. D. (1999). On winning some and losing some: A social relations approach to social dominance in toddlers. Merril-Palmer Quarterly, 45, 185-214. Hinde, R. A. (1966). Animal behaviour: A synthesis of ethology and comparative psychology. New York, NY: McGraw-Hill. Hinde, R. A. (1982). Ethology, its nature and relations with other sciences. Oxford, England: Oxford University Press. Kummer, H. (1971). Primate societies. Chicago, IL: Aldine-Atherton. LaFreniere, P. J. (1996). Co-operation as a conditional strategy among peers: Influence of social ecology and kin relations. International Journal of Behavioral Development, 19, 39-52. LaFreniere, P. J., & Charlesworth, W. R. (1983). Dominance, affiliation and attention in a preschool group: A nine-month longitudinal study. Ethology and Sociobiology, 4, 1– 14. LaFreniere, P. J., & Charlesworth, W. R. (1987). Effects of friendship and dominance status on preschoolers resource utilization in a cooperative/competitive paradigm. International Journal of Behavioral Development, 10, 345–358. McGrew, W. C. (1972). An ethological study of children’s behavior. London, England: Academic Press. Moreno, J. L. (1934). Who shall survive? Washington, DC: Nervous and Mental Disease Publishing Company..
(26) 10. Newcomb, A. F., Bukowski, W. M., & Pattee, L. (1993). Children’s peer relations: A metaanalytic review of popular, rejected, neglected, controversial, and average sociometric status. Psychological Bulletin, 113, 99-128. Omark, D. R., Strayer, F. F., & Freedman, D. (1980). Dominance relations: An ethological view of human conflict and social interaction. New York, NY: Garland Press. Pellegrini, A. D., Roseth, C. J., Mliner, S., Bohn, C. M., van Ryzin, M., Vance, N., … Tarullo, A. (2007). Social dominance in preschool classrooms. Journal of Comparative Psychology, 121, 54-64. Pettit, G. S., Bakshi, A., Dodge, K. A., & Coie, J. D. (1990). The emergence of social dominance in young boys' play groups: Developmental differences and behavior correlates. Developmental Psychology, 26, 1017-1025. Robins, G. L., & Pattison, P. E. (2005). Interdependencies and social processes: Dependence graphs and generalized dependence structures. In P. Carrington, J. Scott & S. Wasserman (Eds.), Models and methods in social network analysis (pp.192-214). New York, NY: Cambridge University Press. Robins, G., Pattison, P., Kalish, Y., & Lusher, D. (2007). An introduction to exponential random graph (p*) models for social networks. Social Networks, 29, 173-191. Santos, A. J. (1990). Análise descritiva multivariada da estrutura afiliativa de um grupo de crianças em meio pré-escolar (Unpublished thesis). Instituto Superior de Psicologia Aplicada, Lisbon, Portugal. Santos, A. J. (1993). Preschool affiliative networks: A socio-structural analysis of the behavioral ecology of natural peer groups (Unpublished doctoral dissertation). Department of Psychology - University of Québec, Montréal, Canada. Santos, A. J., & Winegar, L. T. (1999). Child social ethology and peer relations: A developmental review of methodology and findings. Acta Ethologica, 2, 1-11. Santos, A. J., Vaughn, B. E., & Bost, K. K. (2008). Specifying social structures in preschool classrooms: Descriptive and functional distinctions between affiliative subgroups. Acta Ethologica, 11, 101-113. Santos, A. J., Vaughn, B. E., & Bonnet, J. (2000). L'influence du réseau affiliatif sur la répartition de l'attention sociale chez l'enfant en groupe préscolaire. Revue des sciences de l’education, 26, 17-34..
(27) 11. Santos, A. J., Vaughn, B. E., Strayer, F. F., & Daniel, J. R. (2008). Métodos de observação e análise para identificação das estruturas afiliativas de grupos de crianças em meio préescolar. Análise Psicológica, 3, 447-461. Seyfarth, R. M. (1977). A model of social grooming among adult female monkeys. Journal of Theoretical Biology, 65, 671-698. Snijders, T. A. B., Pattison, P. E., Robins, G. L., & Handock, M. (2006). New specifications for exponential random graph models. Sociological Methodology, 36, 99-153. Strayer, F. F. (1980a). Social ecology of the preschool peer group. Minnesota Symposia on Child Psychology, 13, 165-196. Strayer, F. F. (1980b). Child ethology and the study of preschool social relations. In H. Foot, T. Chapman & J. Smith (Eds.), Childhood friendships and peer relationships (pp. 235265). London, England: Wiley. Strayer, F. F. (1989). Co-adaptation within the peer group: A psychobiological study of early competence. In B. Schneider, G. Attili, J. Nadel & R. Weisman (Eds.), Social competence in developmental perspective (pp. 145-174). Dordrecht, Netherlands: Kluwer. Strayer, F. F., & Santos, A. J. (1996). Affiliative structures in preschool peer groups. Social Development, 5, 117–130. Strayer, F. F., & Strayer, J. (1976). An ethological analysis of social agonism and dominance relations among preschool children. Child Development, 47, 980–989. Strayer, F. F., & Trudel, M. (1984). Developmental changes in the nature and functions of social dominance during the preschool years. Ethology and Sociobiology, 5, 279–295. Tinbergen, N. (1951). The study of instinct. Oxford, England: Clarendon. Tinbergen, N. (1963). On aims and methods in ethology. Zeitschrift für Tierpsychologie, 20, 410–433. Vaughn, B. E., & Santos, A. J. (2009). Structural descriptions of social transactions among young children: Affiliation and dominance in preschool groups. In K. H. Rubin, W. M. Bukowski & B. Laursen (Eds.), Handbook of peer interactions, relationships, and groups (pp. 195-214). New York, NY: Guilford..
(28) 12. Vaughn, B. E., & Waters, E. (1980). Social organization among preschool peers: Dominance, attention, and sociometric correlates. In D. Omark, F. Strayer & D. Freedman (Eds.), Dominance relations: Ethological perspectives on human conflict (pp. 359-379). New York, NY: Garland Press. Vaughn, B. E., & Waters, E. (1981). Attention structure, sociometric status, and dominance: Interrelations, behavioral correlates, and relationships to social competence. Developmental Psychology, 17, 275-288. Wasserman, S., & Robins, G. L. (2005). An introduction to random graphs, dependence graphs, and p*. In P. Carrington, J. Scott & S. Wasserman (Eds.), Models and methods in social network analysis (pp. 148-161). New York, NY: Cambridge University Press..
(29) 13. Chapter II Affiliative Subgroup Bias in Preschool Peer Groups.
(30) 14. Abstract Ethological studies of preschool group structure highlight concepts of social niches and potential roles associated with occupation of specific niches that offer novel perspectives on behavioral constraints at the individual level. Nineteen Portuguese preschool peer groups (N = 463) were observed to determine physical proximity, visual attention and social interaction to peers, by means of focal sampling. All children completed three picture sociometric tasks. Similarity of association profiles was analyzed for each classroom using a complete linkage hierarchical clustering algorithm. Three subgroup types, high mutual proximity (HMP), low mutual proximity (LMP), and ungrouped children were identified. Significant in-group bias differences were observed for HMP and LMP subgroups using behavioral and friendship measures of social attention and sociometric acceptance data. Ingroup preferences were more marked for HMP subgroups indicating that the two subgroup types are functionally distinct. Results are consistent with previous ethological studies of affiliative structures in preschool classrooms.. Key words: affiliative subgroups, in-group bias, peer relations.
(31) 15. Introduction The study of peer interactions and friendships has demonstrated the weight of the peer group as a context for development across a wide range of ages. Within such peer group relations, friendship relationships are particularly thought to influence several domains of child social adjustment and personal development (Asher, Parker & Walker, 1996; Asher & Renshaw, 1981; Howes, 1983, 1987, 1988; Ladd, 1990; Ladd, Kochenderfer & Coleman, 1996; Newcomb & Bagwell, 1995; Parker & Asher, 1987, 1993; Youniss, 1980; Youniss & Smollar, 1985). Since Cairns’ (1983) seminal review on the distinction between sociometric and psychometric approaches there was a resurgence of interest in the analysis of how affiliative structures in natural peer groups differentially afford or constrain individual early social development. Procedures and multivariate analysis, based either upon structured sociocognitive interviews (Cairns, Perrin & Cairns, 1985) or upon direct observation of naturally occurring behavior (Strayer, 1980a), have been elaborated for identifying affiliative networks within stable peer groups. Children’s groups from early childhood through adolescence can be partitioned into subgroups that share common attributes, although these may vary across subgroups and age levels. Overall, such sociological and socio-ethological oriented research on peer relations claims that membership in particular cliques, social clusters or subgroups both directs and constrains the individual’s contemporaneous and future social behavior (Bagwell, Coie, Terry & Lochman, 2000; Cairns et al., 1985; Cairns, Cairns & Neckerman, 1989; Cairns, Cairns, Neckermann, Gest & Gariépy, 1988; Gest, Farmer, Cairns & Xie, 2003; Gest, GrahamBermann & Hartup, 2001; Hallinan, 1981; Hallinan & Smith, 1989; Santos, 1990, 1993; Santos, Vaughn & Bonnet, 2000; Santos, Vaughn & Bost, 2008; Santos, Vaughn, Strayer & Daniel, 2008; Santos & Winegar, 1999; Strayer, 1980b, 1989; Strayer & Santos, 1996). Nevertheless, most developmental studies of preschool children were initiated from the child and clinical research traditions and thus less attention was given to the structural features and processes occurring in stable groups than to the social exchanges taking place within these structures. Within these traditions, the principal focus is the individual child and the effects that her or his behavior or relationships with others may have on her or his own development or on the behavior and perceptions of peers. A similar trend was present in classical ethology (Hinde, 1966) that was centered upon questions of proximal causality and behavioral development for documenting and explaining individual differences. In contrast, the emergence of social ethology as a second branch of behavioral biology involved a shift of.
(32) 16. interest towards questions about the structure and adaptive function of social behavior (Crook, 1970a, 1970b; Kummer, 1971). Because it focuses on the organization and functioning of groups, social ethology appears more directly related to the fields of social psychology and sociology. Current ethological studies of preschool group structures highlight concepts of social niches and potential roles associated with occupation of specific niches and the way that they offer novel perspectives on behavioral constraints at the individual level (Vaughn & Santos, 2009). The present study examines the relations between an observation-based procedure for identifying preschool affiliative subgroups and both peer interactions and peer verbal nominations. An underlying assumption of this approach is that individual and group based complementary methods of inquiry are necessary for a better understanding of the complexity of relationships within a natural social group. Thus, the primary goal of the study is to integrate the respective contribution of each method in characterizing the affiliative organization in children’s play groups, rather than to endorse a particular approach. The notion that members of a social unit maintain close proximity and develop a semiclosed system of positive communication has a central and long history in the study of primate social ethology (see Kummer, 1971). From classical sociograms (Moreno, 1934) to the far more elaborated subsequent development of social network analysis, such representations of cohesive social structure have been used to describe and discuss the evolution of primate social systems. Most frequently, the algorithms to define a social unit or cohesive subgroup in social network analysis allow subgroup boundaries to overlap, however, such overlapping clusters fail to identify clear inside and outside boundaries that are necessary for understanding positive and negative social preferences and interactions both within and between subgroups. In this sense, the identification of non-human primate and child affiliative structures privileges non-overlapping subgroup identification techniques. For example, Strayer and Santos (1996) examined affiliative behavior matrices of children in 15 preschool classrooms who had been observed over a period of several weeks using hierarchical cluster analyses. Distinct subgroups of children were observed in every classroom and the mean subgroup size and the degree of reciprocity or mutuality of affiliative exchanges tended to increase with age. Furthermore, the proportion of children identified as members of cohesive subgroups increased from about 50% for the youngest children (between 12 and 24 months) to over 90% for the oldest children (60+ months)..
(33) 17. Later, Santos et al. (2000) used nearest neighbor observations and the same clustering procedures for describing the affiliation structure for a single classroom of 4-5 year old children as it evolved over the academic year. They reported that, for the most part, the subgroup structure remained intact across the three waves of data collection even though some group members left the class during the year. Also, children who were ungrouped at the beginning of the year tended to become group members in subsequent waves of data collection. These studies also reported the existence of different subgroup categories, namely children with similar profiles of proximity vis-à-vis other classmates who either showed, or not, significant proximity to each other. These two subgroup types were referred as high mutual proximity (HMP) and lower mutual proximity (LMP) subgroups, respectively. Another common aspect of the study of primate social ethology involves assessing the degree of group social stratification (Crook, 1970a). Any discussion of social status within the group requires specifying operational measures for distinguishing the relative position of individuals and subgroups within the social structure, a concern that is also common among many researchers in social sciences since Moreno's (1934) early concept of sociometric star. Primate field researchers, for example, sought to measure social status by determining functionally equivalent classes of social activity that provide a reliable basis for ranking group members in terms of relative social influence or relative success in agonistic encounters (Altmann, 1962; Richards, 1974). Similar indices have been proposed to assess the degree of social stratification for social power relations in children's peer groups (Barner-Berry, 1980; Savin-Williams, 1979). Other uses of social stratification in child social ethology are found regarding individual differences in affiliative activity, social attention and social control (Abramovitch, 1976; Hold, 1976; Strayer, 1980b, 1989). Measures of status differentials – conceptualized in terms of popularity (Hartup, 1970, 1983; Hartup, Glazer & Charlesworth, 1967), general likability (Asher, Singleton, Tinsley & Hymel, 1979), social impact (Peery, 1979), sociometric classification (Asher & Dodge, 1986; Coie & Dodge, 1983, 1988) and relative centrality of individuals and social subgroups (Cairns et al., 1985; Cairns et al., 1988; Gest et al., 2001) – have also been cornerstones in developmental research on peer group relations and social adjustment. Traditional primatological view of social dominance has also stressed that primate social behavior is influenced by dominance status between individuals (Chance, 1967; Chance & Jolly, 1970; Seyfarth, 1977). Demonstrating that preschool children differentially allocate their social.
(34) 18. behavior and friendship choices towards group co-members as a function of their subgroup status provides more evidence for early structural constraints. When Santos et al. (2000) stratified their subgroups according to the average of their members sociometric acceptance (high, medium, or low levels of acceptance using data from all class peers), within-subgroup bias at the behavioral (i.e., proportion of social attention directed to co-members) and sociometric (i.e., choosing preferred peers within the subgroup) levels were significantly greater for high status subgroups. Santos, Vaughn and Bost (2008) used the same nearest neighbor observations and clustering procedures in a sample of 30 classrooms. Independent chi-square analyses revealed that members of both HMP and LMP subgroups chose co-members as positive attention targets rather than the other classmates at a greater level than chance. A similar but inverse pattern was obtained when the analyses were conducted for negative social attention preferences (i.e., classmates who were targets of attention at significantly less than chance levels). Additional analyses for positive and negative social attention preferences, directly comparing the two types of subgroups, showed they were greater for the HMP than LMP subgroups. After stratifying both subgroup types in terms of sociometric acceptance and repeating the analyses, only children in low acceptance status, LMP subgroups failed to show positive attention preference for co-members. Tests for negative attention preferences revealed an inverse pattern and were also significant at all levels of acceptance status for the HMP subgroup. This negative attention out-group bias was seen also for the high acceptance status, LMP subgroups, but not at medium or lower levels of acceptance. Further comparison of the two subgroup types at each level of acceptance status indicated that in-group preferences were stronger in HMP subgroups at all levels of acceptance status. When the friendship choices were examined, however, only the HMP subgroups showed a significant preference for their own subgroup members. A subsequent test comparing directly the inside and outside choices for the two subgroups types supported this conclusion. Further stratifying the subgroups indicated that friendship preference for co-members was only marked for high status HMP subgroups. Taken together, the results of these studies indicate that classes of preschool children can be subdivided into reliably coherent subgroups that differentially exchange affiliative behaviors, social attention, and friendship preferences. Moreover, the degree to which these exchanges occur is nuanced according to subgroup type and to the social acceptance status level of the subgroup..
(35) 19. In the present study, we assessed affiliative subgroup bias aligned with the ethological and developmental traditions. The proliferation of chi-square analyses that we described (Santos et al., 2008) just considering bias distinctions between stratified subgroup types was avoided. Such approach would prevent us from studying the possible influences of other relevant factors influencing subgroup bias. Besides the obvious extension of previous results from American samples to a Portuguese sample, we further tested the influence of age and subgroup sex composition on subgroup bias, using a multilevel model.. Method Participants The overall sample consisted of 247 different children, 116 of them being followed in two or three consecutive years (N = 463). Participants were recruited from 19 classrooms in two different centers serving middle class families in the region near Lisbon, Portugal. Classrooms ranged in size from 20 to 27 children. A total of 145 3-year-olds (i.e., children < 48 months of age at the start of the academic year, 70 girls, 75 boys), 145 4-year-olds (i.e., children between 48 and 60 months of age at the start of the academic year, 73 girls, 72 boys) and 173 5-year-olds (i.e., children between 60 and 72 months of age at the start of the academic year, 89 girls, 84 boys) were observed and interviewed. Assessments Teams of research assistants independently collected the observation and interview data. Children absent from the classroom for 50% or more of the observational rounds in any classroom were not given rate scores (i.e., treated as missing for these observations). Observations. Using a focal individual sampling design, children were observed for a 15-s interval. At the end of the sampling interval, the child’s nearest peer neighbor was identified. A peer who was within an arm’s reach (roughly 3-4 feet) and engaged in the same or a similar activity as the target child was considered the nearest neighbor of the target. If two or more children were equally close to the focal child (as often happened when children were engaged in table activities or in group time) the peer to the child’s immediate right was considered as nearest neighbor. For instances in which a child was interacting verbally or physically with a peer at the end of the 15-s interval, the interacting partner was considered as.
(36) 20. the nearest neighbor, even though another child might be physically closer. This was most frequent for table activities during which the target might have had a conversation with a peer across the table, rather than with the child immediately adjacent. Observers collecting nearest neighbor information also collected interactions and visual attention data. An observer watched a given child for a 15-s interval and recorded identifiers for all children with whom the target engaged in interaction. Codes for the initiator, receiver and affective valence (positive, neutral, or negative) of the interaction episode were recorded. Interactions were coded as positive if one or both children showed positive affect in the context of the social exchange (i.e., smiling, laughing, gesturing, or vocalization indicating a positive feeling), and no expressions of negative affect (e.g., crying, distress, pain, strong irritability) were displayed by the interactive partner. Interactions were coded as negative if one or both children expressed negative affects (e.g., anger, distress, fear, sadness) in a facial, vocal, or gestural mode, unless these expressions were made in the context of fantasy play. All exchanges not identified as positive or negative were coded as neutral (e.g., exchanges of greetings or conversations during a meal or in the context of a school-related task that did not include the expression of affect, non-verbal exchanges that included physical contact and a reaction to contact). Additionally, observers watched a given target child for a period of 6 s and recorded the identity codes for all children receiving a unit of visual regard from the observation target (no child was credited with receiving more than one unit of visual regard per 6-s. interval although several different children could each receive one unit from a given target in a single interval). No child present in a classroom was observed twice before all other peers were observed once. Children were randomly observed. Rounds of the three types of observational data were interspersed. Two observers collected 200 observation rounds in each classroom for each type of observational data. Observers did not work in pairs and rarely observed a given child simultaneously. The numbers of observation rounds completed by different observers were approximately equal within a given classroom. In each classroom, observers spent approximately 60 min on the first observation day to become familiar with the names of participating children. Research assistants received training in the observation schedule prior to initiating classroom observations. Observations took around three weeks to complete. Rater agreement was estimated as the alpha coefficient for individual rate scores across raters. That is, the.
(37) 21. vector of rate scores from the observations of one observer was treated as a single “item” and the standard internal consistency estimate (Cronbach’s alpha) was calculated. This estimate assesses the representativeness of scores contributed by individual observers, rather than agreement per se for the targets of one child’s behavior. Mean (± SD) reliability estimates were .86 (± .10) for nearest neighbor, .82 (± .14) for social attention, .76 (± .12) for neutral interactions and .63 (± .20) for positive interactions. Sociometric measures. All children completed three picture sociometric tasks: (a) positive and negative nominations; (b) paired comparisons; and (c) rating scale. In each task, judgments were solicited about all classmates (both boys and girls). The assessments took place outside of the classroom in a quiet area. Typically, the nominations task was administered first, followed by the rating-scale task. The paired comparison measure was always administered last. Sociometric interviews took between 30 and 45 min to complete (usually two or three 15-min sessions). If a child’s attention appeared to wander, the interviewer stopped the task and continued the interview at another time. For the nominations task, children were presented with the array of photographs of all classmates and asked to name each one. After successfully naming all classmates, the child was asked to identify a peer that she or he especially liked. The request was repeated two more times and then the child was asked to identify a peer she or he did not especially like (again repeated twice). After making three positive and three negative nominations, the child was asked to return to the array and identify additional children she or he liked. These were turned face down as nominated until the child had made a choice for each class member in the array. In this task, every classmate received a score indicating the order in which she or he was chosen. For the rating-scale task, the child was presented with photographs of classmates in a random order and asked to indicate how much the peer was liked by placing the photo into one of the three buckets. The child was also asked to verbalize his choice. The target child was assigned a score of 3 if he or she was liked a lot and a score of 1 if she or he was not liked very much. For the paired comparisons task all possible pairs (total number of comparisons in a given class = N(N - 1) / 2 were shown to the child being interviewed. The child was asked which of these two children do you especially like?, for each pair. The ordering of pairs was such that all children in a given group were seen once before any child was seen twice and each child’s photograph appeared an equal number of times on the left and right hand sections of the stimulus cards..
(38) 22. Data analysis Affiliative subgroups. The first step in our analyses involved tabulating nearest neighbor observations for each child in a classroom. Children were assigned rows in a dyadic matrix and observed frequencies of proximity with each peer as nearest neighbor were tabulated into columns. This produced an asymmetrical dyadic matrix (where asymmetry implies that the AB cell in the matrix may not be equal to the BA cell). At the next step, the matrix was rotated on its major diagonal and added to itself, resulting in a symmetric dyadic co-occurrence matrix (i.e., AB = BA). The symmetric co-occurrence matrix was used to examine similarity of proximity profiles for each classroom using the complete linkage hierarchical clustering algorithm. Pearson correlations provided frequency independent measures of similarity of association. Hierarchical cluster analysis is a set of techniques for identifying groups of similar objects (or persons) from larger sets of objects when the number of groups is not known a priori. The complete linkage (also called furthest neighbor) algorithm separates clusters on the basis of the largest distance between any pair of objects within clusters. Numerical taxonomists (Legendre & Legendre, 1983; Sneath & Sokal, 1962) have suggested that this algorithm is useful for taxonomy problems because it tends to form tight, spherical clusters of objects/persons. The algorithm suits our needs to identify children with similar profiles of proximity to other classmates but it may over-identify such groups and (as is the case for all clustering methods) the fact that cases can be grouped together does not necessarily prove that those sub-groups (i.e., clusters) have meaning. To provide a check on the integrity of the clusters, we first chose an arbitrary level of within-cluster similarity (i.e., within-cluster correlation coefficient at the conventional level of significance, p < .05) to identify subgroups vs. ungrouped cases. Figure 1 displays a representative cluster dendogram. The vertical line crossing each dendrogram indicates the point at which the within-cluster similarity correlation has a value with p < .05. Second, to identify high vs. low mutual proximity subgroups, the subgroups were split up according to the level of mutual proximity among group co-members. If the probability of proximity frequencies among members was < .001 in a χ2 test, a subgroup was considered to show high mutual proximity. If the probability of proximity frequencies was ≥ .001 for any subgroup member in these tests, the subgroup was considered to be low in mutual proximity..
(39) 23. Figure 1 Dendogram of a Peer Group Note. High mutual proximity (HMP) subgroups are identified in the dendrogram as dark rectangles and low mutual proximity (LMP) subgroups as white rectangles. Ungrouped children are represented as single lines in the dendrogram.. Subgroups were also characterized according to sex composition (all girls, all boys or mixed) and sociometric acceptance status (high, medium, or low). Within classroom total acceptance scores from the paired comparisons sociometric task for each subgroup were aggregated and averaged. The peer acceptance score of each child was calculated as the total number of choices received from peers, in the paired comparisons task, divided by the number of classmates completing the task. These scores were converted to percentile ranks (PR) for each class and subgroups were categorized as having low (PR < 30), medium (30 < PR < 70), or high (PR > 70) acceptance status. Friendship Choices. Following Vaughn et al. (2000), sociometric data were used to identify friendship dyads. To be considered as a friend a peer had to appear among the upper quintile on either the nominations or the paired comparisons sociometric tasks and had to receive a rating of 3 on the rating scale task..
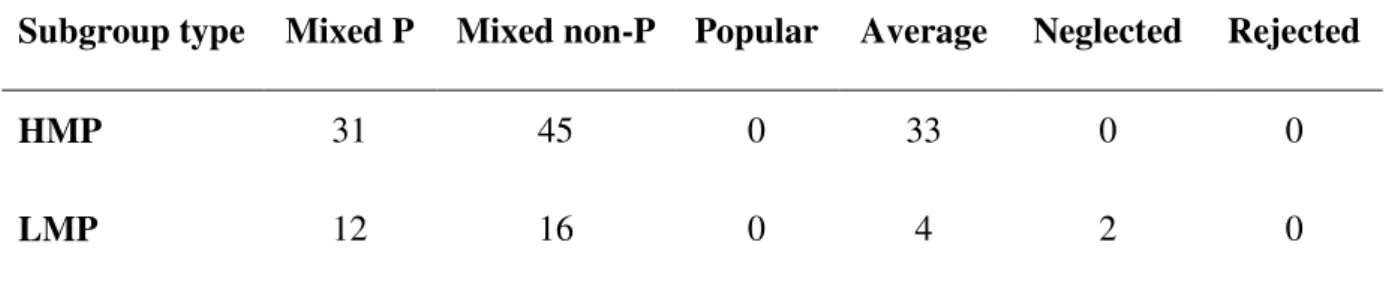
(40) 24. Sociometric status. Nominations sociometric data were used to derive status category classifications (following the procedures described by Asher & Dodge, 1986) for popular, neglected, and rejected children (all others were classed as average). Subgroups were pure if all members of the subgroup had the same sociometric status, mixed-P if at least one child in the subgroup was classified as popular and mixed not-P if no child in the subgroup was classified as popular. In-group bias. For each member of a multi-child subgroup, the mean proportion of social attention, positive and neutral interactions, and friendships choices given to group members were used as measures of in-group bias. Because the outcome variables are proportions we used generalized linear mixed models (with a logit link and a binomial error distribution) to understand which variables affect in-group bias. These variables were related to children’ age and subgroup characteristics (type of subgroup, sex composition, status and subgroup size). Given that some of the children had repeated measures, two level-models were created with the repeated measures at the lowest level and the individual children at the highest level. Multilevel modeling does not require the same number of measurements for all individuals in order to obtain efficient estimates (Hox, 2002). This procedure allowed us to use the full sample (N = 463). In some longitudinal studies it is common to encounter small numbers of observations for each individual (large J, small N designs), but despite this, multilevel models are still very effective in detecting fixed effects of model predictors (de Leeuw & Meijer, 2008).. Results Aggregating across the 19 classrooms, a total of 145 multi-child subgroups were identified and 37 children were ungrouped. 109 subgroups were classified as HMP (75.17 %), and 36 were classified as LMP (24.83 %). High mutual proximity subgroups were observed in every classroom, LMP subgroups were found in 14 of 19 classrooms and ungrouped children were present in 16 classrooms. No classroom contained subgroups of only one type. Approximately 74 % of identified multi-child subgroups were of the same sex (107 / 145)..
(41) 25. Table 1 Number of Boys and Girls Present in Each Affiliative Subgroup Girls. Boys. Total. (n = 229). (n = 226). (N = 455). HMP (n = 325). 153. 172. 325. LMP (n = 93). 53. 40. 93. Ungrouped (n = 37). 23. 14. 37. Affiliative roles. Table 1 shows the distribution of boys and girls according to subgroup type. Boys and girls were equally represented in each subgroup type, although a non-significant trend was found, N = 455, χ2(2) = 5.10, p = .08. Boys were slightly more likely to be present in HMP subgroups, while girls were somewhat more common in LMP subgroups and as ungrouped children. Cross-tabulation analyses further indicated that the proportion of children belonging to each subgroup type varied as a function of age, N = 455, χ2(4) = 11.58, p = .02 (Table 2). Children in HMP subgroups were more common among 5-year-olds. Subgroup sex composition, N = 145, χ2(2) = 1.21, p = .55, and subgroup stratification, N = 145, χ2(2) = 2.14, p = .34, were independent of subgroup type. The cross-tabulation of subgroup type by sociometric status is presented in Table 3. Around 73 % of the subgroups included children with different sociometric status. None of HMP or LMP subgroups were made of exclusively popular or rejected children. Almost all (37 / 39) of the pure status subgroups were of average children. Subgroup size ranged from 2 to 6 across classrooms. Approximately 43 % (Total = 62 / 145, HMP = 44 / 109, LMP = 18 / 36) of the multi-child subgroups were dyads and these dyads accounted for near 30 % of grouped children. Only 10 HMP subgroups had more than four children and only one HMP subgroup was composed of six children. ANOVA on subgroup size using age, subgroup type, sex composition of subgroup and subgroup stratification as independent factors, revealed a near-significant trend for subgroup type, F(1, 135) = 2.90, p = .09 (M ± SD: HMP = 2.96 ± 1.00, LMP = 2.58 ± .65)..
(42) 26. Table 2 Affiliative Subgroups by Age Class Subgroup type HMP. LMP. Ungrouped. (n = 325). (n = 93). (n = 37). 3 (n = 142). 91. 39. 12. 4 (n = 143). 98. 31. 14. 5 (n = 170). 136. 23. 11. Age. Table 3 Cross-tabulation of Subgroup Type and Subgroup Sociometric Status Classifications Subgroup type. Mixed P. Mixed non-P. Popular. Average. Neglected. Rejected. HMP. 31. 45. 0. 33. 0. 0. LMP. 12. 16. 0. 4. 2. 0. Note. Subgroups were classified has mixed-P if at least one child in the subgroup was popular and mixed not-P if no child in the subgroup was popular. Remaining categories include children with the same sociometric status. Individual sociometric status: 282 average, 52 popular, 54 rejected, 56 neglected.. Table 4 summarizes parameter estimates for the multilevel models of the in-group bias variables. Subgroup type (HMP or LMP) had a significant effect on all dependent variables studied (i.e., in-group proportions). High mutual proximity subgroup members tend to direct more positive social attention, more neutral and positive interactions, and more sociometric friendship choices to their co-members than children in LMP subgroups (Table 5). Subgroup status only had a significant effect for friendship choices (a trend was also found for social attention). In-group bias for friendship sociometric choices decreased with.
(43) 27. subgroup status (high vs. medium vs. low status model estimate means ± SE: .20 ± .03, .16 ± .02, .12 ± .02; pairwise comparisons – high vs. medium: p = .13; high vs. low: p < .01; medium vs. low: p = .03).. Table 4 In-group Bias Multilevel Models F statistic Social. Neutral. Positive. Friendship. attention. interactions. interactions. choices. (df2 = 330). (df2 = 244). (df2 = 281). (df2 = 319). Subgroup type (df1 = 1). 288.56**. 240.89**. 97.00**. 16.46**. Subgroup stratification (df1 = 2). 2.79+. .03. 2.53. 5.12**. Age (df1 = 2). 25.87**. 33.05**. 34.19**. .07. Subgroup sex (df1 = 2). 3.93*. 9.10**. 1.42. .52. Subgroup size (df1 = 1). 361.23**. 133.75**. 229.77**. 53.76**. Model. Note. + p < .10, * p < .05, ** p < .01.. Age also influenced in-group bias for observational measures (3- vs. 4- vs. 5-year-olds model estimate means ± SE – social attention: .20 ± .01 vs. .15 ± .01 vs. .16 ± .01; neutral interactions: .25 ± .02 vs. .15 ± .01 vs. .17 ± .01; positive interactions: .33 ± .04 vs. .14 ± .02 vs. .14 ± .02). Pairwise comparisons distinguished 3-year-olds from the two other age class groups in all the three in-group bias variables (p < .01). Subgroup sex composition had a significant influence on the distribution of social attention and neutral interactions (mixed vs. girls vs. boys model estimate means ± SE – social attention: .15 ± .01, .18 ± .01, .16 ± .01; neutral interactions: .15 ± .01, .20 ± .02, .21 ± .02). Pairwise comparisons distinguished mixed subgroups from sex segregate subgroups (p < .01) for both variables and girls subgroups from boys subgroups for social attention (p = .04)..
(44) 28. Table 5 Estimated Means of In-Group Bias According to Subgroup Type Subgroup type. Social. Neutral. Positive. Friendship. attention. interactions. interactions. choices. HMP. .27 (.01). .35 (.02). .39 (.02). .23 (.02). LMP. .10 (.01). .09 (.01). .08 (.02). .10 (.02). Note. Standard errors are in parentheses.. Discussion The. need. to. simultaneously. consider. the. developmental,. and. the. sociological/ethological approaches in the study of preschool peer groups’ affiliative structures was stressed in the first part of the introduction. The results obtained in this study consolidate that rare bridge between the two traditions, by extending previous findings of Santos, Strayer and associates. Also, because Portuguese samples are underrepresented in research with young children from any tradition in social development, our study is a major contribution in the characterization of this population. Two specific issues were chosen to guide the present research: (a) identification and stratification of preschool affiliative structures; and (b) analyzing affiliative subgroup bias. Globally, the results found suggest that the clustering approach to preschool classroom social structures used by Strayer, Santos and associates is a useful procedure. Concerning the first issue, the three subgroup types (HMP, LMP and ungrouped children) were identified in the vast majority of classes. At least two subgroup types were present in every classroom. Both sexes were approximately equally represented in each of the subgroup types (boys were slightly more likely to be present in HMP subgroups), with the majority of the subgroups being sex segregated. High mutual proximity subgroups were more frequent in older children classrooms. This finding agrees with the idea that with age, the.
(45) 29. increasing coordination of children’ association profiles generates more cohesive affiliative structures within the peer group (Strayer & Santos, 1996). Results of in-group bias analyses showed that HMP membership was clearly associated with higher in-group social preference. This result provides an important validation of the socio-structural analysis by demonstrating the necessary connection between affiliative networks and positive social communication (Kummer, 1971). In addition, it is consistent with the assumption that membership within cohesive subgroups may provide important occasions for the development and maintenance of interpersonal relationships. Regarding children belonging to LMP subgroups, findings show patterns of in-group bias, which conform to expectations regarding their similar but less selective association. Finding somewhat different patterns of in-group attraction across subgroups suggests that the subgroup types are functionally distinct in these preschool classrooms. High mutual proximity subgroups are more likely to be made up of friends, whereas LMP subgroups are composed of children who do not necessarily share friendship relations. These differences suggest dissimilar degrees of cohesion across subgroup types which could indicate that LMP subgroups are less stable over time. Else, it may be that LMP subgroups are precursors to or even the early stages of HMP groups. Longitudinal data will be needed to test these hypotheses. Overall, findings also indicate that although homophilies may bring subgroups together, it is the affect experienced between co-members that determine whether the subgroup becomes a high or low mutual proximity type. Such affective exchange and the balance of positive vs. negative affects may also contribute to subgroup changes through time. Given the fact that HMP co-members are more likely to be friends, an important avenue for future research is to study the potentially different cycles of conflict and reconciliation with co-members versus other classmates. The introduction of status differentials in the analysis of in-group bias revealed that the salience of co-members as targets of sociometric choices was stronger for members of high and medium status subgroups. For members of higher status subgroups a double process of propinquity/familiarity and attraction to high social acceptance may potentiate in-group sociometric attraction. Subgroup stratification did not significantly influenced in-group bias for social attention or interaction measures (although a small trend was found for social attention). These results, together with fact that the majority of subgroups included children with different sociometric status indicate that the interactive choices of children are not.
(46) 30. necessarily based on a global assessment of peer likability. It was not the case that the popular children in a classroom only associated with each other. Stronger in-group bias in 3-year-olds for observational measures can be a result of younger children interacting with a smaller range of their peers. As children grow older they start moving away from playing alone to more interactive types of play (Coplan & Arbeau, 2009; Ladd, 2005; Rubin, Bukowski & Parker, 2006). Children’s acquisition of social, cognitive, and communication abilities lies behind these changes (Howes, 2009). The fact that children tend to increase their frequency of social attention and interactions as they grow older (Peceguina, 2010; Shin et al., in press) provides some support for this idea. From a developmental point of view, an important question concerns whether patterns of association depend upon conscious categorization and social comparison with other members in the peer group. This question seems especially pertinent given the considerable degree of sexual segregation in the obtained affiliative subgroups and the fact that in two of the observational in-group bias variables studied mixed subgroups scored significantly lower than same sex subgroups. That preschool children tend to play with same-sex peers has been documented in the developmental literature since the 1930's (Parten, 1932). However rather than endorsing a cognitive or socio-cognitive model to explain this effect, the majority of past and current. research propose complementarity or synchrony in the interactive styles. (LaFreniere, Strayer & Gauthier, 1984; Jacklin & Maccoby, 1978; Legault & Strayer, 1993; Martin & Fabes, 2001). From this perspective, children associate in same-sex subgroups because of similarities in behavioral repertoires and styles of social participation. Another important aspect concerns the current conceptual shift in behavioral biology that inspired research on the functional aspects of dominance for children at the expense of its socio-structural aspects (see Vaughn & Santos, 2009 for a review). Although dominance hierarchies are conceptualized in social ethology as group level structures with functional consequences for the group, these consequences are no longer central topics in current sociobiological/evolutionary psychology research. This loss of diversity in research topics is lamentable because it breaks up historically important ties with concerns of primatologists and sociologists who have studied social influence at the group and subgroup levels. In future studies, it would be useful to collect both dominance and affiliation data to verify whether dominance status also contributes to preschool subgroup formation, for example if children with similar rank positions in the dominance structure seek out each other.
(47) 31. as affiliative partners and, if so, whether social dominance also predicts aspects of affiliative subgroup bias. Overall, the results of in-group bias, do not contradict the contention that peer group affiliative structure constrains individual social attention and acceptance. Given their greater subgroup cohesion, HMP members may play a more salient role in the social adjustment of their co-members. However, the present findings do not permit concluding that some affiliative subgroups have special socializing functions for subgroup members. Independent measures of social influence are necessary to support this claim. Finally, we would also prefer to have classrooms observed longitudinally over the school school year to understand how HMP and LMP subgroup types emerge, their degree of stability or fluidity across time, and how these subgroups influence both individual and group level aspects of social participation..
Imagem
Documentos relacionados
Table 3 Spearman Correlations Between Moderate to Vigorous Physical Activity and Gross Motor Competence (Balance and Ball Skills), Perceived Motor Competence, and Sedentary
In chapter 2, ‘Involvement in Brazilian jiu-jitsu: motivation, social identity and social connections on the mat’, we examined how the structure of peer interactions
In the second study, we sought to understand to what extent children's characteristics associated with a higher risk of social exclusion and context
SOCIAL INCLUSION AND WELLBEING OF FAMILIES OF CHILDREN WITH SPECIAL NEEDS TRANSNATIONAL STUDY REPORT
Having a child SN requires more effort and involvement from parents (i.e. long term psychological therapies, medical treatments). The stress faced by families raising
The results showed that SP (sponsored posts) had behavioral impact on brand awareness, online purchase intention, and social media engagement, yet were subject to the sample
The families also reported several social programs and initiatives in which the studied children participated: Chil- dren’s Milk Program, Family Grant Program [Bolsa Família],
Moreover, we can observe a different relationship between different aspects of Emotional Intelligence and Social competence, as if in regular children (positive correlation)
More concretely, the results included in this thesis conclude that authentic leadership and psychological safety are positively related with social networks, more
