Cross-border cooperation in inner Scandinavia: A territorial
impact assessment
Eduardo Medeiros
aCentro de Estudos Geográficos (CEG), Institute of Geography and Spatial Planning (IGOT), Edifício do IGOT - Rua Branca Edmée Marques, 1600-276 Lisboa, Portugal bUniversidade de Lisboa, Portugal
a b s t r a c t
a r t i c l e i n f o
Article history: Received 7 July 2016
Received in revised form 15 September 2016 Accepted 15 September 2016
Available online 22 September 2016
The use of territorial impact assessment procedures is gaining increasing relevance in the European Union policy evaluation processes. However, no concrete territorial impact assessment tools have been applied to evaluating EU cross-border programmes. In this light, this article provides a pioneering analysis on how to make use of ter-ritorial impact assessment procedures on cross-border programmes. More specifically, it assesses the main terri-torial impacts of the Inner Scandinavian INTERREG-A sub-programme, in the last 20 years (1996–2016). It focuses on its impacts on reducing the barrier effect, in all its main dimensions, posed by the presence of the administra-tive border. The results indicate a quite posiadministra-tive impact of the analysed cross-border cooperation programme, in reducing the barrier effect in all its main dimensions. The obtained potential impact values for each analysed di-mension indicate, however, that the‘economy-technology’ dimension was particularly favoured, following its strategic intervention focus in stimulating the economic activity and the attractiveness of the border area.
© 2016 Elsevier Inc. All rights reserved.
Keywords:
Territorial impact assessment Cross-border cooperation Inner Scandinavia INTERREG EU Cohesion Policy Barrier effects
1. Introduction and methodology
The main goal of this paper is to assess the main territorial impacts of the Swedish-Norwegian (S-N) Inner Scandinavian (INS) INTERREG-A sub-programme (INS INTERREG), since itsfirst implementation phase (INTERREG II-A 1996–1999), until the present moment (2016), includ-ing data and analysis from the early stages of the present phase (INTERREG V-A 2014–2020).
Conceptually, this research builds on two European Union (EU) Co-hesion Policy mainstream processes: the cross-border cooperation (CBC) and the territorial impact assessment (TIA). The CBC has been for-mally in the making since the mid-1900s, namely in the north-west of Europe (Benelux, Germany, and France), and in the European Nordic Countries (Norway, Sweden, Denmark, and Finland). The CBC saw a rapid rise in the EU since thefirst INTERREG-A Community Initiative was implemented, in 1989, not only in these regions, but gradually into the remaining EU border regions (south and east), due to the avail-ability of specific European funding for border regions (Huggins, 2013). Indeed, this exponential rise of the CBC process in the EU can be seen by the growing number of CBC structures (Perkmann, 2003), such as the Euroregions and Working Communities (Medeiros, 2011, 2013a), the European Groupings of Territorial Cooperation (EGTC) (Estelle, 2016; CoR, 2016). Moreover, the INTERREG-A, initially launched as the cross-border strand of the INTERREG Community Initiative, was‘upgraded’
into one of the main EU Cohesion Policy goals (European Territorial Co-operation), in the 2007–2014 programming period, as a demonstration of the crucial role of EU border regions which cover about 60% of the EU territory and 40% of its inhabitants - NUTS3.
In short, Europe is a patchwork of small, medium, and large-sized states, forged by historical events (AEBR, 2008). For its part, the EU is a unique economic and political partnership between 28 member-states (Rodríguez-Pose, 2002). As such, the need to promote territorial cooper-ation, understood as the“process of collaboration between different ter-ritories or spatial locations” (Medeiros, 2015: 100), is an inherent and essential part of the EU policymaking process. Again, the CBC process can be regarded as a pivotal type of territorial cooperation for the EU. In-deed, for a long time, many European border regions have lived‘back to back’ (EC, 1990). This resulted in a combine negative effect in loss of eco-nomic competitiveness, in reduced efficiency (in making use of public services), and in increased obstacles of all sorts for the citizen's lives.
Curiously, from the onset, the CBC process was regarded by the EU institutions as a tool to instil cooperation between neighbouring admin-istrative authorities adjacent to an internal or external frontier of the EU (Cranfield and Luccese, 1996), and to compensate for the introduction of the Single Market, as well as the negative effects expected from the abolition of economic borders (EC, 2015). Also important was the recog-nition of the existence of different levels of CBC in Europe, with old and mature CBC processes (Nordic and Western European countries) living hand in hand with more recent forms of CBC (South and Eastern Eu-rope). And even now, the official EU narrative on the main goals of the INTERREG-A (CBC) is that it aims at“tacking common challenges
E-mail address:[email protected].
http://dx.doi.org/10.1016/j.eiar.2016.09.003
0195-9255/© 2016 Elsevier Inc. All rights reserved.
Contents lists available atScienceDirect
Environmental Impact Assessment Review
j o u r n a l h o m e p a g e :w w w . e l s e v i e r . c o m / l o c a t e / e i a ridentified jointly in the border regions and to exploit the untapped growth potential in border areas, while enhancing the cooperation pro-cess for the purposes of the overall harmonious development of the Union”.i
As a matter of fact, for the most part, the INTERREG-A programmes' intervention strategies tend to follow the EU current strategic develop-ment paradigms such as EUROPE 2020 for smart, sustainable, and inclu-sive growth (EC, 2010). There already are, however, ongoing local, regional, and national development instruments which are used by bor-der areas. As such, in our view, the CBC process should be seen as a spe-cific process which mainly aims at reducing the barrier effect in its economic/technological, social/cultural, environmental/heritage, acces-sibilities, and institutional/legal dimensions (seeMedeiros, 2010a, 2015), provoked by the presence of a borderline between two countries. From a conceptual point of view, a barrier can be defined as a “par-ticular type of obstacle which restricts or impedes the smooth transfer or free movement of a person or commodity from one place to another” (Nijkamp and Batten, 1990: 233). Understandably, barriers can have different intensities and types of effects on the movement and diffusion of tangible and intangible elements (seeNijkamp et al., 1990; Abler et al., 1972; Hägerstrand, 1967). From a logical point of view, the stronger the barrier, the higher is barrier effect to a certain movement or diffu-sion process. Following this rationale, and on our own previous studies on border areas, we identified five main dimensions of barrier effect to assess the impacts of CBC Programmes: Cultural/Social, Institutional/ Legal, Economy/Technology, Environmental/Heritage, Accessibility (seeMedeiros, 2014b).
Based on this conceptual framework, our analysis adapted an existing territorial impact assessment (TIA) tool called TARGET_TIA to specifically evaluate CBC programmes (seeMedeiros, 2015). Generical-ly, a TIA can be understood an evaluation procedure which takes into consideration the main impacts of projects/programmes/policies in all the dimensions, and respective components, of territorial development or territorial cohesion (seeMedeiros, 2013b, 2014a, 2016a; EC, 2009). Nevertheless, this procedure can be adjusted to specific sectoral poli-cies/programmes as long as they have a clear territorial dimension. This is the case of CBC programmes (INTERREG), because they have an impact on a wide spectrum of territorial development dimensions (eco-nomic competitiveness, social cohesion, territorial articulation, environ-mental sustainability, and territorial governance), and cover significant portions of the EU territory.
Curiously, the INTERREG-IIIfinal evaluation report recognizes that “over recent years, more attention has been paid in the academic litera-ture to the role and impact of territorial cooperation programmes. How-ever, there is to date no comprehensive analysis of the impacts of different forms of territorial cooperation on social, economic or territo-rial cohesion across the EU” (Panteia, 2009: 34) which, according to this report, is mainly due to the variety of types of EU cross-border regions. Even so, in large measure, this evaluation reveals a broad focus on the notion of the added value of EU CBC programmes, namely on learning processes and policy transfer, and in understanding differences in insti-tutional/administrative/regulatory frameworks.
Methodologically speaking, a wide variety of data sources was used and further complemented by a specific input from the programme managers, in a combined number of methods. Hence, this evaluation re-port did not use a tailor-made methodology to assess the main impacts of EU CBC programmes, as we propose in this article. Interestingly, at the present moment (2016), however, the EC isfinancing a more focused evaluation report on‘collecting solid evidence to assess the needs to be addressed by INTERREG cross-border cooperation programmes’, based on the analysis offive main dimensions and related components: economic cohesion, environmental sustainability, social cohesion, terri-torial articulation, and governance.
From a methodological standpoint, in this article, we made use of the TARGET_TIA tool to produce the potential impacts values of the INS INTERREG investments, in all the analysed dimensions of the barrier ef-fect concept, and an overall potential impact value. In a nutshell, this tool is an easy to use, yet relevant, multidimensional,flexible, and multivectoral TIA technique which, based on the qualitative and quanti-tative inputs, produces a potential impact value (−4 to +4) of projects/ programmes/policies, either for the ex-ante or ex-post phases or project implementation.
It is easy to use as it basically requires the insertion of the potential impact values in a spreadsheet, which already contains the formula to calculate thefinal policy impacts in each analysed dimension, as well as thefinal average impact of the evaluated intervention. It is relevant be-cause the selection of the adequate impact value is based on a deep anal-ysis of available qualitative (bibliography, interviews, project analanal-ysis) and quantitative (statistical analysis) data, which can shed light on the direct and indirect impacts of the evaluated project/programme/policy.
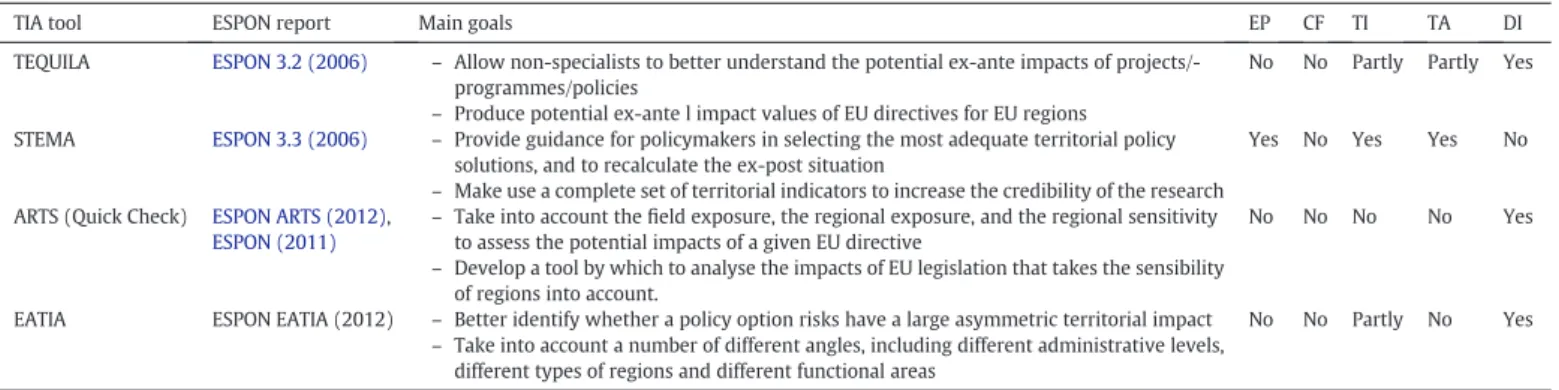
It is multidimensional because it not only makes use of common eco-nomic and social elements of evaluation, but it also includes compo-nents related to other pivotal territorial analytic dimensions, such as environmental, governance, and spatial planning. It also isflexible be-cause it can be adapted to specific projects/programmes/policies, such as CBC programmes, transport policies, urban policies, and many others. Finally, it is multivectoral, because it makes use of several vectors of counterfactual evaluation, such as the identification of short-term/sus-tainable impacts, substitution/multiplier impacts, and exogenous/endog-enous impacts. It can be used to assess the potential impacts of a project/ programme/policy before it is implemented, by making use of qualitative elements (see the formula inFig. 1). It also can be used to assess the main territorial impacts of a given project/programme/policy after it is imple-mented (ex-post). For this, an average of three years of data is required. There are several reasons for selecting TARGET_TIA over existing ESPON TIA tools when evaluating CBC programmes. Firstly, the large ma-jority of these tools (TEQUILA, EATIA, and Quick Check TIA) were de-signed for ex-ante assessment of the potential impacts of EU initiatives, through the European Commission's Impact Assessment procedure (EC, 2009; EC, 2013; Fischer et al., 2015). Indeed, they were especially focused in assessing potential ex-ante impacts of EU directives (seeGolobic et al., 2015) in a simple and quick way. Generically, they are supposed to be im-plemented not only by experts on policy evaluation, but also by any of fi-cial, in a way to make it possible for EU Directorate General Units to use them when needed. Instead, our goal is primarily centred in obtaining ex-post potential impacts. Also, as any policy impact evaluator would argue, assessing impacts of policies requires time and resources to pro-duce sound and relevant potential impact values. And this is particularly true when it comes to assessing territorial impacts, as they encompass several analytic dimensions (seeMedeiros, 2014a).
Secondly, and unlike the existing ESPON TIA Tools (Table 1), TARGET_TIA allows for the use of counter factual policy evaluation ele-ments which are essential to obtain a more precisefictional impact of the evaluated programme/policy (EC, 1999). In this sense, the selected TIA tool not only uses the typical positive-negative impact analytic vec-tor which characterizes all the ESPON TIA techniques, but complements it with some other fundamental analytic counter factual evaluation vec-tors, as previously explained.
For this specific analysis we made use of a vast array of both qualita-tive and quantitaqualita-tive information. More particularly, a project database was prepared by the INS secretariat which made it possible to associate each approved INS INTERREG project to each regional province (NUTE3), type of partner; barrier effect dimension, and the project andfinancial distribution for each phase and respective intervention axes. Moreover, interviews with several experienced regional politi-cians (members or former member of the sub-programme Steering Committee - see Annexes), and programme secretariat officials provid-ed crucial insights to better understand the INS INERREG. A wide array of literature focusing on the evaluation of this sub-programme
i
http://ec.europa.eu/regional_policy/pt/policy/cooperation/european-territorial/ cross-border/.
complemented this qualitative data. Beyond this, statistical data, cover-ing all the analysed‘barrier effect’ dimensions were collected and treat-ed in order to verify its trends in the last 20 years, in the INS.
In sum, this paper aims to answer the following research questions: – What were the main territorial impacts of the INS INTERREG during the last 20 years, in reducing the barrier effect in all its dimensions? – Which barrier effect dimension was reduced more effectively by the
operationalization of the INS INTERREG?
This paper it is organized into four main topics and a conclusion. First, a synthetic overview of the territorial development and territorial cooper-ation panorama in INS before the INTERREG sub-programme was
implemented is set out, to better understand its ex-post impacts. The fol-lowing topic provides a detailed analysis of the operationalization of this sub-programme in its four phases (INTERREG II 1996–1999; INTERREG III 2000–2006; INTERREG IV 2007–2013; and INTERREG V 2014–May 2016). The identification of the main territorial impacts of the INS INTERREG then is examined, by making use of the proposed TIA methodology. The final section presents a more detailed analysis of the main impacts of this sub-programme on each barrier effect dimension.
2. Inner Scandinavia territorial cooperation and development base-line scenario
By the time Sweden became an EU member state in 1995, it already was one of the most developed countries in Europe and the world. The
same was true with its neighbouring Norway (UN, 1997; Medeiros, 2016a). However, vast rural and depopulated areas did not share the de-velopment levels of the larger metropolitan areas of these Scandinavian countries. As such, specific EU Cohesion Policy instruments (Objective 5b and 6) were designed to tackle the development problems of the vast and depopulated northern region of Sweden (Wiberg et al., 2002). At the same time, by 1996, the border areas between Sweden and Norway started to receivefinancial support from the second INTERREG-A Community Initiative (1994–1999). The S-N INTERREG-A Programme was one of several EU CBC programmes, covering a vast border region from the centre to the south of the S-N border area, along-side the‘North’, and ‘Botnia-Atlantica’ programmes up north, and the Øresund-Kattegat-Skagerrak down south (seeHörnström et al., 2012). From the onset, the S-N INTERREG was divided in three sub-programmes, from north to south:‘Nordic Green Belt’, ‘Inner Scandina-via’, and ‘Borderless Co-operation’ (Fig. 2).
In short, the INS INTERREG basically covers the territory of three bor-der provinces (NUTS3): Hedmark (N), Värmland, (S), and Dalarna (S).
Moreover, it includes several municipalities from two Norwegian prov-inces: Akershus (Hurdal, Nannestad, Gjerdrum, Eidsvoll, Ullensaker, Nes, Skedsmo, Lørenskog, Nittedal, Raelingen, Fet, Sørum, and Aurskog-Høland) and Østfold (Askim, Skiptvet, Eidsberg, Trøgstad, Marker, Rømskog, Aremark, Hobøl, and Spydeberg).
Demographically, this border region represents about 7% of the total population of Sweden and Norway, although its distribution is quite un-even as it mostly is concentrated in close proximity to the Oslo metropol-itan area (Østfold/Akeshus), and the main INS urban agglomerations (Hamar, Karlstad, Falun/Börlange). Moreover, if one only regards the bor-der municipalities (Aremark, Marker, Rømskog, Aurskog-Høland, Kongsvinger, Eidskog, Grue, Åsnes, Våler, Trysil, Engerdal, Alvdal, Eda, Torsby, Årjäng, Arvika, Malung, and Älvdalen), by 1995 they represented only 1.14% (151,213 inhabitants) of the Norwegian-Swedish total popula-tion, which was reduced to 0.96% by 2015 (145,183 inhabitants), a reduc-tion of 4% (6030 inhabitants) (Table 2).
From a provincial (NUTS3) perspective, it also is clear that the Swed-ish part of the border is the most demographically affected area with
Table 1
ESPON TIA tools in a nutshell.
Source: Author compilation - based own personal evaluation of the ESPON reports content.
TIA tool ESPON report Main goals EP CF TI TA DI
TEQUILA ESPON 3.2 (2006) – Allow non-specialists to better understand the potential ex-ante impacts of projects/-programmes/policies
– Produce potential ex-ante l impact values of EU directives for EU regions
No No Partly Partly Yes
STEMA ESPON 3.3 (2006) – Provide guidance for policymakers in selecting the most adequate territorial policy solutions, and to recalculate the ex-post situation
– Make use a complete set of territorial indicators to increase the credibility of the research
Yes No Yes Yes No
ARTS (Quick Check) ESPON ARTS (2012),
ESPON (2011)
– Take into account the field exposure, the regional exposure, and the regional sensitivity to assess the potential impacts of a given EU directive
– Develop a tool by which to analyse the impacts of EU legislation that takes the sensibility of regions into account.
No No No No Yes
EATIA ESPON EATIA (2012) – Better identify whether a policy option risks have a large asymmetric territorial impact – Take into account a number of different angles, including different administrative levels,
different types of regions and different functional areas
No No Partly No Yes
EP - ex-post/CF - counter factual evaluation/TI - makes use of the necessary time to obtain relevant potential impact values/TA - takes into account a territorial articulation related elements such as polycentrism/DI - specifically designed to assess impacts of EU legislation/directives.
Fig. 2. - The Inner Scandinavia INTERREG-A sub-programme– 2016 (Note: in the first two INS INTERREG phases only the two border municipalities of Dalarna were part of the sub-programme).
depopulation trends, although it still holds the majority of the INS pop-ulation (57.6% in 1995 versus 51.9% in 2015 - if all Dalarna municipali-ties are included). Again, the population density varies across INS, as it is higher in the southwestern part, due to the influence of the Oslo met-ropolitan area in the Norwegian provinces of Akershus and Østfold, and the south of Hedmark, all the way up to the city of Hamar.
In general, from a socioeconomic development perspective, several re-ports have pointed out numerous territorial weaknesses and threats of INS, since the INTERREG was implemented. These include: (i) a weak eco-nomic and business structure; (ii) low comparable (N-S) levels of educa-tion, (iii) the lack of public transports and the large distances between cities; (iv) the unilateral labour panorama with traditional career choices of men and women in large parts of the area; and (v) the perennial com-petitive disadvantages. On the other hand, this border area presents huge strengths and opportunities, namely in: (i) using the environment (large pristine and protected natural areas) as an asset; (ii) having the potential to better coordinate the use of available resources; (iii) promoting inno-vation and entrepreneurship, and (iv) exploring the tourism and several natural resources such as wood and energy production (NUTEK, 2003, SN_INT, 2007; Ørbeck and Braunerhielm, 2013).
From an economic standpoint, the Gross Domestic Product (GDP), the most used indicator for the provincial level, places INS as a reduced economic force in Scandinavia, as it only contributed about 11.5% of the total Scandinavian (Sweden-Norway) GDP by 1995. Thisfigure dropped slightly to 11.2%, by 2015 (Table 3). Here, however, one must include all the territory from the Norwegian provinces of Akershus and Østfold. Also, if GDP data were available at the municipal level, then the weight of the border municipalities' GDP most probably would be close to 3–4%, or even less.
Although it can be seen as a new political tool for promoting CBC be-tween Sweden and Norway, the fact of the matter is that the Nordic INTERREG programmes have been in the making for decades. The Nor-dic Council of Ministers - created in 1971 - commenced funding NorNor-dic CBC initiatives during the late 1970s. Even so, the introduction of the INTERREG-A in Scandinavia instilled a wider interest, not only from local agents, but also from regional and public entities (universities), in getting access to a larger volume of available funding. Among other things, this new panorama led to increased competition between existing and new stakeholders, for access to these funds. The fact that the newly arrived INTERREG-A Programme was accommodated within already existing formal experiences of Scandinavian CBC, together with the historically high degree of autonomy from Scandinavian municipal-ities, greatly contributed to engagement with this new experience. The new formal and bureaucratic requirements, however, ended up setting aside the smaller cross-border players (Steineke, 2007: 90).
Despite the long-term existing cross-border collaborations in INS, the implementation of the INTERREG-A brought a new era and a novel dynamic to the process of CBC in the area. Firstly, it brought about
additional funding, and with it supplementary players to the process of CBC in the region. Furthermore, it provided a new strategic and multiannual vision to implement a CBC programme, by following EU Funds regulations. But most importantly, it committed regional entities (provinces) in this process, thus providing a more solid foundation and institutional capacity to act strategically from a territorial planning prism.
From a more holistic perspective, the implementation of this INTERREG sub-programme showed that, despite all its positive effects in promoting territorial development and in reducing the barrier effect in all its dimensions, it was incapable of achieving the EU Cohesion policy's main goal of territorial cohesion in INS (Medeiros, 2014c, 2016b). Instead, the path towards territorial exclusion was not inverted along the last two decades in INS, as thefinancial capacity of the INS INTERREG was too reduced to correct all the territorial development needs of this border region.
3. The inner Scandinavia INTERREG-A sub-programme: strategy and investments
Right from the start, the INTERREG-A Community Initiative was launched with the main goals of: (i) helping the EU border areas over-come the problems arising from their relative isolation; (ii) promoting
Table 2
Demographic changes in Inner Scandinavia (1995–2015). Source: National statistics - Author compilation.
Region Inhabitants 1995 total Inhab.1995 % sca. Inhabitants 2015 total Inhab. 2015 % sca. Pop. change 1995–2015 total Pop. change 1995–2015 (%) N - Østfold - INS 43,761 0.33 52,669 0.35 8908 20.4 N - Akeshus - INS 191,946 1.45 268,687 1.79 76,741 40.0 N - Hedmark 186,593 1.41 195,153 1.30 8560 4.6 S - Värmland 284,011 2.15 275,668 1.83 −8343 −2.9 S - Dalarna 289,956 2.19 280,670 1.87 −9286 −3.2 INS - Norway 422,300 3.20 516,509 3.43 94,209 22.3 INS - Sweden 573,967 4.34 556,338 3.70 −17,629 −3.1 Norway 4,356,003 32.97 5,210,441 34.62 854,438 19.6 Sweden 8,857,196 67.03 9,838,418 65.38 981,222 11.1 Sweden/Norway 13,213,199 100 15,048,859 100 1,835,660 13.9 Inner Scandinavia 996,267 7.54 1,072,847 7.13 76,580 7.7
Note: INS - Inner Scandinavia/N - Norway/S - Sweden.
Table 3
Gross domestic product changes in Inner Scandinavia (1995–2013). Source: National statistics - Author compilation.
Region GDP 1995 GDP 1995 (%) Scand. GDP 2013 GDP 2013 (%) Scand. GDP change 1995–2013 (%) N - Hedmark 21.218 2,2 31.970 2,1 50,7 N - Østfold 21.658 2,2 30.264 2,0 39,7 N - Akeshus 25.882 2,7 41.247 2,7 59,4 S - Dalarna 22.365 2,3 36.170 2,3 61,7 S - Värmland 20.366 2,1 33.298 2,2 63,5 INS - Norway (Average) 22.919 2,4 34.494 2,2 50,5 INS - Sweden (Average) 21.366 2,2 34.734 2,2 62,6 Norway (Average) 25.538 2,6 44.444 2,9 74,0 Sweden (Average) 25.412 2,6 42.979 2,8 69,1 S-N (Average) 25.475 2,6 43.712 2,8 71,6 Inner Scandinavia (Average) 22.143 2,3 34.614 2,2 56,3
INS - Norway (Total) 68.758 7,1 103.481 6,7 50,5 INS - Sweden (Total) 42.732 4,4 69.468 4,5 62,6 Norway (Total) 485.221 50,2 759.081 49,0 56,4 Sweden (Total) 481.851 49,8 789.469 51,0 63,8 S-N (Total) 967.072 100,0 1.548.550 100,0 60,1 Inner Scandinavia (Total) 111.490 11,5 172.949 11,2 55,1
the development of networks of cooperation across internal borders; and (iii) assisting external border areas adjust to their new role within the EU Single Market, while exploring the possibilities for cooperation with third countries (seeEC, 1991; De Sousa, 2013). Again, in present times, the official rationale for the European Territorial Cooperation (ECT) objective is centred in the promotion of a harmonious economic, social and territorial development of the EU as a whole, and specifically in tackling common challenges together andfinding shared solutions -whether in thefield of health, research and education, transport or sus-tainable energy.ii
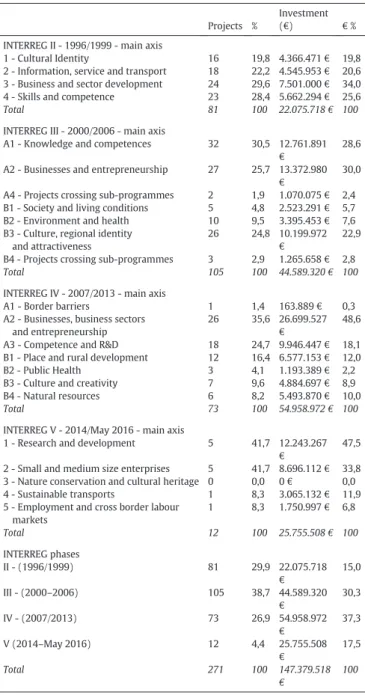
In this context, when thefirst INS INTERREG phase (1996–1999) was implemented, the main strategic intervention axis followed the mainstream EU INTERREG Programme rational of supporting border region's socioeconomic development. More concretely, it allocated al-most 60% of the total funds to promoting business activity and enhanc-ing human capital (skills and competence), while the remainenhanc-ing funds were devoted tofinancing social services and cultural activities. This overall panorama was not dramatically modified in the subsequent pro-gramming phases. However, thefinancial support for the business ac-tivity and research and development related projects was increased overtime, as was the attention given to projects which promote envi-ronmental sustainability (Table 4).
In all, over the course of 20 years of operation, the INS INTERREG fi-nanced more than 270 CBC projects, and allocated almost€150 million to this CBC cause. As expected, and taking into consideration that the ex-pansion of the sub-programme to the entire Dalarna province took place only by 2007, and the reduction of the territorial coverage of the Akershus and Østfold provinces, Hedmark and Värmland took the bulk of the allocated investment (little more than 25% each), although there was a tendency for a more balanced distribution of funds in the last two programming phases (Fig. 3), following the sub-programme secretariat's strategic decision to include partners from most, if not all provinces in theflagship projects.
From another perspective, the type of project leaders varied sub-stantially along the four INS INTERREG programming phases, and on both sides of the border. The role of Public Entities, including regional and local (municipalities) always has been significant in leading the projects although with an evident rise of the local entities in Sweden vis-à-vis the rise of the regional entities in Norway, the role of educa-tional related entities such as universities and colleges, has increased mostly in the Norwegian part of the border, while the role of private en-tities has been reduced over time (Fig. 4).
According to the sub-programme secretariat, this reduction follows from an operational decision to, more or less, stop approving or seeking individualfirms as projects beneficiaries. This decision was supported by the implementation of new state aid rules and regulations, and on a theoretical framework which advocates the gains of supporting cluster build up, rather than individual (often large) companies. In this light, projects such as‘The Scandinavian Way’ (Tourism) and the ‘Scandina-vian Music Union’ brought about research and development (R&D) and brought the education sector into play, alongside knowledge from international partners, to reinforce the regional tourism and cultural in-dustries. More contentedly, the Innovation Music Network (IMN) creat-ed a complete music Innovation System, with a global reach.
4. The potential territorial impacts using TARGET_TIA
A number of various sources contributed to obtain sound and valid potential impacts values associated with the implementation of the INS INTERREG in thefive selected barrier effect dimensions and respec-tive components. As previously explained in the methodology section, the potential impact values attributed to each evaluated parameter vary from−4 to +4:
• +4 very significant positive impacts • +3 significant positive impacts • +2 moderate positive impacts • +1 low positive impacts • 0 null impacts
• −1 low negative impacts • −2 moderate negative impacts • −3 significant negative impacts • −4 very significant negative impacts
Table 4provides a comprehensive picture of all the potential impacts imputed on each evaluated component, and the potential impact aver-ages obtained for all the barrier effect dimensions. This was done not only for the positive/negative analytic vector, but also for the remaining three counterfactual evaluation vectors. In addition, this table shows the imputed values in the two TARGET_TIA adjusted evaluation elements:
ii
http://ec.europa.eu/regional_policy/en/policy/cooperation/european-territorial/.
Table 4
INS INTERREG main intervention axis in the four programming phases (1996–2016). Source: INS INTERREG-A Hedmark Secretariat project database (https://www.dropbox.com/ s/zdiphea16fpz1xf/INS_Project_Database.xlsx?dl=0- Author compilation.
Projects %
Investment
(€) € %
INTERREG II - 1996/1999 - main axis
1 - Cultural Identity 16 19,8 4.366.471€ 19,8
2 - Information, service and transport 18 22,2 4.545.953€ 20,6 3 - Business and sector development 24 29,6 7.501.000€ 34,0 4 - Skills and competence 23 28,4 5.662.294€ 25,6
Total 81 100 22.075.718€ 100
INTERREG III - 2000/2006 - main axis
A1 - Knowledge and competences 32 30,5 12.761.891 €
28,6
A2 - Businesses and entrepreneurship 27 25,7 13.372.980 €
30,0
A4 - Projects crossing sub-programmes 2 1,9 1.070.075€ 2,4 B1 - Society and living conditions 5 4,8 2.523.291€ 5,7 B2 - Environment and health 10 9,5 3.395.453€ 7,6 B3 - Culture, regional identity
and attractiveness
26 24,8 10.199.972 €
22,9
B4 - Projects crossing sub-programmes 3 2,9 1.265.658€ 2,8
Total 105 100 44.589.320€ 100
INTERREG IV - 2007/2013 - main axis
A1 - Border barriers 1 1,4 163.889€ 0,3
A2 - Businesses, business sectors and entrepreneurship
26 35,6 26.699.527 €
48,6
A3 - Competence and R&D 18 24,7 9.946.447€ 18,1 B1 - Place and rural development 12 16,4 6.577.153€ 12,0
B2 - Public Health 3 4,1 1.193.389€ 2,2
B3 - Culture and creativity 7 9,6 4.884.697€ 8,9
B4 - Natural resources 6 8,2 5.493.870€ 10,0
Total 73 100 54.958.972€ 100
INTERREG V - 2014/May 2016 - main axis
1 - Research and development 5 41,7 12.243.267 €
47,5
2 - Small and medium size enterprises 5 41,7 8.696.112€ 33,8 3 - Nature conservation and cultural heritage 0 0,0 0€ 0,0 4 - Sustainable transports 1 8,3 3.065.132€ 11,9 5 - Employment and cross border labour
markets 1 8,3 1.750.997€ 6,8 Total 12 100 25.755.508€ 100 INTERREG phases II - (1996/1999) 81 29,9 22.075.718 € 15,0 III - (2000–2006) 105 38,7 44.589.320 € 30,3 IV - (2007/2013) 73 26,9 54.958.972 € 37,3 V (2014–May 2016) 12 4,4 25.755.508 € 17,5 Total 271 100 147.379.518 € 100
the‘Policy Intensity’ and the ‘Regional Sensibility’. Both of them were evaluated with a 0 to 1 scale, where the 0 signified a reduced Policy In-tensity (amount of investment put in the component) or Regional Sen-sibility (regional needs to invest in the component).
The last two columns of this table were used to produce the two ag-gregated index values (for 1995 and 2015), used for the ex-post evalu-ation formula, in a simplified mode. Simply put, a value from 0 to 1 was imputed, to show the change on each component during the analysed period of time. Here, 0 signifies a reduced degree of importance for this component in the region, and 1 a very important presence of this component in the region. This classification resulted from both quanti-tative and qualiquanti-tative data analysis (Table 5).
Table 6presents thefinal potential impacts for each analysed dimen-sion and a general impact value of the INS INTERREG of + 0.56 in 4, which signifies an overall low positive impact. The obtained results
should be viewed with care, as they depend on the selected compo-nents. In this particular case, thefinancial package of the INS INTERREG was insufficient to cover all the needs of the border region, and all of the analysed components associated with thefive selected barrier effect dimensions.
Put differently, this overall impact value represents an average im-pact value. As such, in the analysed sub-programme, the very low posi-tive potential impact values obtained in the social/cultural (+0.10) and accessibilities (+0.08) dimensions greatly affected the average poten-tial impact value. Indeed, the use of this TIA methodology allowed us to produce a clear picture in which the economy/technology dimension obtained, by far, the highest positive impact value (+3.14 in +4, or sig-nificant positive impact). This result is in line with the general strategic goals of the sub-programme in supporting the regional economic envi-ronment/competitiveness and regional attractiveness, throughout the financing of cross-border business and research networks.
Although no potential negative impacts were imputed, in some com-ponents the impacts of the INS INTERREG were reduced too far to justify the input of any impact value. In this regard, for instance, the lack of di-rect support for the implementation of public transportation by road and by railway, resulted from the reduced support of the sub-pro-gramme in this development policy sector. Consequently, its potential impacts in the accessibilities component are close to null. Even so, indi-rectly, some projects (e.g. Growth Corridor) had a profound impact in alerting the national and regional authorities to the need to improve cross-border transport systems on the main border connections (Tillväxt, 2005; Tillväxtverket, 2009).
Again, some of the selected components for the social/cultural di-mension, such as the establishment of cross-border agreements on use of public services/equipment, and the implementation of agreements to reduce the obstacles posed by differing regulations in the use of social related services (education, health and social security) were also out scope for the evaluated sub-programme. A relatively positive impact value (0.74) was obtained in the institutional/legal analytic dimension, however, mostly because of the positive influence of the sub-pro-gramme in promoting multi-level governance procedures, and by supporting cross-border regional and urban networks among munici-palities, universities, regional authorities, state entities, etc.
The environmental/heritage analytic dimension had a low, yet posi-tive, impact value (+0.41), mainly due to the positive effects of the pro-gramme in supporting green and efficient energy production via cross-border collaborations, and the protection of the regional heritage. Again here, limited positive effects were produced with the engagement of natural protected areas from both sides of the border. This is an aspect to be further explored in future programming cycles of the INS INTERREG.
As previously mentioned, the overall goal of the EU CBC programmes is not to completely erase or eliminate borders. Indeed, as long as the administrative borderlines are present, there will always be barriers to the process of CBC. However, CBC programmes should focus on primar-ily reducing or mitigating the persisting barriers which hamper the nor-mal‘functioning’ of cross-border flows. In this regard, it was particularly important to gather interviewees' opinions on the most persistent bar-riers in INS. In large measure, there was a prevailing notion that the legal and administrative barriers remain quite strong in the area. As a conse-quence, more pro-active actions are needed to reduce those to accept-able levels. Additionally, several mentions were made of other persisting barriers to the CBC process in this border region, such as:
– Lack of political interest, involvement, and interaction, especially at the national level;
– Weakness in CBC infrastructures, and namely the physical connec-tions;
– Peripheral typology of the border area with large distances between populated settlements;
– Unbalanced co-financing of the sub-programme;
Fig. 3. The Inner Scandinavia INTERREG-A sub-programmefinancing (%) per province (Note: INT - INTERREG and INT V until May 2016).
Author.
SWEDEN
NORWAY
Fig. 4. The Inner Scandinavia INTERREG-A sub-programmefinancing (%) per type of project leader partner (Note: INT - INTERREG and INT V until May 2016).
– Institutional barriers because the sub-programme is excessively na-tionally oriented and centralized;
– Lack of cross-border planning, such as for establishing transport sys-tems;
– Existing custom barriers for business;
– Lack of a longer-term vision for the political leadership to discuss cross-border cooperation from a territorial development perspec-tive;
– Reduced number of meetings within the S-N INTERREG programme, which reduce the possibilities to implement a cross-border develop-ment plan, and;
– Lack of a spatial development perspective.
5. The INS INTERREG impacts on the barrier effect dimensions An overview of the relativefinancial distribution to the five analysed barrier effect dimensions in the four phases of the INS INTERREG (Fig. 5) reveals an unsurprising focus on tackling economic/technological bar-riers. Indeed, from the onset, this sub-programme had clear goals for stimulating economic activity in the border area, and stimulating job creation to reduce, as much as possible, the continuous depopulation process in the most remote rural areas. Nevertheless, the INS INTERREG essentially had an attenuation impact on the border region's economic competitiveness, by: (i) stimulating the creation of jobs; (ii) supporting
small and medium-sized enterprises (SMEs); (iii) fomenting a degree of entrepreneurship, even among the younger generations; and (iv) fi-nancing innovative projects in several areas of technology. More point-edly, several thousands of companies were directly involved in different CBC projects in the border area. Such cross-border economic activities also provided a solid platform to assist business and technological de-velopment, either directly and indirectly.
From a different prism, the INS INTERREG has had a positive impact on the creation of networks among regional universities and research institutions along the border region. More precisely, such impacts can be seen in the support given to the improvement of tertiary education, namely in high-tech academic disciplines. Also important was the con-stant support to SMEs as the main economic drivers of the border region (Medeiros, 2013c). In sum, the added value of increasing cross-border collaborations in this economic-technological dimension is quite high, if we take into account the territorial fragilities of this border region. In this view, the main urban border agglomerations benefited the most from the INTERREG-A investments in this specific domain of terri-torial development (Medeiros, 2013c).
In large respect, from the interviewers perspective, the INS INTERREG had a positive impact in supporting the border regions' eco-nomic activity, namely by backing up the tourism industry, innovation and research, development of companies and universities, establish-ment of business cross-border networks and incubators, and involve-ment of younger generations in business activities. On the other hand, the counterfactual evaluation narrative raises some doubts concerning
Table 5
INS INTERREG-A sub-programme– territorial impacts matrix (1996–2016).
Dimension Component Type of impacts (−4 to 4) Average 0 to 1 0 to 1
Pos/Neg End/Exo Sust/Shor Mul/Sub Pol/Int Sen/Reg 1995 2015
Cultural/social Shared social equipment 0 0 0 0 0 0 0,25 0 0
Cultural/social Culture events 2 2 2 3 2,25 0,5 0,25 0,25 0,75
Cultural/social Language 2 2 3 3 2,5 0,25 0,25 0,25 0,5
Cultural/social Legislation (education) 0 0 0 0 0 0 0,25 0 0
Average 1,00 1,00 1,25 1,50 1,19 0,19 0,25 0,13 0,31
Institutional/legal Cross-border structures 1 1 1 1 1 0,25 0,5 0,25 0,5
Institutional/legal Urban networks 2 2 3 3 2,5 0,5 0,5 0,25 0,75
Institutional/legal Multilevel governance 4 4 3 3 3,5 0,5 0,5 0,25 1
Institutional/legal Labour market 1 1 1 1 1 0,25 0,25 0,25 0,5
Average 2,00 2,00 2,00 2,00 2,00 0,38 0,44 0,25 0,69 Economy/technology Employment 3 2 2 4 2,75 0,75 1 0,25 0,75 Economy/technology Innovation 4 3 3 4 3,5 1 1 0,25 1 Economy/technology Infrastructures 1 1 1 1 1 0,25 0,5 0,25 0,5 Economy/technology Entrepreneurship 3 2 2 3 2,5 0,75 1 0,25 0,75 Average 2,75 2,00 2,00 3,00 2,44 0,69 0,88 0,25 0,75
Environmental/heritage National Parks Collaboration 1 1 1 1 1 0,25 0,5 0 0,25
Environmental/heritage Energy 3 2 3 3 2,75 0,75 0,75 0,25 0,5
Environmental/heritage Heritage Protection 2 2 2 2 2 0 0 0,25 0,5
Average 2,00 1,67 2,00 2,00 1,92 0,33 0,42 0,17 0,42
Accessibility Public transports 2 3 2 3 2,5 0,25 0,75 0,25 0,25
Accessibility Road Connections 0 0 0 0 0 0 0,5 0,5 0,5
Accessibility Rail connections 2 3 2 3 2,5 0,25 0,5 0,25 0,25
Average 1,33 2,00 1,33 2,00 1,67 0,17 0,58 0,33 0,33
General Average 1,82 1,73 1,72 2,10 1,84 0,35 0,51 0,23 0,50
Note: Posi/Nega– positive vs negative; Endo/Exog – endogenous vs exogenous; Sust/Shor – sustanability vs short-term; Mult/Subs – multiplier/substitution; Poli/Inte – policy intensity; Regi/Sens– regional sensibility.
Table 6
INS INTERREG-A sub-programme - territorial impacts indexes– 1995-2015.
Item/dimensions General CUL/SOC INS/URB ECO/TEC ENV/HER ACESSI
EIMql = Estimated qualitative impacts (for each‘d’) 1,84 1,19 2,00 2,44 1,92 1,67
Barrier effect index 0,19 0,44 0,50 0,25 0,00 0,00
EIMqt = estimated quantitative impacts (for each dimension‘d’) 4,40 3,00 7,00 8,00 4,00 0,00
EIM = (EIMql * EIMqt) (for each‘d’) 3,12 2,09 4,50 5,22 2,96 0,83
I = regional intensity of‘p’ (for each ‘d’) 0,35 0,19 0,38 0,69 0,34 0,17
S = regional sensibility to‘p’ (for each ‘d’) 0,51 0,25 0,44 0,88 0,42 0,59
0,56 0,10 0,74 3,14 0,41 0,08
the degree of efficiency and sustainability of certain investments, al-though it is hard to establish if the same results could have been achieved without this sub-programme.
In the same vein, the institutional/legal dimension can be related to a wide variety of barriers, which include many legal obstacles (e.g. labour market, social systems,fiscal systems), administrative and regulatory regimes, and the existence of cross-border entities and urban networks; the approved projects greatly beneficiated this dimension. Understand-ably, the role of a CBC programme, such as the INTERREG, is limited in mitigating several institutional barriers, which require a national/EU type of intervention. Indeed, a cursory glance at the Nordic Council of Ministers current border barriers databaseiiishows evidence of the
exis-tence of a wide range of legal and administrative barriers, mainly related to discrepancies with the labour market and social systems legislation. When it comes to the sub-programme's efforts to reduce the institu-tional-legal barrier, we can point to some positive effects in strengthen-ing already existstrengthen-ing urban, local and regional networks, not only between public bodies such as regional and local administrations, and universities, but also between private bodies such as CB entities and pri-vate business (Medeiros, 2014b). Furthermore, the sub-programme has been a fundamental vehicle for promoting the multilevel governance process across the border area, namely by reinforcing the role of the re-gional authorities as the main drivers of project design and implementation.
Alternatively, the interviewed stakeholders put forward several ideas which highlight the role of the INS INTERREG in establishing an ef-ficient border service (Morokulien), for example, in assisting cross-bor-der workers with information about the different legal country systems. Ideas also were presented concerning supporting institutional coopera-tion between educacoopera-tional, and other public and private entities, broad-ening all sorts of CBC partnerships, mixing the bottom-up with the top-down development approach in managing the sub-programme, and helping to improve municipal managing processes, and fulfil regional development plans.
On the negative side, there are stakeholders who consider that an in-tegrated cross-border vision to develop INS as a whole, is lacking from some political actors, and that the sub-programme's secretariat is some-what detached from the local and citizen's level of concern. Additionally, the closing of the Karlstad secretariat, in 2014, has halted the application of the subsidiarity principle, and reduced the potential to increase the
sub-programme's effectiveness and efficiency, as the decisions in the Swedish side of the border are centralized in Östersund.
Regarding the environmental/heritage dimension we can point out the stimulation of the cross-border collaboration between natural protected areas, which was absent prior to the implementation of the INS INTERREG. Also, from a transversal point of view, this sub-pro-gramme followed an‘environmental protection’ policy rationale in all of the approved projects. To complete this picture, a close observation of the approved projects, highlights the presence of many with a direct goal of promoting environmental projects by stimulating the use of re-newable sources of energy, developing innovation on electric vehicles, developing initiatives which promote energy savings, and reintroducing autochthonous species (like the salmon) in their natural environment, to name a few.
When it comes to the cultural/social dimension, Norway and Swe-den share a long history of political and cultural integration (Lundén, 2004). This, in turn, paved the way for cultural and social interchanges, and a reduced barrier in this specific domain (Berger et al., 2004). Even so, the non-Nordic traveller, who crosses the border between those two countries, is able to capture subtle cultural differences on both sides of the border. In this domain, language, which often is regarded as a non-barrier between Norway and Sweden, due to a high level of vocab-ulary similarities, can be viewed as one example of these cultural differ-ences. Sure enough, the language rarely poses fundamental obstacles to the CBC process in INS. But, for the younger generations, this reality is not as straightforward as most think, because many young Scandina-vians have much less contact with‘sources of cultural spillovers’ from the other side of the border such as TV and radio programmes.
In this specific domain, the INS INTERREG did not contributed direct-ly to reducing this type of cultural barrier, for instance, byfinancing Nor-wegian and Swedish language courses. Nevertheless, the simple fact that this sub-programme put in contact thousands of local, regional, and private actors and entities, provide us with a solid base to argue that it had a positive impact in reducing the language barrier, although indirectly. Moreover, and regarding the younger generations, the imple-mentation of youth cross-border sports, educational, and cultural activ-ities, also contributed to reducing cultural barriers, as well as the language barrier in INS.
Indeed, the sharing of social related services and equipment is out of the scope of the INS INTERREG. On the other hand, many projects pro-vided a cultural interchange background by promoting tourism, tradi-tions and history preservation, establishing of educational networks, and promoting documentaries, leaflets, theatre and opera, and music and dance events (Medeiros, 2013c). Curiously, the INS INTERREG opened up the minds of many CBC participants to the existence of cer-tain cultural differences between the sides of the border. This new awareness made it possible to put this cultural them as one main objec-tive of the S-N CBC Programme, to generate processes of mutual under-standing that will be useful for future co-operations (EC, 2003).
The accessibilities barrier, however, was greatly affected by the re-duced number of approved projects in this domain (Table 3). For most local and regional authorities this is not seen as a major problem, as they do not receive constant complains from cross-border commuters, and because they do not experience these type of cross-border obstacles on a daily basis. Nevertheless, according toSåtvedt (2015)the cross-border traffic flows on the two main INS road crossings are significant (Magnor: 5.500 vehicles per day, and Ørje: 4.000), and have grown the past decades (Medeiros, 2010b; Ørbeck and Braunerhielm, 2013). This is a huge indication of the need to improve cross-border accessibil-ity infrastructures in INS. Nonetheless true, there is a need to take into account that CBC programmes support infrastructure development only to some extent, and when it comes to cross-border transports, ex-perience shows that, for the most part, the is still a strong inertia of cen-tral state powers in the EU when it comes to binding project decisions which serve the needs of cross-border commuters (Dörry and Decoville, 2013).
Note: INTERREG -V until May 2016
Fig. 5. INS INTERREG investment by barrier effect dimension (%). Author.
iii
http://www.norden.org/sv/nordiska-ministerraadet/samarbetsministrarna-mr-sam/ graenshinderarbete/graenshinderdatabasen/aktuella-graenshinder.
Interviews with the stakeholders brought to the table the impor-tance of several studiesfinanced by the INS INTERREG, especially the one associated with the‘Growth Corridor’ project, in alerting national and regional authorities to the need to improve the accessibility degree in the Stockholm-Karlstad-Oslo axis of the Swedish-Norwegian socio-economic triangle. As a consequence, the Oslo/Stockholm train connec-tion was reopened with great benefits for the border region, while the decision to implement a more frequent commuter train connection be-tween Karlstad and Oslo is soon to be implemented, as a consequence of the knowledge produced under the auspices of the INS INTERREG. It is also recognized, however, that the goal of improving cross-border infra-structures faces barriers mainly of a legal and regulatory character, which hampers a more effective and efficient cross-border collaboration in the fundamental domain of cross-border planning.
6. Conclusion
The implementation of the INS INTERREG, during the past twenty years, was marked by several successive phases, very much aligned with each of the four programming periods. In short, from an initial phase of discovering the differences and establishing and reinforcing cross-border ties, at all institutional levels, a subsequent phase saw in-creasing programme additionality and efficiency. Hence, by the begin-ning of INTERREG IV (2014), all the necessary ingredients to implement this sub-programme with high levels of effectiveness were present: experienced secretariat, robust and engaged political cross-border partnerships, and a pool of active and experienced stakeholders from all around the border area. But more importantly, thefinancing of a new set of innovative and high potential impact projects was followed, showing signs of a more mature and efficient project operationalization of the sub-programme, which was extensive to the present program-ming period.
In short, the evolution curve of the INS INTERREG implementa-tion is extremely positive in all prisms. The political partnership be-tween all territories involved has been reinforced and solidified overtime. Secondly, the potential impacts of the sub-programme in-vestments have been increasing gradually and have greatly reduce the barrier effect along the border area. Lastly, a vast set of cross-bor-der networks have been forged and cemented, including educational networks and private enterprise networks. The latter is a clear sign of the indirect positive impact of this sub-programme, which has been able to support the territorial development of the border area in all its dimensions.
However, given the immense territorial development needs of the border region as a whole, the positive impacts of the INS INTERREG were not sufficient to invert a constant trend of the European border regions to follow a path of territorial exclusion, instead of territorial cohesion. This was due mainly to the limited amount offinancing al-located to the sub-programme vis-à-vis the territorial needs of INS. Even so, the priority given to support the attractiveness of the most socioeconomic and demographic dynamic areas of the border area (normally the medium cities) helped to mitigate this territorial exclu-sion path.
Moreover, and answering the two guiding research questions of this article, we can conclude that, from a positive standpoint, the barrier ef-fect clearly was reduced along the border area, with particular emphasis on economic/technological dimension due to the sub-programme inter-vention strategy goals of promoting regional attractiveness and eco-nomic competitiveness. The support given to fostering innovation, entrepreneurship and job creation was pivotal to mitigating the existing barriers, as a wide pool of cross-border partnerships between universi-ties, research institutes, and companies was engaged.
Additionally, there were many positive impacts in the sociocultural domain, namely through the implementation of a myriad of projects which publicized cultural and sports events, and had an indirect positive impact on the learning of the language from both sides of the border.
Moreover, the sub-programme produced positive impacts in the environmental/heritage dimension, by promoting cross-border collabo-rations between protected natural areas on both sides of the border. Also important were the positive impacts on the use of renewable sources of energy, and the measures to increase efficiency energy usage.
Finally, by establishing and promoting a multi-level governance sys-tem across the border region, and by implementing new urban, local, and regional networks, of all sorts, the sub-programme was able to mit-igate the institutional/legal barrier along the border area. Nevertheless, when it comes to the accessibilities barrier, the lack offinancial muscle prevented a more effective intervention to increase levels of cross-bor-der accessibility in the borcross-bor-der area.
In sum, the future of the INS INTERREG looks bright, as long as the fi-nancial and institutional capacity is maintained and increased, and if it's main strategic goals are focused on the reduction of the prevailing bor-der obstacles, and on the valorisation of the borbor-der regions' territorial capital. As for the continuation of monitoring and evaluating the sub-programme main territorial impacts, there is a need to make available more detailed datasets of cross-border related statistics, namely at the regional and local (municipal) levels, to better grasp the correlations and causalities between the INS INTERREG investments and the regional development trends.
In this regard, this study can be regarded as afirst step to implement and developing a TIA procedure on an EU CBC programme. Following from this experience, we alert all interested in applying ex-post TIA pro-cedures in assessing CBC programmes that this endeavour requires the collection and analysis of a vast array of quantitative (statistics, project data) and qualitative (interviews, bibliography) information, which takes no less than three to four months, depending on the number of re-searchers involved. And here, we recommend focusing attention on the potential impacts of CBC programmes on reducing the barrier effect in all the proposedfive dimensions. However, the related components could be adjusted to the idiosyncrasies of each border region/CBC pro-gramme. Finally we alert to the fact that, since policies do not act on iso-lation, thefinal results should be read with care. But at the same time, they should offer a comprehensive, sound, holistic, and complete as pos-sible overview of the potential impacts of the evaluated CBC pro-gramme, in order to be regarded as a TIA.
Appendix A. Annexes A. Interview questionnaire
1. What have been the main positive achievements of the implementa-tion of Inner Scandinavia cross-border cooperaimplementa-tion (CBC) Pro-gramme, during the last 20 years, for the border region?
2. What have been the less positive aspects associated with the imple-mentation of Inner Scandinavia cross-border cooperation (CBC) Pro-gramme, during the last 20 years, for the border region?
3. More specifically, from 1 (very low) to 5 (very high), how do you classify the main impact of this Programme in reducing the barrier-effect in the following barrier-barrier-effect dimensions?
3.1 Accessibilities (road infrastructure, public transports) 3.2 Sociocultural (use of social equipment's, education, language) 3.3 Economic/Technological (income, job creation,firms creation,
in-novation, knowledge production)
3.4 Environmental/heritage (national parks collaboration, environ-ment and heritage protection, natural tourism)
3.5 Institutional/legal (cross-border entities, governance, laws, regulations)
4. What are the most persisting barriers to cross-border cooperation in the area in present times?
5. What should be the main strategy for the following 20 years of this Programme?
B. Interviewed persons (In April 2016).
Region Hedmark: • Ms. Siri Austeng • Mr. Bjørn T. Andersen • Mr. Erik Hagen
• Mrs. Anne Karin Adolfsen • Mr. Ole Jørn Alfstad Region Värmland: • Mr. Kurt Ekelund • Mr. Sture Hermansson • Mr. Claes Pettersson • Mr. Magnus Dagerhorn Region Dalarna: • Mr. Kurt Podgorski Region Akershus: • Mr. Inge Solli • Mr. Eirik Mathiesen • Mr. Lars Salvesen Region Østfold: • Mr. Haabeth References
Abler, R., Adams, J., Gould, P., 1972.Spatial diffusion: meshing space and time. Spatial Or-ganization: The Geographer's View of the World. Prentice-Hall, Englewood Cliffs, NJ, pp. 389–422.
AEBR, 2008.Cooperation Between European Border Regions. Review and Perspectives. Nomos, Baden-Baden.
Berger, S., Ørbeck, M., Forsberg, G., 2004. Atlas over Inre Skandinavien. Befolkningsutveckling, Näringsliv och Livsmiljö, Ett Samarbetsprojekt Mellan. Karlstads universitet och Østlandsforskning, Karlstad.
CoR, 2016.EGTC Monitoring Report 2015 Implementing the New Territorial Cooperation Programmes. Committee of the Regions, Brussels.
Cranfield, M., Luccese, A., 1996.Cross-border and inter-regional cooperation in the Euro-pean Union. EuroEuro-pean Parliament, Directorate General for Research, Working Papers, Regional Policy Series, W-19 Luxembourg.
De Sousa, L., 2013.Understanding European cross-border cooperation: a framework for analysis. J. Eur. Integr. 35 (6), 669–687.
Dörry, S., Decoville, A., 2013.Governance and transportation policy networks in the crossborder metropolitan region of Luxembourg: a social network analysis. Eur. Urban Reg. Stud. 23 (1), 69–85.
EC, 1990.INTERREG, breaking through borders. Commission of the European Communi-ties, Directorate-General for Regional Policies, Info Background.
EC, 1991.INTERREG. Breaking Through Borders, Commission of the European Communi-ties, Directorate General for Regional Policy. Infobackground, Brussels.
EC, 1999.MEANS– Evaluation Socio-economic Programmes – Evaluating Design and Management. vol. 1. European Commission, Luxembourg.
EC, 2003.Program för gemensakapsinitiativet INTERREG IIIA– Sverige –Norge 2000– 2006. Godkant, European Commission, Brussels.
EC, 2009.Impact Assessment Guidelines, 15 January 2009, European Commission, Brus-sels. (2010) Investing in Europe's Future:fifth Report on Economic, Social and Terri-torial Cohesion. European Commission, Brussels November 2010.
EC, 2010.EUROPE 2020 - a strategy for smart, sustainable and inclusive growth. Commu-nication from the Commission, 3.3.2010. European Commission, Brussels.
EC, 2013.Assessing territorial impacts: operational guidance on how to assess regional and local impacts within the Commission Impact Assessment System. Commission Staff Working Document, 17.1.2013 SWD 3 Final. European Commission, Brussels.
EC, 2015.Territorial Cooperation in Europe. A Historical Perspective. Regional and Urban Policy, European Commission, Luxembourg.
ESPON, 2011.The TIA Quick Check. Advanced Version. ESPON, Luxembourg.
ESPON 3.2, 2006.Spatial scenarios and orientations in relation to the ESDP and Cohesion Policy. Territorial Impact Assessment, Final Report, October 2006 vol. 5. ESPON, Luxemburg.
ESPON 3.3, 2006.Territorial dimensions of the Lisbon-Gothenburg strategy. Final Report Revisited, Part One, 15 December 2006. ESPON, Luxembourg.
ESPON ARTS, 2012.Assessment of Regional and Territorial Sensitivity, Applied Research 2013/1/17, Final Report, Version 30/07/2012 Luxemburg.
Estelle, E., 2016. The European grouping of territorial cooperation (EGTC): towards a supraregional scale of governance in the greater region SaarLorLux? Geopolitics
http://dx.doi.org/10.1080/14650045.2015.1104667.
Fischer, T.B., Gore, T., Golobic, M., Pinho, P., Sykes, O., Marot, N., Waterhout, B., 2015. Ter-ritorial impact assessment (TIA) of European draft directives– the emergence of a new policy assessment instrument. Eur. Plan. Stud. 23 (3), 433–451.
Golobic, M., Marot, N., Kolaric, S., Fischer, T.B., 2015.Applying territorial impact assess-ment in a multilevel policy making context– the case of Slovenia. Impact Assess. Proj. Appr. 33 (1), 43–56.
Hägerstrand, T., 1967.Innovation Diffusion as a Spatial Process. University of Chicago Press, Chicago.
Hörnström, L., Olsen, L.S., Van Well, L., 2012.Cross-border Cooperation and Nordic Value Added (CRONOR), Nordregio Working Paper 2012:14 Stockholm.
Huggins, C., 2013.Motivations behind local government transnational networking. Reg. Insights 4 (1), 9–13.
Lundén, T., 2004.On the Boundary, About Humans at the End of Territory. Södertörns Högskola, Huddinge.
Medeiros, E., 2010a.Old vs Recent Cross-Border Cooperation: Portugal-Spain and Swe-den-Norway. AREA 42 (4), 434–443.
Medeiros, E., 2010b.The Cross-Border Cooperation between Sweden and Norway. INTERREGA Territorial Impacts (19942006). IGOT CEG NEST Report 2010, IGOT -Centro de Estudos Geográficos da Universidade de Lisboa Núcleo de Estratégias e Políticas Territoriais (NEST)Lisbon University, Lisbon.
Medeiros, E., 2011.(Re)defining the concept of Euroregion. Eur. Plan. Stud. 19 (1), 141–158.
Medeiros, E., 2013a.Euro-Meso-Macro: The new regions in Iberian and European Space. Reg. Stud. 47 (8), 249–1266.
Medeiros, E., 2013b.Assessing territorial impacts of the EU Cohesion Policy: the Portu-guese case. Eur. Plan. Stud. 22 (9), 1960–1988.
Medeiros, E., 2013c.Territorial Perspectives in Inner Scandinavia (2014– 2020), IGOT -CEG - NEST Report 2010, IGOT - Centro de Estudos Geográficos da Universidade de Lisboa, Núcleo de Estratégias e Políticas Territoriais (NEST). Lisbon University, Lisbon.
Medeiros, E. (ed.) 2014a. Territorial Impact Assessment (TIA). The process, Methods and Techniques. Centro de Estudos Geográficos, ZOE, Lisbon, 126p. (ISBN - 978-972-636-246-3).
Medeiros, E., 2014b.Barrier Effect and Cross-Border Cooperation: Sweden-Norway INTERREG.A Territorial Effects. Finisterra, XLIX 98, 87–100.
Medeiros, E., 2014c.Territorial cohesion trends in Inner Scandinavia: the role of cross-border cooperation (INTERREG-A 1994-2010). Norsk Geografisk Tidsskrift 68 (5), 310–317.
Medeiros, E., 2015.Territorial Impact Assessment and Cross-Border Cooperation. Reg. Stud. Reg. Sci. 2 (1), 95–115.
Medeiros, E., 2016a.EU Cohesion Policy in Sweden (1995–2013). A territorial Impact as-sessment. Eur. Struct. and Invest. Funds J. 4 (2015), 209–230.
Medeiros, E., 2016b. Territorial Cohesion: An European Concept. European Journal of Spa-tial Development 60 Available from:http://www.nordregio.se/Global/EJSD/Refereed articles/refereed60.pdf. Online publication date: April 2016.
Nijkamp, P., Batten, D., 1990.Barriers in spatial interaction. Ann. Reg. Sci. 24 (4), 233–236.
Nijkamp, P., Rietveld, P., Salomon, I., 1990.Barriers in spatial interactions and communi-cations. A conceptual exploration. Ann. Reg. Sci. 24 (4), 237–252.
NUTEK, 2003.Slututvärdering av Interreg II-A Programmem, Sverige–Norge. NUTEK, Stockholm.
Ørbeck, M., Braunerhielm, L., 2013.EU 2020 - Grenseindeks og grenseanalyser Interreg Sverige-Norge, Faktaunderlag for ny Programsøknad for 2014–2020, ØF-rapport 07/ 2013. Østlandsforskning and Karlstad University, Lillehammer.
Panteia, 2009.Ex-post Evaluation of INTERREG 2000–2006. 1st Interim Report to the Eu-ropean Commission DG REGIO, Main Report. EuEu-ropean Commission, Bruxelas.
Perkmann, M., 2003.Cross-border regions in Europe, significance and drivers of regional cross-border co-operation. Eur. Urban Reg. Stud. 10 (2), 153–171.
Rodríguez-Pose, A., 2002.The European Union. Economy, Society, and Polity. Oxford Uni-versity Press, New York.
Såtvedt, Ø., 2015.Svensk-Norske Transportkorridorer PPT Presentation Stockholm.
SN_INT, 2007.Program för Europeiskt Territoriellt Samarbete Interreg Swerige– Norge 2007–2013, Godkänd av EU kommissionen 2007-11-15 – Detta Program Delfinansieras av Europeiska Regionala Utvecklingsfonden Sverige och Norge, CCI: 2007CB163PO016.
Steineke, J.M., 2007.Territorial cooperation - extending interaction. Regional develop-ment in the Nordic countries, Nordregio Report 2007:1, pp. 89–96 Stockholm.
Tillväxt, 2005.Att växa tillsammans. Om Projektet Tillväxkorridoren Oslo-Karlstad-Stock-holm, Swedish-Norwegian INTERREG-A Project Stockolm.
Tillväxtverket, 2009.Lärande inom Territoriellt samarbete Rapport, Lägesrapport rörande resultatuppföljning och spridning av det svenska deltagandet i samtliga program för territoriellt samarbete Rapport 0040 Stockholm.
UN, 1997.Human Development Report 1997. United Nations, New York.
Wiberg, U., Jansson, B., Lundmark, L., 2002.Ex-post Evaluation of Objective 6 Programmes for the Period 1995–1999, Country Report for Sweden. Umeå University.