HIC 2006, Nice, FRANCE
HYDROINFORMATICS BASED DECISION-MAKING
INTEGRATING MODELLING, SAMPLING AND PROFILING:
THE RIA FORMOSA CASE
FLÁVIO MARTINS, JANEIRO, J., VENÂNCIO, A., GABRIEL, S., LOPES, J.
Escola Superior de Tecnologia, Universidade do Algarve Campus da Penha, 8005-139 Faro, Portugal
NEVES, R.
Instituto Superior Técnico, Av. Rovisco Pais 1049-001 Lisboa, Portugal
FREIRE, J., MARTINS, A.
Águas do Algarve, S.A., Rua do Repouso, 10 8000-302 Faro, Portugal
ABSTRACT
A Waste Water monitoring program aiming to help decision making is presented. The program includes traditional and inboard sensor sampling, hydrodynamic and water quality modeling and a GIS based database to help the decision making of manager authorities.The focus is in the quality of waters receiving discharges from Waste Water Treatment Plants. Data was used to feed model simulations and produce hydrodynamic, effluent dispersion and ecological results. The system was then used to run different scenarios of discharge flow, concentration and location.The results enable to access the current water quality state of the lagoon and are being used as a decision making tool by the waste water managers in the evaluation phase of the treatment plant project to decide the location and the level of treatment of the discharge.
INTRODUCTION
Decision-making is frequently conducted based in “rules of thumb” rather than in sound scientific knowledge. This happens not because of the lack of scientific work for the region under evaluation, but because the scientific and decision making communities do not communicate. This produces lack of knowledge and, more important, lack of confidence in scientific results [4]. In this article a different scenario is presented where a Hydroinformatics based approach to decision-making is conducted. The work was sponsored by the decision authority responsible by the waste water discharges. A monitoring effort centered in the MOHID numerical model and integrating also water sampling and on-board multi-parameter profiling is used to monitor the waters of the
main water bodies in Algarve (South of Portugal). The Almargem channel in Ria Formosa coastal lagoon is here presented as a case study.
Ria Formosa is a large coastal lagoon, with an area of more than 80 Km2 as presented in Figure 1. The western part represents more than 80% of the total area of Ria Formosa and is characterised by mudflats crossed by a complex network of channels. At low waters more than 80% of the area is dry, while in high water most of the mudflats are submerged. The Eastern part, where Almargem Channel is located, is long and narrow, with a small extent of mudflats in the sides of the main channel. The hydrodynamic connection between the two parts is small.
Almargem
Figure 1: Ria Formosa coastal lagoon. Extensive mudflats, intricate net of channels, barrier islands and bars can be seen.
The Almargem region is presented in detail in Figure 2. The Almargem channel properly is the downstream extension of the Almargem fresh water stream into the lagoon. The lagoon in this area is formed by a single channel (Cabanas Channel) linked to the sea by two bars and protected by a barrier island. The average depths of the channels are about 2 meters and the average tidal extension (double amplitude) is 3 meters. The Almargem stream is not permanent, and the flow is only present during rain events. Ria Formosa hosts a Natural Park, important ports of the southern Portuguese coast and significant bivalve aquaculture activity. It is an important region for several species of limicolous birds’ nestbuilding. It is also important for several species of fish, mollusca and crustacea. The Almargem system is influenced by the urban effluents from the city of Tavira and a small discharge from the Cabanas village. The Tavira waste water treatment plant (WWTP) use secondary treatment and discharge the effluent in Gilão River. The WW authority is planning the construction of a new WWTP to receive both effluents. The discharge point is planned to be located inside Almargem Channel.
Almargem Channel
Cabanas Channel
Gilão River
Figure 2: Tavira region of Ria Formosa, showing Almargem and Cabanas Channels and Gilão River. Dots for classical water sampling, white: microbiology, gray: chemistry and chlorophyll.
The focus in this study is on the quality of the waters receiving discharges from Waste Water Treatment Plants. Continuous on-board sensor sampling techniques in conjunction with classical laboratory analysis were used to monitor the state of the system. This data was used to feed model simulations and produce hydrodynamic, effluent dispersion and ecological results. The system was then used to run different scenarios of discharge flow, concentration and location. The objective is to understand the impact of the new WWTP projected for the Almargem region.
METHODS Classic Analyses
Classic laboratory analyses were taken monthly during one year in the points shown in Figure 2. The properties and methods are summarized in Table 1.
Table 1. Properties and laboratory methods used for the classic analyses.
Property Method*
Total Coliforms IDXX Colilert 18 Fecal Coliforms SMEWW 9221 -E Fecal Enterococci IDXX Enteroalert Escherichia coli IDXX Colilert 18 Ammonia SMEWW 4500 NH3-F Nitrate SMEWW 4500 NO3-F
Total Nitrogen SMEWW 4500 Norg B+ 4500 NO3-F+4500 NH3-F Total Dissolved Nitrogen SMEWW 4500 Norg B+ 4500 NO3-F+450 NH3-F Dissolved Oxygen SMEWW 4500-O C
Salinity SMEWW 2520 B Chlorophyll a SMEWW 10200 H 2 pH (20 ºC) –Sorensen Scale SMEWW 4500 B
*SMEWW - Standard Methods for Examination of Water and Wastewater
Continuous On-board Sensors
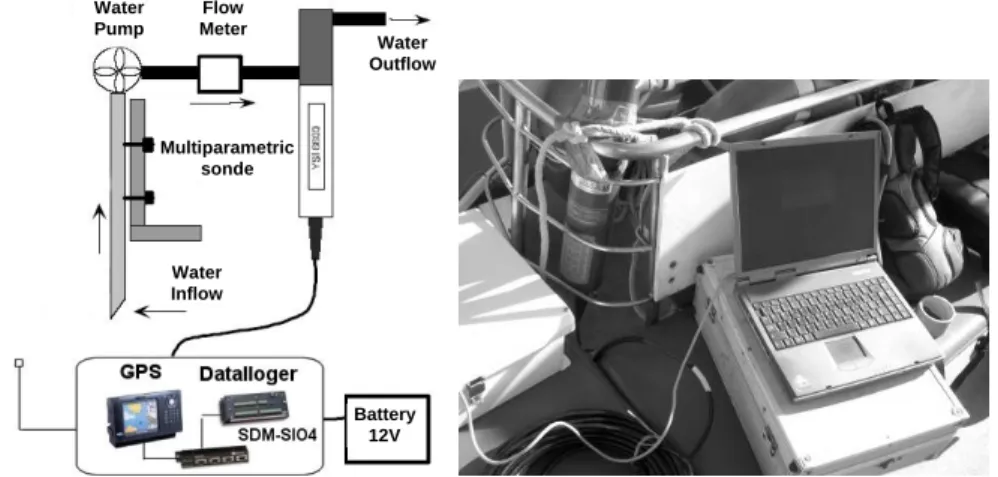
Classic analyses were complemented by on-board sensor measurements. The apparatus is composed by an YSI 6600 EDS multi-parameter sonde, connected to a CR10X datalogger from Campell Scientific and a SIMRAD CE33 GPS. The sonde is located on-board and receives water from a pipe and pump system (Figure 3).
Water Pump Flow Meter Water Outflow Multiparametric sonde Water Inflow Battery 12V
Figure 3: On-board sensor apparatus with YSI 6600 EDS sonde, CR10X datalogger and SIMRAD CE33 GPS.
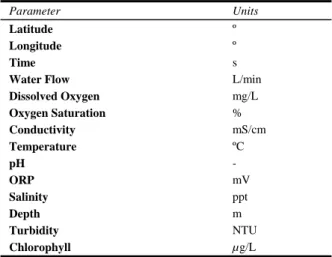
Table 2 show the properties measured by the sonde. This system was used continuously in the classic sample campaigns to fill the gaps between the measurement stations.
Table 2. Properties measured with the on-board sensor apparatus.
Parameter Units
Latitude º
Longitude º
Time s
Water Flow L/min
Dissolved Oxygen mg/L Oxygen Saturation % Conductivity mS/cm Temperature ºC pH - ORP mV Salinity ppt Depth m Turbidity NTU Chlorophyll µg/L Numerical Model
The MOHID modeling system was used to perform the simulations (http://www.mohid.com). This system is driven by a 3D baroclinic hydrodynamic module including an Eulerian and a Lagrangian transport module. Parameters and processes involving non-conservative properties are object of specific modules (e.g. turbulence, water quality, ecology and oil transformation). The hydrodynamic model solves the three-dimensional incompressible primitive equations [2]. Hydrostatic equilibrium is assumed as well as Boussinesq approximation. The model uses a finite volume approach. This method makes the solution independent of the mesh geometry, allowing the use of a generic vertical mesh. The turbulence parameters are computed using the well known General Ocean Turbulence Model (GOTM) [1]. The model also solves a transport equation for salinity and temperature in order to compute the specific mass. The eulerian transport module used to transport these properties is based in the same finite volume method of the hydrodynamic model and is independent of the property transported. The Lagrangian transport model tracks the trajectories of selected water masses using the transport fields from the hydrodynamic model in an explicit procedure. Dispersion is computed using the results from the turbulent model. The ecological model uses a zero-dimension formulation that enables the application of the same model with both the Lagrangian and the Eulerian transport models [3]. In this method the model equations are implemented in the form of source and sink terms of the transport models. Those terms are written in a generic form and can be applied both to Eulerian cells and to Lagrangian particles. The ecological model simulates the nitrogen cycle, the dissolved oxygen concentration, the BOD, the zooplankton and the phytoplankton population dynamics. The nitrogen species include the three main inorganic forms: ammonia, nitrate and nitrite
and also three organic fractions: dissolved refractory fraction (DRON), dissolved non-refractory fraction (DNRON) and particulate fraction (PON).
RESULTS
In Figure 4 measurement results for the twelve campaigns are shown. The fecal coliforma are in NMP (most probable number) / 100ml. The two horizontal limits are the Maximum Recommended Value (VMR) and the Maximum Allowed Value (VMA) of the Portuguese law for bath waters (102 and 2x10³ respectively). These values are presented as a guide despite the fact that the interior of Ria Formosa is not considered bath water.
Coliformes Fecais (NMP/100ml) 1.E-01 1.E+00 1.E+01 1.E+02 1.E+03 1.E+04 1.E+05 1.E+06
Dez-04 Jan-05 Fev-05 Mar-05
Abr-05 Mai-05 Jun-05 Jul-05Ago-05 Set-05 Out-05Nov-05 VM11 VMR VMA >16000>16000 >1600>1600 >1600>1600 Coliformes Fecais (NMP/100ml) 1.E-01 1.E+00 1.E+01 1.E+02 1.E+03 1.E+04 1.E+05 1.E+06
Dez-04 Jan-05 Fev-05Mar-05Abr-05 Mai-05 Jun-05 Jul-05Ago-05Set-05 Out-05Nov-05 VM2 VM R VM A >16000 >1600>1600 >1600 >1600>1600 >1600 Coliformes Fecais (NMP/100ml) 1.E-01 1.E+00 1.E+01 1.E+02 1.E+03 1.E+04 1.E+05 1.E+06
Dez-04 Jan-05 Fev-05Mar-05
Abr-05 M ai-05 Jun-05 Jul-05 Ago-05
Set-05 Out-05 Nov-05 VM10 VMR VMA <2 >160 0 >160 0 Coliformes Fecais (NMP/100ml) 1.E-01 1.E+00 1.E+01 1.E+02 1.E+03 1.E+04 1.E+05 1.E+06
Dez-04 Jan-05 Fev-05 M ar-05
Abr-05 Mai-05 Jun-05 Jul-05 Ago-05
Set-05 Out-05 Nov-05 VM7 VMR VMA >1600 >1600 Coliformes Fecais (NMP/100ml) 1.E-01 1.E+00 1.E+01 1.E+02 1.E+03 1.E+04 1.E+05 1.E+06
Dez-04 Jan-05 Fev-05Mar-05
Abr-05 M ai-05 Jun-05 Jul-05 Ago-05
Set-05 Out-05 Nov-05 VM5 VM R VMA <2 >1600 >1600 >1600 Coliformes Fecais (NMP/100ml) 1.E-01 1.E+00 1.E+01 1.E+02 1.E+03 1.E+04 1.E+05 1.E+06
Dez-04 Jan-05 Fev-05M ar-05
Abr-05 Mai-05 Jun-05 Jul-05 Ago-05 Set-05 Out-05Nov-05 VM1 VMR VMA >1600 >1600 >1600 >1600 Coliformes Fecais (NMP/100ml) 1.E-01 1.E+00 1.E+01 1.E+02 1.E+03 1.E+04 1.E+05 1.E+06
Dez-04 Jan-05 Fev-05 Mar-05
Abr-05 M ai-05 Jun-05 Jul-05 Ago-05 Set-05 Out-05Nov-05 VM6 VM R VM A <2 >160 0 b) a) c) d)
Figure 4: Measurement Results along the year for Almargem: a) Fecal Coliforms, b) Phytoplankton concentration, c) Nitrate concentration and d) Total nitrogen.
The model results obtained are summarized in Figure 5. In panel a) the velocity fields in the confluence of cabanas channel, Gilão River and Tavira Bar channel are shown. The results were calibrated using a spring-neap time series of velocity measurements. The water quality model results are shown in panel b). Panel b1) show the annual average phytoplankton concentrations obtained by temporal and spatial integration of the
distributed cell concentrations over 10 polygons. Panel b2) show the computed total annual transport of phytoplankton across those polygons. Panels c) and d) show simulations of two different scenarios of WWTP discharges into the system. These simulations were performed to understand the impact on the system of the future Almargem WWTP. In panel c) the discharge is located in Cabanas Channel while in panel d) the discharge is located in the central part of Almargem Channel. Both images are for the same time instant: Low Waters during the day.
1 2 3 4 5 6 7 8 9 10 1 2 3 4 5 6 7 8 9 10 0.046 0.052 0.059 0.060 0.055 0.056 0.052 0.045 0.057 0. 0 6 6 b1 1 2 3 4 5 6 7 8 9 10 1 2 3 4 5 6 7 8 9 10 2.95 3.48 3. 03 .02 9 2.28 20.9 2 .7 2 2.18 2.50 2.42 2.41 2.85 3.09 2.95 3.48 3. 03 .02 9 2.28 20.9 2 .7 2 2.18 2.50 2.42 2.41 2.85 3.09 b2 a d c
Figure 5: Model Results for Almargem: a) Velocity fields, b1) Phytoplankton Concentration [mgC/l], b2) Phytoplankton annual transport [Ton/y], c) WWTP discharge in Cabanas Channel, d) WWTP discharge in Almargem Channel.
DISCUSSION
Microbiologic measurements show that fecal coliforms in Almargem Channel are between VMR and VMA values. This is an interesting result since presently there is no WWTP discharge into this channel. The high concentrations seem to indicate important sources from land. This is confirmed by continuous sampling during a 24h period showing higher concentrations during ebb. The Gilão River show higher Concentrations (frequently above VMA). This trend will change in the future with the construction of the Almargem WWTP and the closure of Tavira WWTP.
The Lagrangian transport model was used to simulate two discharge scenarios for Almargem WWTP. Both scenarios use the project horizon discharge flow of 0.14 m3/s and the projected discharge concentration of 2x10³ NMP/100ml. The results of Figure 5 show that the discharge in Almargem channel produce higher concentrations on Almargem channel but lower concentrations in Cabanas Channel and a lower threat to the beaches located on the outside of the barrier islands. The discharge located in Cabanas Channel produce lower concentrations in Almargem Channel but a higher concentration in Ria Formosa main channels and a higher threat to the beaches.
The nutrient loads to this system come mainly from Almargem and Gilão water lines and from the costal zone through the bars. The ecological model results show that the nutrients entering the system from the coastal region are several times higher than those coming from land. This is due to the presence of an important upwelling regime in this coast and to the absence of important fresh water streams (Gilão and Almargem Rivers are intermittent streams, showing flows only during rain events). The Phytoplankton results show that Ria Formosa acts as a net producer and exporter to the coastal zone. Average concentrations of Phytoplankton, nutrients and dissolved oxygen indicate that globally the system show no symptoms of eutrophication.
CONCLUSIONS
This work has shown the advantage of join in the same project universities and management authorities. The methodology, using several sampling techniques and numerical models coupled in a management platform showed to be an efficient way of helping managers in the decision making process. For the Almargem region of Ria Formosa, suggestions for the best location of WWTP discharge were made. In addition, the impact of the treatment plant in respect to microbiologic water quality and the trophic state of the system were possible.
REFERENCES
[1] Buchard, H., K.Bolding & M.R. Villarreal, GOTM a General Ocean Turbulence
Model. Theory, implmentation and test cases, Report EUR18745 EN, European
Comission, 103 pp., 1999.
[2] Martins, F., Neves, R., Leitão, P. & Silva, A., 3D modeling in the Sado Estuary using a new generic coordinate approach, Oceanologica Acta, 2001, Nº24, pp.S51-S62.
[3] Pina, P., An integrated approach to study the Tagus estuary water quality, M.Sc.
thesis, Lisbon: I.S.T. Technical University of Lisbon, 2001.
[4] Walker, B.S., Carpenter, J., Anderier, N., Able, N., Cummings, G.S., Janssen, M., Lebel, L., Norberg, G., Peterson, D., & Richards, R., Resilience management in social-ecological systems: a working hypothesis for a participatory approach,


![Figure 5: Model Results for Almargem: a) Velocity fields, b1) Phytoplankton Concentration [mgC/l], b2) Phytoplankton annual transport [Ton/y], c) WWTP discharge in Cabanas Channel, d) WWTP discharge in Almargem Channel](https://thumb-eu.123doks.com/thumbv2/123dok_br/18649096.912355/7.892.179.718.356.772/almargem-velocity-phytoplankton-concentration-phytoplankton-transport-discharge-discharge.webp)