Repositório ISCTE-IUL
Deposited in Repositório ISCTE-IUL:
2019-01-08
Deposited version:
Post-print
Peer-review status of attached file:
Peer-reviewed
Citation for published item:
Loureiro, S. M. C. & Bilro, R. (2018). How can stimuli and emotions help increase brand advocacy. In 21st World Marketing Congress of the Academy of Marketing Science. Porto
Further information on publisher's website:
--Publisher's copyright statement:
This is the peer reviewed version of the following article: Loureiro, S. M. C. & Bilro, R. (2018). How can stimuli and emotions help increase brand advocacy. In 21st World Marketing Congress of the Academy of Marketing Science. Porto. This article may be used for non-commercial purposes in accordance with the Publisher's Terms and Conditions for self-archiving.
Use policy
Creative Commons CC BY 4.0
The full-text may be used and/or reproduced, and given to third parties in any format or medium, without prior permission or charge, for personal research or study, educational, or not-for-profit purposes provided that:
• a full bibliographic reference is made to the original source • a link is made to the metadata record in the Repository • the full-text is not changed in any way
The full-text must not be sold in any format or medium without the formal permission of the copyright holders.
Serviços de Informação e Documentação, Instituto Universitário de Lisboa (ISCTE-IUL) Av. das Forças Armadas, Edifício II, 1649-026 Lisboa Portugal
Phone: +(351) 217 903 024 | e-mail: administrador.repositorio@iscte-iul.pt https://repositorio.iscte-iul.pt
Loureiro, S.M.C. & Bilro, R. (2018). How Can Stimuli and Emotions Help Increase Brand Advocacy. In John B. Ford and Elizabeth Real (Eds). Proceedings of the 21st World Marketing Congress of the Academy of Marketing Science. 27-29 June 2018 at University Lusiada, Porto Portugal.
How Can Stimuli and Emotions Help Increase Brand Advocacy ABSTRACT
The current study aims to explore if Information/Content, Interactive Features, and Design-Visual appeal influences consumers emotional states of Pleasure, Arousal, and Dominance (PDA), leading to brand advocacy as an outcome. Therefore, our goal is to understand which stimuli of experience exercises more effect on the three emotional states (PDA) and which of these three better influence Brand Advocacy.
Data from 183 users of CGM were analysed through structural equation modelling (SmarthPLS2.0) and the findings show that all the aforementioned stimuli influence online PDA. Findings also suggest that all PDA dimensions influence Brand Advocacy.
Keywords: Information/Content, Interactive Features, Design-Visual Appeal, Online Engagement, Brand Advocacy.
INTRODUCTION
In a globalized and competitive world, the brands and firms that holds them seek to find strategies to captivate, retain, and even make their consumers as advocates or brand advocates. In this sense, they try to increase the brand-shift barriers for another brands or firms. This phenomenon occurs both with the brands that have their existence online, as well as offline.
Literature in marketing and management has been proliferating in analysing antecedents of loyalty and brand loyalty, such as customer satisfaction, perceived value, perceived quality. However, there is a gap in the literature regarding background analysis for the propensity for a customer to become a brand advocate.
This study seeks to help bridge this gap by exploring how stimuli and emotions can contribute to enhancing brand advocacy in the online context. Thus, the main aim is to understand which stimuli of the online experience have the most effect on three emotional states (pleasure, arousal, and dominance), as well as these emotional states positively influence consumers to advocate a brand.
THEORETICAL BACKGROUND
To theoretically support our intent, we start from the theoretical model called S-O-R (stimuli-organism-response) framework. This framework has the following underlying assumptions: i) the environmental stimuli experienced through the experiences (in this case online) are internalized by the organisms (the users of the online tools) developing emotions states; ii) emotional states can be categorized into three main ones, pleasure, arousal and the third which also has a cognitive component relating to the sense of capacity and mastery of experience, i.e., the dominance-designated state; iii) the response that is usually translated by intention of behaviour, but that in the present study will be the propensity to advocate the brand (Roschk, Loureiro, & Breitsohl, 2017).
This study considers three online stimuli of experience that can be considered site features that influence client involvement: information/content, interactive features and design/visual appeal. According to Loureiro (2015), there is no standard method for website evaluation, with other authors arguing that "researchers should choose the most appropriate approach to their research goals, target markets and stakeholders" (Law, Qi, & Buhalis, 2010: 310). Therefore, this study adopts the three stimuli mentioned, following Loureiro (2015) and considered suitable for consumer-generated media (CGM) of websites such as Booking.com or TripAdvisor.com. These websites provide consumer-generated content, such as online consumer ratings and reviews, which allow consumers to search and identify hotels, restaurants and attractions that best match their interests, influencing their decisions (Filieri, 2015; Sparks, Perkins, & Buckley, 2013).
METHODOLOGY
The questionnaire was developed based on the literature review and all the items used to measure the constructs are adapted from previous validated scales (Bhattacharya & Sen, 2003; Han & Mills, 2006; Loureiro, 2015; Peloza, 2006). We measure all items using a seven-point Likert scale.
A sample pilot sample of 27 consumers was employed to test the content of the items in terms of writing, meaning, and understanding, and few adjustments were made. The questionnaire also includes a sociodemographic section. We distributed 200 questionnaires between forum members that use booking.com to search, select and book hotel rooms and collected a total of 183 complete and usable answers.
The sample comprise 62% of women, with 9.8% of the participants younger than 25 years old, 33.9% between 25 and 34 years old and 33.2% of the respondents aged between 35 and 44 years. Most of the participants (64.5%) have a college degree.
This sample structure has the general demographic characteristics of consumers using online platforms to book travel and hotels: young people (between twenty’s and thirty’s years-old) and participants with high level of education (Rada, Domínguez-Álvarez, & Dominguez-Alvarez, 2014). In addition, regarding the chosen brand and the demographic profile of the participants, it is important to note that the gender distribution is in accordance with the "Booking.com" physiognomy. In fact, in relation to the general population of the internet, women are over represented on the website "Booking.com" (Booking, 2017).
RESULTS
A structural equation model approach using PLS is used to test the proposed model. The PLS is based on an iterative combination of principal component analysis and regression. It intends to explain the variance of the constructs in the model. In terms of analytical advantages, PLS was considered an effective analytical tool to test interactions reducing Type II errors (Chin, Marcolin, & Newsted, 2003).
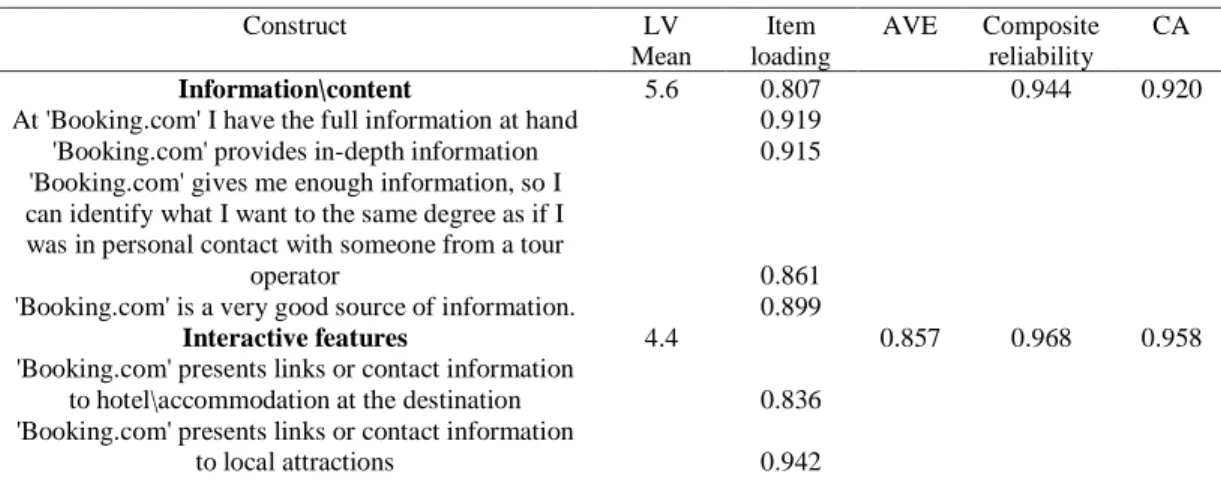
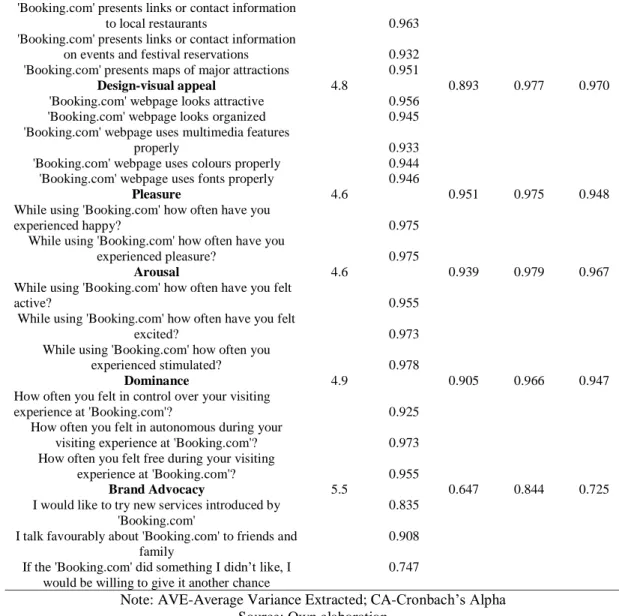
The PLS approach is analysed in two steps: first, the measurement model and then the structural model. In this study, all items show item loading equal to or greater than 0.747 and therefore were accepted. All constructs prove acceptable composite reliability with values above 0.7. The measurements show adequate convergent validity, since the AVE values are higher than 0.5. Finally, the measures also prove discriminant validity through the criterion of Fornell and Larcker (1981) and analysis of the cross-loading matrix (Table 1).
Table 1. Measurement model
Construct LV Mean Item loading AVE Composite reliability CA Information\content 5.6 0.807 0.944 0.920
At 'Booking.com' I have the full information at hand 0.919 'Booking.com' provides in-depth information 0.915 'Booking.com' gives me enough information, so I
can identify what I want to the same degree as if I was in personal contact with someone from a tour
operator 0.861 'Booking.com' is a very good source of information. 0.899
Interactive features 4.4 0.857 0.968 0.958
'Booking.com' presents links or contact information
to hotel\accommodation at the destination 0.836 'Booking.com' presents links or contact information
'Booking.com' presents links or contact information
to local restaurants 0.963 'Booking.com' presents links or contact information
on events and festival reservations 0.932 'Booking.com' presents maps of major attractions 0.951
Design-visual appeal 4.8 0.893 0.977 0.970
'Booking.com' webpage looks attractive 0.956 'Booking.com' webpage looks organized 0.945 'Booking.com' webpage uses multimedia features
properly 0.933 'Booking.com' webpage uses colours properly 0.944 'Booking.com' webpage uses fonts properly 0.946
Pleasure 4.6 0.951 0.975 0.948
While using 'Booking.com' how often have you
experienced happy? 0.975 While using 'Booking.com' how often have you
experienced pleasure? 0.975
Arousal 4.6 0.939 0.979 0.967
While using 'Booking.com' how often have you felt
active? 0.955
While using 'Booking.com' how often have you felt
excited? 0.973 While using 'Booking.com' how often you
experienced stimulated? 0.978
Dominance 4.9 0.905 0.966 0.947
How often you felt in control over your visiting
experience at 'Booking.com'? 0.925 How often you felt in autonomous during your
visiting experience at 'Booking.com'? 0.973 How often you felt free during your visiting
experience at 'Booking.com'? 0.955
Brand Advocacy 5.5 0.647 0.844 0.725
I would like to try new services introduced by 'Booking.com'
0.835 I talk favourably about 'Booking.com' to friends and
family
0.908 If the 'Booking.com' did something I didn’t like, I
would be willing to give it another chance
0.747
Note: AVE-Average Variance Extracted; CA-Cronbach’s Alpha Source: Own elaboration
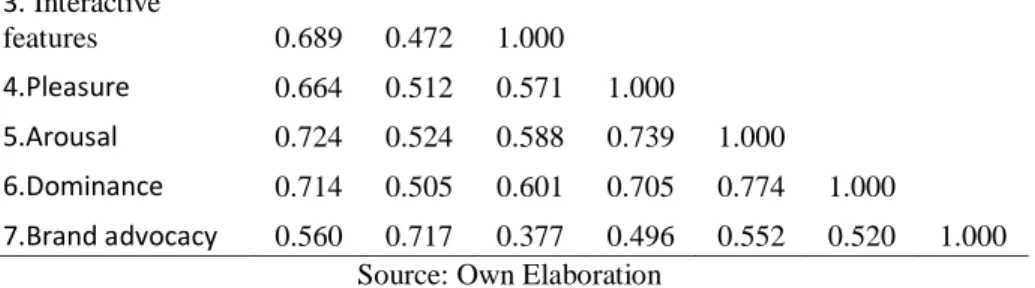
Regarding discriminant validity was used the criterion suggested by Fornell and Larcker (1981), which argue that the square root of AVE should be higher than the correlation between the two constructs in the model. In this research, all latent variables met that criterion, demonstrating discriminant validity (Table 2). The second criterion for discriminant validity is that no item should load more highly on another construct than it does on the construct it intends to measure. If we examine the matrix loadings and cross-loadings (gathered from PLS software) it reveals that all items passed the second criterion for discriminant validity (Table 2).
Table 2. Discriminant Validity
1. 2. 3. 4. 5. 6. 7. AVE1/2 0.945 0.898 0.925 0.975 0.969 0.951 0.801 1. Design-visual appeal 1.000 2. Information\content 0.566 1.000
3. Interactive features 0.689 0.472 1.000 4.Pleasure 0.664 0.512 0.571 1.000 5.Arousal 0.724 0.524 0.588 0.739 1.000 6.Dominance 0.714 0.505 0.601 0.705 0.774 1.000 7.Brand advocacy 0.560 0.717 0.377 0.496 0.552 0.520 1.000 Source: Own Elaboration
This study employed a nonparametric approach known as Bootstrap to estimate the path coefficients. All path coefficients are considered significant at significance levels of 0.001, 0.01 or 0.05. The predictive validity measures R2 and Q2 were also analysed. All values of Q2 are positive, so that the relationships in the model have predictive relevance. The model also shows a good level of predictive power (R2), since the modelled constructs explain 33.4% of the variance in brand advocacy, 48.6% of the variance in pleasure, 55.5% of the variance in arousal and 54.3% % of the variance in dominance (Table 3).
Table 3. Structural results
Path Standardized coefficient direct effect Standard Error t-value Test-result
Information\content → Pleasure 0.178*** 0.039 4.555 H1a: supported H1: fully supported Information\content → Arousal 0.151*** 0.036 4.149 H1b: supported
Information\content → Dominance 0.125** 0.045 2.788 H1c: supported
Interactive features→ Pleasure 0.188*** 0.048 3.953 H2a: supported H2: fully supported Interactive features→ Arousal 0.147** 0.050 2.947 H2b: supported
Interactive features→ Dominance 0.189*** 0.046 4.087 H2c: supported
Design-visual appeal→ Pleasure 0.434*** 0.051 8.471 H3a: supported H3: fully supported Design-visual appeal→ Arousal 0.538*** 0.054 10.044 H3b: supported
Design-visual appeal→ Dominance 0.514*** 0.052 9.939 H3c: supported Pleasure → Brand advocacy 0.140** 0.052 2.702 H4: supported Arousal → Brand advocacy 0.306*** 0.092 3.340 H5: supported Dominance → Brand advocacy 0.185* 0.094 1.967 H6: supported
R2 Pleasure 0.486 Q2 Pleasure 0.299
R2 Arousal 0.555 Q2 Arousal 0.513 GoF=0.641 R2 Dominance 0.543 Q2 Dominance 0.490
R2 Brand advocacy 0.334 Q2 Brand advocacy 0.200 Note: ns-not significant; *p<0.05; **p<0.01; ***p<0.001
Source: Own elaboration
The analysis of the mediating effect of pleasure, activation and dominance between stimuli and brand advocacy reveals that: i) pleasure (VAF-variance accounted for = 12.2%), arousal (VAF = 17.4%) and dominance = 19.9%) do not have a mediating effect on the relation information/content → brand advocacy; ii) pleasure (VAF = 63.1%) and arousal (VAF = 79.0%) partially mediate the relation between interactive features → brand advocacy, but dominance does
not (VAF = 7.4%); iii) pleasure (VAF = 26.0%), arousal (VAF = 28.3%), and dominance (VAF = 31.2%) partially mediate the relation between design/visual appeal → brand advocacy.
CONCLUSIONS AND IMPLICATIONS
The results allow us to conclude, once again, the relevance of this PLS approach in applications of an exploratory research in marketing and management. Although the model has a good validity, we realize that online atmospheric stimuli have a more effective power in explaining emotional states than in the variability of brand advocacy. Emotional states did not fully mediate the established relationships between stimuli and brand advocacy. Although other studies are needed to understand this phenomenon, this was a first attempt to understand how the S-O-R framework could be extended to incorporate the construct of brand advocacy.
The sensation of pleasure and arousal felt by consumers when using booking.com are effective to enhance the willingness to advocate in favour of the brand. Although statistically significant, the more cognitive component of PDA seems to be less effective in influencing users to try new services and to forgive if something goes wrong (brand advocacy).
The findings allow us to suggest that mangers of this kind of websites to be more creative in the services they provide. They should be emotional appealing to captivate users and lead them to advocate positively and forgive. An appropriate gamification incorporation could help in such process.
Finally, the study support once more the S-O-R model (Roschk et al., 2017). The dimensions of website quality (Loureiro, 2015) also demonstrate to be appropriate to the current situation. In future, we suggest test other emotions and analyse how them could or not enhance brand advocacy. We may regard emotions such as: delight, fear, or angry.
REFERENCES
Bhattacharya, C. B., & Sen, S. (2003). Consumer-Company Identification: A Framework for Understanding Consumers’ Relationships with Companies. Journal of Marketing, 67(2), 76–88. https://doi.org/10.1509/jmkg.67.2.76.18609
Chin, W. W., Marcolin, B. L., & Newsted, P. R. (2003). A partial least squares latent variable modeling approach for measuring interaction effects: Results from a Monte Carlo simulation study and an electronic-mail emotion/adoption study. Information Systems Research, 14(2), 189– 217. https://doi.org/DOI 10.1287/isre.14.2.189.16018
Filieri, R. (2015). What makes online reviews helpful? A diagnosticity-adoption framework to explain informational and normative influences in e-WOM. Journal of Business Research, 68(6), 1261–1270. https://doi.org/10.1016/j.jbusres.2014.11.006
Fornell, C., & Larcker, D. F. (1981). Evaluation Structural Equation Models with Unobservable Variables and Measurement Error. Journal of Marketing Research, 18(1), 39–50. https://doi.org/10.2307/3151312
Han, J.-H., & Mills, J. E. (2006). Zero acquaintance benchmarking at travel destination websites: what is the first impression that national tourism organizations try to make? International Journal of Tourism Research, 8(6), 405–430. https://doi.org/10.1002/jtr.581
Law, R., Qi, S., & Buhalis, D. (2010). Progress in tourism management: A review of website
evaluation in tourism research. Tourism Management.
https://doi.org/10.1016/j.tourman.2009.11.007
Loureiro, S. M. C. (2015). The Role of Website Quality on PAD, Attitude and Intentions to Visit and Recommend Island Destination. International Journal of Tourism Research, 17(6), 545–554. https://doi.org/10.1002/jtr.2022
Peloza, J. (2006). Using Corporate Social Responsibility as Insurance for Financial Performance. California Management Review, 48(2), 52–73. https://doi.org/10.2307/41166338
Rada, V. D. de, & Dominguez-Alvarez, J. A. (2014). Response quality of self-administered questionnaires: A comparison between paper and web questionnaires. Social Science Computer Review, 32(2), 256–269. https://doi.org/10.1177/0894439313508516
Roschk, H., Loureiro, S. M. C., & Breitsohl, J. (2017). Calibrating 30 Years of Experimental Research : A Meta-Analysis of the Atmospheric Effects of Music , Scent , and Color. Journal of Retailing, 93(2), 228–240. https://doi.org/10.1016/j.jretai.2016.10.001
Sparks, B. A., Perkins, H. E., & Buckley, R. (2013). Online travel reviews as persuasive communication: The effects of content type, source, and certification logos on consumer behavior. Tourism Management, 39, 1–9. https://doi.org/10.1016/j.tourman.2013.03.007