UNIVERSIDADE DO ALGARVE
Faculdade de Ciências e Tecnologia
Development of a new method for the detection of
vanadium complexes bound to DNA, using Agarose
Gel Electrophoresis
Prabal Subedi
Mestrado em Qualidade em Análises
(European Master in Quality in Analytical Laboratories)
UNIVERSIDADE DO ALGARVE
Faculdade de Ciências e Tecnologia
Development of a new method for the detection of
vanadium complexes bound to DNA, using Agarose
Gel Electrophoresis
Prabal Subedi
Mestrado em Qualidade em Análises
(European Master in Quality in Analytical Laboratories)
2012
Acknowledgements
First of all, I would like to thank The EMQAL program and European Commission for my selection in the program. I am very thankful for my professor, Dr. Isabel Cavaco who has been very supportive during my stay here. I would also like to thank Nataliya Butenko for guiding me throughout my stay and making the lab environment very enjoyable. I am thankful to Dr. Jorge Martins and Miguel Manuel for helping me use the equipments. My sincere gratitude goes to the International Mobility office for helping me with finding accommodation and taking care of my other bureaucratic problems. My thanks also go to Dr. Helio and his team for helping me with the instruments that I needed to use during my stay. I would like to express my gratitude for Cláudia Albaça and Débora Mendes for the translation of my abstract in Portuguese.
Table of Contents
LIST OF FIGURES. ... 1
LIST OF TABLES ... 2
LIST OF ABBREVIATIONS AND TERMINOLOGY ... 3
RESUMO ... 4
ABSTRACT ... 6
1. INTRODUCTION ... 8
1.1. DNA-a brief overview ... 8
1.2. Cleavage of DNA ... 9 1.2.1. Hydrolytic cleavage ... 9 1.2.2. Oxidative Cleavage... 11 1.3. Inorganic Nucleases ... 12 1.3.1. Vanadium Nucleases ... 13 1.3.2. Ruthenium Nucleases ... 14
1.4. Analytical methods for the study of inorganic nucleases ... 16
1.5. Aim of the project ... 19
1.6. Chemistry of the method ... 20
1.6.1. Fenton Reaction ... 20
1.6.2. TPA(terephthalic acid) Hydroxylation ... 21
1.7. Techniques used. ... 23
1.7.1. Agarose Gel Electrophoresis (AGE) ... 23
1.7.2. Absorption Spectrometry ... 25
1.7.3. Fluorescence Spectroscopy... 26
1.8. Method validation parameters ... 28
1.8.1. LOD (limit of detection) ... 28
1.8.2. Sensitivity ... 28
1.8.4. Estimation of errors ... 29
2. EXPERIMENTAL SECTION ... 30
2.1. Instruments ... 30
2.2. Preparation of solutions ... 30
2.2.1. Phosphate buffer: ... 30
2.2.2. TPA(Terephthalic acid) solution ... 30
2.2.3. Concentrated TBE solution ... 30
2.2.4. Water ... 30
2.2.5. Vanadium complexes solution ... 31
2.2.6. Hydrogen Peroxide ... 31
2.3. Spectrofluorimetric measurements ... 31
2.3.1. Preparation of solutions ... 31
2.3.2. Fluorescence measurement ... 32
2.4. Agarose gel preparation. ... 33
2.4.1. Agarose Gel Electrophoresis ... 33
2.4.2. Agarose gels for testing the Fenton-like reaction coupling with TPA hydroxylation. ... 34
2.4.3. Agarose gels in cuvette ... 35
3. RESULTS AND DISCUSSION ... 36
3.1. Agarose gel electrophoresis ... 36
3.2. Preliminary tests in agarose gel. ... 36
3.3. TPA-hydroxylation coupled with Fenton-like reactions ... 37
3.3.1. Method development in aqueous solutions. ... 37
3.3.2. With D-galactose ... 43
3.4. Fluorescence in agarose gels ... 48
3.4.1. Boiling and dissolving agarose only with TPA ... 48
3.5. Stability of Hydrogen Peroxide ... 50
3.6. Choice of excitation wavelength ... 50
4. CONCLUSIONS ... 51
4.1. Aqueous system ... 51
4.2. Aqueous system containing galactose ... 51
4.3. Agarose gels ... 51
4.4. Overall ... 51
5. BIBLIOGRAPHY ... 52
1
List of Figures.
Figure 1. A monomer of the DNA molecule. ... 8
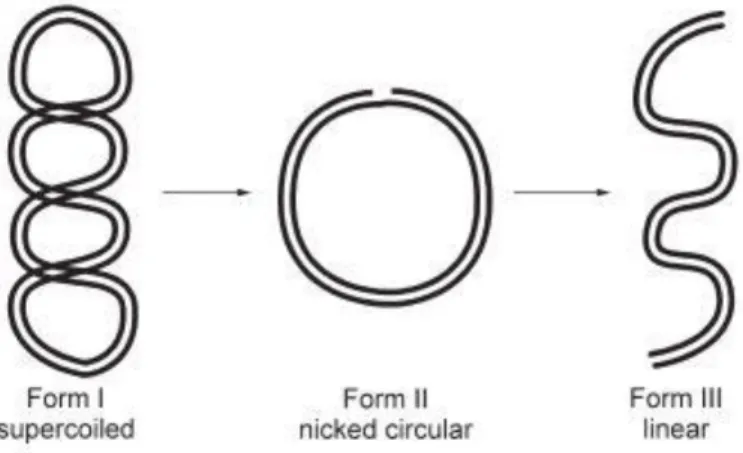
Figure 2. Three forms of plasmid DNA- supercoiled (Form I), nicked (Form II) circular and linear(Form III)3 ... 9
Figure 3. Mechanism of hydrolytic cleavage3 ... 10
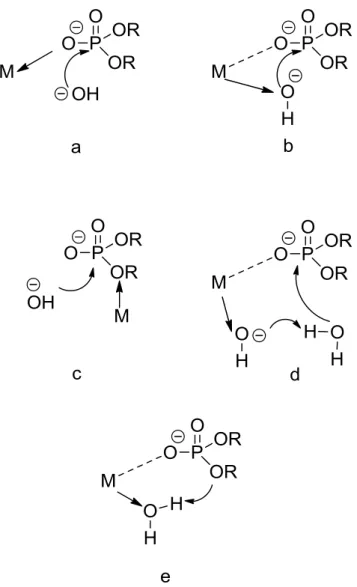
Figure 4. Different proposed activation modes for hydrolysis of phospodiester bonds: (a) lewis acid activation, (b) nucleophile activation, (c) leaving group activation, (d) metal coordinated hydroxides and (e) metal coordinated water molecule. (M denotes metal complex) ... 11
Figure 5. Mechanism of oxidative cleavage. ... 12
Figure 6. Vanadium compounds BMOV, BEOV and VO(acac)2. ... 14
Figure 7. Ruthenium complexes KP1019 and NAMI-A. ... 15
Figure 8. AGE(3h, 110 V) of DNA samples inclubated with VO(acac)2 and VO(Clor) for 1h at 370C ... 18
Figure 9. TPA hydoxylation. ... 22
Figure 10. Fenton-like reaction coupled with TPA-hydroxylation. ... 23
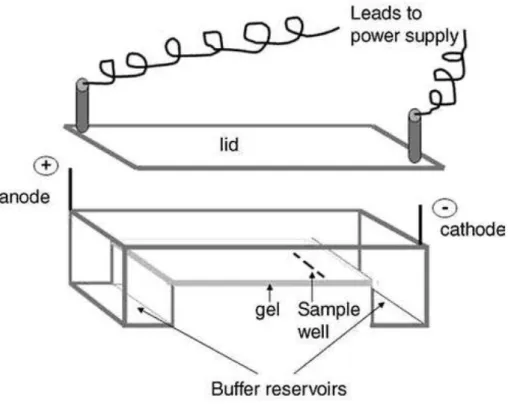
Figure 11. Instrumental set-up for AGE ... 24
Figure 12. Light passing through a cuvette ... 25
Figure 13. Schematic diagram of a spectrophotometer57 ... 26
Figure 14. Jablonski Diagram illustrating the absorption and the emission processes. . 27
Figure 15. Schematic diagram of a spectrofluorometer60. ... 28
Figure 16. Procedure of spectrofluorimetric measurement ... 32
Figure 17. The position of samples of vanadium in 1% agarose gel containing 200 µM TPA. ... 34
Figure 18. Gel imaging of experiment from Figure 17 before addition of H2O2 (left) and after addition of H2O2 (right). [Excitation at 302 nm and filter at (595 ± 40) nm] . 36 Figure 19. Time evolution of maximum intensity (410 nm) of 2-OH-TPA generated from different concentrations of VOSO4 over time. H2O2conc = (~9M) ... 37
Figure 20. Time evolution of maximum intensity (410 nm) of 2-OH-TPA generated from different concentrations of VO(acac)2 over time. H2O2conc = (~9M) ... 38
2
Figure 21. Fluorescence spectra measurements for 80µM VO(acac)2 over time.
H2O2conc = ~9M ... 39
Figure 22. Figure showing the different positions in the benzene ring where
hydroxylation can take place when large excess of .OH radicals are present. ... 39
Figure 23. Time evolution of maximum intensity (428 nm) of 2-OH-TPA generated
from concentrations of VO(acac)4 over time. H2O2conc = 1,8M ... 40
Figure 24.Individual fluorescence spectrum measurements ... 41 Figure 25. Maximum intensity (428nm) of 2-OH-TPA with different concentrations of
VO(acac)2 over time. H2O2conc = 1,8 mM ... 42
Figure 26.Individual fluorescence spectrum measurements for different concentrations
of VO(acac)2 in presence of 0,050% D-galactose. H2O2conc =1,8 mM ... 44
Figure 27. Maximum intensity (428nm) of 2-OH-TPA generated from different
concentrations of VO(acac)2 over time. H2O2conc = 1,8 mM, galactose= 0,050%... 45
Figure 28. Maximum intensity (428nm) of 2-OH-TPA generated from different
concentrations of VO(acac)2 over time. H2O2conc = 1,9 mM, galactose= 0,50%... 46
Figure 29. Maximum intensity (428nm) of 2-OH-TPA generated from different
concentrations of VOSO4 over time. H2O2conc = 1,8 mM, galactose= 0,50%. ... 46
Figure 30. Maximum intensity (428nm) of 2-OH-TPA generated from different
concentrations of VO(acac)2 over time. H2O2conc = 1,9 mM, galactose= 0,50%... 47
Figure 31. Fluorescence spectra measurement of 1% agarose gels containing 200µM TPA and 1,8 mM H2O2. ... 49
Figure 32. Absorbance of hydrogen peroxide over time. ... 50
List of tables
Table 1. Parameters to study the sensitivity at different time intervals for TPA
hydroxylation coupled to Fenton-like reactions.The errors are presented with 95% confidence intervals ... 43
Table 2. A comparison (at 5 min) between the sensitivities when different wt% of
3
List of abbreviations and terminology
Abbreviations Meaning
µio absolute electrophoretic mobility AFM atomic force microscopy
AGE agarose gel electrophoresis. b y-intercpet
BEOV bis(ethylmaltolato)oxovanadium(IV)
BMOV bis(maltolato)oxovanadium(IV) CE capillary electrophoresis DNA deoxyribonucleic acid EtBr ethidium bromide
Fd frictional force
Fe electrical force
k constant
LOD limit of detection m slope
PAGE polyacrylamide gel electrophoresis ROS reactive oxygen species
Salen salicylaldehyde and ethylenediamine sd standard deviation
TPA terephthalic acid
vio velocity of particle η fluid viscosity
4
Resumo
Existem apenas alguns métodos disponíveis para o estudo da ligação de metais ao ADN. Estes são baseados em técnicas espectroscópicas, que podem apenas ser utilizadas quando determinados cromóforos quer da molécula de ADN ou dos complexos metálicos estão directamente envolvidos na ligação de metais ao ADN.
O objectivo deste projecto foi desenvolver um novo método que pode ser utilizado para detectar a ligação de um metal de transição ao ADN, utilizando Electroforese em gel de agarose (EGA). O método tem sido estudado para complexos de vanádio, mas pode ser adaptado para quaisquer metais de transição susceptíveis de sofrer reacções de tipo Fenton. O novo método envolve a adição ao gel de agarose de ácido tereftálico (TPA), um indicador bem conhecido para os radicais hidroxilo. Embebendo o gel desenvolvido em peróxido de hidrogénio, a presença de vanádio será revelada por uma reacção do tipo Fenton que irá gerar radicais hidroxilo e irá hidroxilar TPA em 2-hidroxi-TPA, uma molécula altamente fluorescente. Bandas electroforéticas contendo vanádio podem então ser fotografadas e analisadas utilizando um sistema de imagem.
A metodologia envolveu quatro passos:
1. Um estudo preliminar do sistema utilizando a EGA.
2. O desenvolvimento do método para a quantificação dos complexos de vanádio baseado no mesmo sistema de reacção utilizando amostras aquosas.
3. Desenvolvimento do método em soluções aquosas com uma matriz semelhante à de agarose.
4. Aplicação em géis de agarose.
Os resultados preliminares foram mal sucedidos para detectar a presença de vanádio em géis de agarose. Concluiu-se que para ser usado um sistema de imagem, o método requer a utilização de um filtro (464 ± 40) nm. Foram efectuados mais testes utilizando um espectrofluorímetro.
Quando se utilizou um concentrado peroxide (~ 9M), a intensidade máxima de fluorescência de 2-OH-TPA formado diminuiu ao longo do tempo. Com um peróxido
5
menos concentrado (1,8 mM) foi obtida uma boa sensibilidade. O LOD (limite de detecção) determinado para o vanádio foi de 4,1 µM.
O sistema foi depois testado num sistema aquoso com galactose. O sistema tem uma boa gama de trabalho, até 300 µM na presença de 0,50% de galactose. A sensibilidade diminuiu significativamente na presença de galactose. O LOD determinado para o vanádio foi de 5,4 µM.
O sistema foi finalmente testado em géis de agarose. Houve alguma dificuldade em assegurar a homogeneidade da preparação, necessária para um estudo espectrofluorimétrico. Num gel onde a homogeneidade foi conseguida, foi observada uma banda de emissão muito fraca na região do espectro onde o complexo 2-hidroxi-TPA emite. A sensibilidade obtida nesta preparação foi muito baixa.
Não foi possível completar os testes em EGA devido à falta de tempo disponível para este trabalho. No entanto, os resultados em solução aquosa mostram que o método é viável e pode proporcionar uma boa sensibilidade quando aplicado em matrizes EGA, desde que o método para a preparação de gel seja optimizado.
Palavras-chave: nucleases de vanádio, eletroforese em gel de agarose, espectrofluorimetria, desenvolvimento do método, interacção metal-ADN.
6
Abstract
There are few methods available for the study of the binding of metals to DNA. These are based in spectroscopic techniques which can only be used when certain chromophores, either from the DNA molecule or from the metal complexes, are directly involved into the binding of metals to DNA.
The objective of this project has been to develop a new method that can be used to detect the binding of a transition metal to DNA using Agarose Gel Electrophoresis. The method has been studied for vanadium complexes, but can be adapted to any transition metals that can undergo Fenton-like reactions. The new method involves the addition to the agarose gel of terephthalic acid (TPA), a well-know indicator for hydroxyl radicals. By soaking a developed gel in hydrogen peroxide, the presence of vanadium will be revealed by a Fenton-like reaction that will generate hydroxyl radicals and will hydroxylate TPA into 2-hydroxy-TPA, a strongly fluorescent molecule. Electrophoretic bands containing vanadium can then be photographed and analysed using an imaging system.
The methodology followed four steps:
1. A preliminary study of the system using AGE.
2. The development of the method for the quantification of vanadium complexes based on the same reaction system using aqueous samples.
3. Development of the method in aqueous solutions with a matrix as similar as possible to agarose.
4. Application in agarose gels.
Preliminary results were unsuccessful in detecting the presence of vanadium in agarose gels. It was concluded that to be used in an imaging system the method would require the use of a (464 ± 40) nm filter. Further testing was done using a spectrofluorimeter. When concentrated peroxide (~9 M) was used, the maximum fluorescence intensity of 2-OH-TPA formed decreased over time. With a less concentrated peroxide (1,8 mM), a good sensitivity was obtained. The LOD (limit of detection) for vanadium was determined to be 4,1 µM.
7
The system was then tested in aquous system with galactose. The system has a good working range for upto 300 µM when of 0,50% galactose was present. The sensitivity decreased significantly in the presence of galactose. The LOD for vanadium was established to be 5,4 µM.
The system was finally tested in agarose gels. There were major issues in assuring the homogeneity of the preparation, necessary for a spectrofluorimetric study. In one gel where homogeneity was achieved, a very weak emission band was observed in the spectral region where 2-hydroxy-TPA emits. The sensitivity obtained in this preparation is very low.
It was not possible to complete the tests in AGE because of time impediments for this work. Nevertheless, the results in aqueous solution show that the method is viable and should provide a good sensitivity when applied in AGE matrices, provided the method for the preparation of gel is optimized.
Key Words: vanadium nucleases, agarose gel electrophoresis, spectrofluorometry, method development, metal-DNA interaction.
8
1. INTRODUCTION
1.1. DNA-a brief overview
DNA (Deoxyribonucleic acid) (Figure 1) is a polymer of nucleic acid containing the genetic information for living organisms. It has a deoxyribose sugar and a nitrogen base (purine: adenine and guanine; pyrimidine: thymine and cytosine). The individual units are joined together by strong phosphodiester bonds from the 3‟of one unit to 5‟ of another unit. In DNA, the stands run antiparallel to each other and hydrogen bonding between the nitrogen bases provides the stability between the two strands. The phosphodiester bonds in the DNA have a half life (t1/2) of 130,000 years at neutral
solution and at room temperature1. Any possible nucleophile is repelled by the negative charges in the sugar phosphate backbone2 and therefore the DNA is very stable molecule.
Figure 1. A monomer of the DNA molecule.
DNA is a stable molecule and it creates a serious obstacle in DNA manipulation, namely, expression and duplication, repair of damaged DNA and elimination of foreign DNA. To overcome this obstacle, nature has come up with hydrolytic enzymes, topoisomerases and nucleases that catalyze the scission of DNA3. These enzymes contain certain metal ions such as Ca(II)3 Mg(II)4 and Zn(II)5 as cofactors and they play a very important part in the catalytic action.
DNA can be further classified into genomic DNA (present in all living organisms) and plasmid DNA (found mostly in bacterias, or mitochondria/chloroplasts in higher organisms). In most biological systems, plasmid DNA is present as supercoiled form (Form I)(Figure 2). This form is important for gene expression, DNA replication and
9
recombination. If there is a nicking in one of the strands, it will result in loss of supercoils and the DNA will be in nicked form (Form II), or also called open circular form. If there is a nicking in both the strands at the (nearly) same points, the DNA will arrange itself into a linear form (Form III)6.
Figure 2. Three forms of plasmid DNA- supercoiled (Form I), nicked (Form II) circular
and linear(Form III)3
1.2. Cleavage of DNA
Since the nature uses many metallic ions for the interactions with biological molecules7, the humankind has attempted to reproduce those biological activities with artificial compounds. The results include the synthesis of many inorganic complexes that have shown promising results in the medicinal field. The cleavage of DNA is no exception. DNA cleavage can be achieved by inorganic complexes and these complexes are called
inorganic nucleases8. The cleavage in DNA takes place mainly by two possible mechanisms- hydrolytic and oxidative cleavage.
1.2.1. Hydrolytic cleavage
An interest in hydrolytic cleavage comes from the fact that the mechanistic information obtained from such studies would help better understanding of hydrolytic enzymes. Also, the hydrolytic agents could be used to detoxify pesticides and chemical agents, as the pesticides and chemical agents often contain phosphate-ester like structures3. Since reported by J.K. Barton9 in 1987 the first artificial hydrolytic agent, much interest is present in the scientific world for these complexes. Hydrolysis by natural nucleases is assumed to proceed via a 5 coordinated transition state10 and furthermore cleavage on P-O3‟ produces the breakdown products.
10
Figure 3 shows the mechanism for hydrolytic cleavage.
Figure 3. Mechanism of hydrolytic cleavage3
Metal ions and their complexes help facilitate faster reactions. There are various activation modes by which the metal ions could facilitate the hydrolysis of phosphate diesters. The different proposed modes (Figure 4) are lewis acid activation, nucleophile activation, leaving group activation, metal coordinated hydroxides and metal coordinated water molecule 2, 3,11. When metals with redox chemistry are employed, another form of cleavage-oxidative cleavage could also take place3.
11
Figure 4. Different proposed activation modes for hydrolysis of phospodiester bonds:
(a) lewis acid activation, (b) nucleophile activation, (c) leaving group activation, (d) metal coordinated hydroxides and (e) metal coordinated water molecule. (M denotes
metal complex)
1.2.2. Oxidative Cleavage
Cu(II) and Fe(III) have been known to cleave DNA in an oxidative way. Also reported are transitional metal complexes in the presence of oxidants/reductants or without external agents12. The cleavage can occur either in the nitrogenous base or in the ribose sugar. The agents responsible are called reactive oxygen species (ROS) which include superoxide and hydroxyl radicals, single oxygen and high valence metal oxo species13. Since, there are 4 nitrogenous bases and different ROS and the fact that the oxidation could occur either in the base or in the sugar ring, various mechanisms of oxidations are possible. One such oxidative mechanism by FeIIBleomycin14,15 is given in Figure 5.
12
Figure 5. Mechanism of oxidative cleavage.
1.3. Inorganic Nucleases
Although the field of medicinal chemistry has been largely dominated by organic chemistry, the advancement in research of metal based drugs has grown over the past years7. Platinum compounds were one of the first metal based complexes to be used as antitumor agents16. Numerous others inorganic complexes have been discovered to have medical applications.
Among the applications, gene manipulation has been a hot topic. Certain metal complexes have shown promising results as DNA probes17, DNA targeting antitumor agents18 and in nucleic acid mapping19. En route towards gene manipulation, synthetic nucleases have attracted much attention with regards to their applications. The nucleases will not only be able to reveal the restriction enzyme mechanism but also as
13
conformational probes for DNA structure, antibiotic and chemotherapeutic drugs. In fact, they might even be more efficient cleavers of DNA than natural enzymes20. Among the metals that mediate DNA oxidation, transitional metal complexes of Fe, Cu, Ni, Pt, Ru, Rh, V, Cr, Co, Mn and Os have been reported12. Some of them are explained below.
1.3.1. Vanadium Nucleases
Although vanadium exists in III, IV or V oxidation states in aqueous media21, the oxidation state of vanadium in the biological system is debatable. While some argue that there is interconversion of V(IV) and V(V) species in the blood22, others state that regardless of the species injected, the fate of vanadium in the biological system ends up with V(IV)23. Also, the exact mechanism of how vanadium cleaves DNA is unknown. Vanadium complexes, already known for their insulin mimetic activity24, were first reported in 1996 for their nuclease activity25. The complexes that have proven to reduce the plasma glucose levels in streptozotocin-induced diabetic rats are bis(maltolato)oxovanadium(IV) (BMOV) and bis(ethylmaltolato)oxovanadium (IV) (BEOV)26 (Figure 6). BEOV has passed clinical trials phase I and phase II7. Other orally active compounds that have been studied as treatment for diabetes contain the oxidation state vanadium (IV) 24.
Vanadium(IV) compounds of salen(salicylaldehyde and ethylenediamine) derivatives cleaved DNA at guanine residues in presence of oxone. Proposed mechanisms included the formation of oxidation of V(IV) to V(V) and the production of SO4-• and SO5-•
radicals27. Similarly, some oxovanadium (IV) schiff base complexes have demonstrated nuclease activity in UV-A light of 365 nm via the 1O2 pathway and via OH• pathway in
presence of near-IR light(752.5-799.3 nm IR optics)28.
Although most studies are done with vanadium(IV) complexes, there are a handful of reports on vanadium(III) and vanadium(V) nucleases. Bis(peroxo)vanadium(V) phenanthroline promotes a single strand DNA cleavage. During photooxidation of peroxo ligands, OH• are produced and this leads to the strand cleavage29
. Vanadium(III) phenthroline and bipyridine dimers were found to have very strong interaction with DNA that ultimately led to the degradation of DNA30.
14
Figure 6. Vanadium compounds BMOV, BEOV and VO(acac)2.
Another compound, VOIV(acac)2 (Figure 6) that has been known for insulin enhancing
activity24, has also shown promising results in DNA cleavage. VO(acac)2 , above 1 µm
has been reported as a very efficient cleavage agent. Moreover, it requires no activating agents such as air or irradiation. However, the use of buffer plays an important role for this compounnd8.
1.3.2. Ruthenium Nucleases
Ruthenium complexes have been a part of research interest over the past few years. Ruthenium complexes are one of the very few metal complexes to be studied as anti-cancer drugs. Two important complexes are KP109 and A (Figure 7). NAMI-A possesses high and selective anti-metastatic activity and has passed Phase I clinical trials (the first ruthenium antitumor complex to enter the trials)31 but has failed the screening for antitumor drugs32. KP1019 demonstrates antineoplastic activity against a wide number of tumors33.
15
Figure 7. Ruthenium complexes KP1019 and NAMI-A.
The targets of Ruthenium based complexes are still arguable7. NAMI-A and KP1019 can irreversibly coordinate with DNA32,34. Nevertheless, Plasma proteins and glutathione are believed to be more essential than DNA for the antitumor activities for NAMI-A and KP101932. Ru-arene complexes can interact with DNA via direct coordination to the bases, intercalation and stereospecific H-bonding35. Ruthenium(III) complexes with ligands phenanthroline, bipyridine, dipyridoquinoxaline and dipyridophenazine were found to bind to DNA in a non-covalent way before cleaving them36.
Similarly, ruthenium(II) polypyridyl complex was found to hydrolytically cleave DNA in a enzyme-like manner37. A Ru(II) dimer was found to cleave DNA under anerobic conditions after undergoing an in situ reduction. When exposed to air, together with large amount of reducing agents, the cleavage activity was diminished. This could provide a means of selective cleavage activity for cells with low oxygen content38. Ruthenium(II) nitrofurylsemicarbazone complexes were revealed to affect the DNA conformation and also cleave it via oxidative mechanism. It was believed that the compound interacts with the minor groove in DNA39.
However, ruthenium nucleases are relatively “new” in the field of inorganic nucleases and an in depth study is required for these complexes.
16
1.4. Analytical methods for the study of inorganic nucleases
Inorganic nucleases can be even more effective than natural nucleases and also cheaper. Therefore, there is a bright future in the field of inorganic complexes as DNA cleavers. To study the interactions of metal complexes many analytical methods have been used. Spectrometric techniques such as UV/VIS absorption spectroscopy, CD (circular dichroism) fluorescence spectroscopy, electro-analytical techniques such as voltametric techniques, imaging techniques such as AFM(atomic force microscopy) are widely used to study the interaction of the metal/metal complexes with DNA.
Separation techniques such as capillary electrophoresis (CE) and gel electrophoresis – agarose gel electrophoresis (AGE) and polyacrylamide gel electrophoresis (PAGE) are used for studies of DNA. Electrophoresis is a technique where the molecules are separated by their charge and their size. The charged molecules are placed in an electric field. The particles are accelerated by the electrical force, Fe :
Eq. 1
Where,
Zi = charge of the particle/component I
e = elementary charge (1,602 × 10-19 C)
E = electric field strength (V.cm-1)
However, when the particles are accelerated, there is a frictional force (Fd) present
which slows the movement. Considering that the moving particles are spherical, Fd is
given as Eq. 2 Where, η = fluid viscosity (Pa•s) k = constant (cm) vio = velocity of particle (cm•s-1)
17
For a spherical particle, according to the Stokes‟ law, k is given as,
Eq. 3
Where,
ri = radius of the component/sphere
So, when an electrical field is established, the electrical force is balanced by the frictional force, and therefore, the particle moves at a terminal velocity vio
Eq. 4
Eq. 5
Eq. 6
The terminal velocity, vio, is proportional to the electrical field E and the proportionality
constant is called the absolute electrophoretic mobility, µio (cm2V-1s-1) or
Eq. 7
For large molecules such as DNA, the mobility also depends upon on the shape of the molecule.
There are different kind of electrophoresis types including but not limited to capillary electrophoresis, isotachophoresis and gel electrophoresis. Gel electrophoresis is relatively easy to carry out and is often a widely used technique for the study of DNA and its interaction with metal complexes.
At neutral pH, the DNA is negatively charged. Therefore, when an electric field is applied, the molecules migrate towards the positive pole. The migration occurs through the gel matrix. Gel matrices consist of pores and these pores sieve the DNA molecules according to its volume. The smaller molecules pass easily as they have a lesser effective volume than the bigger ones. The visualization of DNA is done by staining by fluorescent dyes such as ethidium bromide (EtBr). EtBr has planar rings and it intercalates between the stacked bases in the nucleotide. When exposed to ultraviolet
18
light, this intercalation increases intensely the fluorescence of EtBr and thus the DNA can be visualized.
The gel matrices that are used are polyacrylamide and agarose. Agarose is a linear polymer of agarobiose. Agarobiose is a disaccharide made up of D-galactose and 3,6-anhydro-L-galactopyranose40. Polyacrylamide is a cross linked polymer of acrylamide. Polyacrylamide has smaller pores and a high resolving capacity but only over a narrow size range (eg. a few base pairs). However, during cleavage of DNA, the new fragments could differ to each other by hundreds of base pairs and therefore agarose gels provide a better resolution. A nicked or a circular DNA moves more slowly than a supercoiled DNA which is compact and has a small effective volume, thus helping them to migrate more rapidly during electrophoresis41.
One such electrophoresis (AGE) sof plasmid DNA after incubation with vanadium complexes (details in the experimental section) is shown in Figure 8.
Figure 8. AGE(3h, 110 V) of DNA samples inclubated with VO(acac)2 and VO(Clor)
19
It can be observed that there are mainly 3 main bands- of supercoiled (Sc), linear (Lin) and nicked (Nck). The extremes (1 and 14) wells contained non-incubated plasmid DNA and wells (2 and 13) contained linearised DNA.
1.5. Aim of the project
When performing AGE of plasmid DNA digested with vanadium nucleases, a number of unexplained weak bands are often observed. These can be viewed in Figure 8: band A1, A2, A3 and B1. These bands have been named „Phantom bands‟ and will be referred as same in the rest of the manuscript. Some characteristics of these bands are-
a. These bands were present in samples that contained vanadium complexes but not in the native DNA sample (1 and 14 wells). This indicates the effect is provided by incubation with the vanadium complexes.
b. The bands increased in intensity with the increase in concentration of the vanadium complexes.
c. These bands always appear at the same place in the gel.
There have been a few possible explanations thought of for these bands. The DNA molecules in bands A1, A2 and A3 have a lower electrophoretic mobility than the 3 plasmid DNA bands (supercoiled, nicked and linear). The factors that the electrophoretic mobility depends on are size, charge and the shape of the molecules. Since the viscosity of the medium is same for all the bands, the size and charge of the molecules in phantom bands are a question.
Charge of the molecules: When the electrophoresis is perfomed at neutral pH, the DNA
is believed to be negatively charged. However, during incubation with vanadium complexes, there could have been some binding of the metal complex with the nucleic acid and eventually neutralizing some of the charges in the DNA backbone. This would lower the charge in the molecule and thus finally lowering the overall charge of the molecule resulting in a smaller effective mobility.
Size and shape of the molecules: During the incubation of DNA samples with the
vanadium complexes, the complexes could have created an environment where the strands could have agglomerated and thus the size of the molecule increased thus lowering the mobility in the gels. Or, perhaps, the incubation could have changed the
20
shape of the DNA molecules from the globular shape(as one might expect) and thus the migration in the gels is distorted.
Thus, the project was to develop a method to detect and quantify vanadium bound to the DNA molecules, using AGE. This method could also be extended for detection and quantification of other metals that take part in the Fenton-like reaction. The steps of the project are-
a. First to develop a method in quantifying the metal using aqueous solutions, then optimize the time of reactions and the concentration of reagents to obtain the best possible sensitivity at a reasonable analysis time.
b. To be able to transfer the method to real matrix(agarose gel after the electrophoresis)
c. Detection of the band by means of UV/VIS imaging.
1.6. Chemistry of the method
1.6.1. Fenton Reaction
According to the IUPAC definition, Fenton reaction is the iron-salt dependent decomposition of dihydogen peroxide, generating the highly reactive hydroxyl radical, possibly via an oxoiron(IV) intermediate. Addition of a reducing agent, such as ascorbate, leads to a cycle which increases the damage to biological molecules. (-It was first discovered by Henry Fenton42. Haber and Weiss later discovered the Fenton reaction was both a radical and a chain reaction. They also described following set of equations of the reaction43 -
(Eq. 8)
(Eq. 9) (Eq. 10) (Eq. 11)
21
The later revised form of the reaction by Barb44 concluded that
a. When Fe2+ was present in excess over H2O2, the reaction would be restricted to
quantitative oxidation of Fe2+ by H2O2,
(Eq. 12)
b. When H2O2 was present in excess over Fe2+, there was catalytic decomposition
of H2O2, and it accompanied the oxidation of Fe2+ ions,
(Eq. 13)
c. The rate of reaction is of the first order with [Fe2+] and [H2O2] at the beginning.
However, the apparent order of the reaction increases with [Fe2+].
Although the Fenton reaction has been studied for over more than a hundred years, the exact mechanism has not been unanimously selected.
Similar to the reactions with ferrous salts, Fenton reactions could also involve other metal cations. The process is described as45,
(Eq. 14)
Such processes are described as “Fenton-like46” mechanism where organic substrates
are oxidized by a mixture of low-valent transition metal complex and hydrogen peroxide. Common examples47 of such metals would be VO2+, Ti3+ and Cr2+. Vanadium, at physiological conditions, may produce hydroxyl radicals48 -
(Eq. 15) 1.6.2. TPA(terephthalic acid) Hydroxylation
The hydroxyl radicals can hydroxylate TPA molecule and form 2-hydroxy-terepthalic acid (2-OH-TPA) (Figure 9)49. TPA hydroxylation is one of the most sensitive methods for detection of •OH radicals.
22
Figure 9. TPA hydoxylation.
Armstrong et al.,50 used it as a replacement to calcium benzoate dosimeter and discovered it to be five to six times as sensitive as the benzoate dosimeter. Mason et al.,51 used TPA to assay radicals in sonochemistry. TPA itself is not fluorescent. However, the 2-OH-TPA (hydroxylated TPA) is fluorescence, the excitation wavelength being 315 nm and the emission wavelength being 425 nm52 .
The hydroxylation reaction has been tested with Fenton reaction. The 2-OH-TPA was found to be stable for 24 h and the limit of detection for hydroxyl radical was determined to be 5nmol/L53 .
This project was aimed to couple the Fenton-like reaction with the hydroxylation of TPA (Figure 10. Fenton-like reaction coupled with TPA-hydroxylation.).
23
Figure 10. Fenton-like reaction coupled with TPA-hydroxylation.
1.7. Techniques used.
1.7.1. Agarose Gel Electrophoresis (AGE)
AGE is a very commonly used technique to determine the cleavage activity.
Plasmid DNA exists in 3 different forms (Figure 2). The different forms have different velocities in a medium of agarose gels under an electric potential. Since DNA has a phosphate backbone, it has a negative charge. At neutral pHs, the DNA is negatively charged. In the presence of an electric field, it moves towards the positive electrode. The movement of DNA depends on size and charge of the molecules. The larger the size of the molecules, the slower they move. The movement is directly proportional to the charge as well. It is assumed that the charge will remain constant after cleavage of plasmid DNA. The instrumental set-up of agarose gel electrophoresis is given in Figure
24
Figure 11. Instrumental set-up for AGE54
Theoretical modeling has shown that under a uniform electric field, the movement of nucleic acid occurs in three formats-ogston sieving, reptation and rigid rods55.
Ogston Sieving
This model explains that the nucleic acid molecules pass through the gel via formation of random globular molecules. The passage through the gel depends on the radius of gyration of the molecules. The fragments which have a radius of gyration smaller than the pores are able to pass through the gel quickly and the larger ones get blocked. However, these large molecules could switch from the globular molecules to other alternative conformations for passage through the pores.
Reptation
Under the influence of electric field, the nucleic acids, although present a globules, can enter the gel „end on‟. The movement through the gel occurs in a reptile like fashion. They move in a coiled and helical manner. The shorter molecules will pass quickly, but the larger ones will have to wind their way through the matrix and this separates the different fractions of nucleic acid.
25
Rigid Rods
At higher field strengths, the coiled/helical molecules begin to deform and migrate as rigid rods. However, the separating ability decreases under such conditions because the migration becomes size independent.
1.7.2. Absorption Spectrometry
When light of a certain wavelength irradiates a molecule, the molecules undergo a transition from a ground-state to an excited-state56. The difference between the energy of the ground state electrons and the excited state electrons is the magnitude of the absorption. When a molecule absorbs energy, the transition that is most likely to take place is form HOMO (Highest Occupied Molecular Orbital) to LUMO (Lowest unoccupied molecular orbital). The greater the number of molecules capable of absorbing light of certain wavelength, the greater is the absorption.
When light at certain wavelength (λ) of intensity (I0) enters a solution of concentration
(c) in a cuvette, a part of light gets absorbed. (Figure 12 )
Figure 12. Light passing through a cuvette
The absorbance (A) is defined as
(Eq. 16)
According to Beer-lambert‟s law, the absorbance (A) is given as,
26
where ε is the molar absorptivity coefficient (moL-1 cm-1) and l is the optical path length. This way, the absorption can be related with the concentration of the molecule being studied. The functioning of the double beam spectrophotometer is given in Figure
1357.
Figure 13. Schematic diagram of a spectrophotometer57
Deuterium lamp is used as a light source. The monochromator provides the required wavelength. The rotating mirror is responsible for passing the light into the reference and the sample via mirrors. As a result, one beam of light passes through the reference, and another beam passes through the sample. The detector compares the electric circuitry between these two beams and thus the difference would depend on the absorbance of the light by the sample58.
1.7.3. Fluorescence Spectroscopy
When a molecule absorbs a photon, it undergoes a transformation from ground level (S0) to excited level (Sn, n>1). An excited molecule will return to the ground level
27
Step 1. The molecule returns from Sn to its lowest excited level S1 following energy
dissipation into the surrounding environment.
Step 2. From S1, the molecule can return to S0 via emission of a photon (fluorescence)
with a radiative rate constant kr. Other possible mechanisms are possible which are not
discussed here. The lifetime of fluorescence lasts from 10-9 to 10-12 seconds. The lifetime of the fluorescence is affected by temperature, pressure, quenchers, and the different type of matrices used.
The spectrofluorometer is equipped with a Xenon lamp as a light source. The equipment (Figure 1560) possesses two monochromators for selecting both the emission and excitation wavelength. The fluorescence is detected with photomultiplier tubes and quantified with appropriate electronic devices.
28
Figure 15. Schematic diagram of a spectrofluorometer60.
1.8. Method validation parameters
1.8.1. LOD (limit of detection)
The LOD is the lowest concentration of analyte that the instrument can distinguish from against the blank/noise within a certain confidence interval (usually 95% intervals). Usually, it is determined by using the standard deviation (sd) of the blank sample. However, in this manuscript, the LOD is calculated using the least square methods.
Eq. 18.
Where, sdy is the standard error in the y-estimate and m is the slope.
1.8.2. Sensitivity
It is the ability of the instrument in a particular method to distinguish very small changes in concentration of the analyte. The slope (m) provides an estimation of sensitivity in this manuscript.
29
1.8.3. Precision
Precision in analytical method is the difference in the results when the same amount of analyte is used. The less difference in results there is for a certain concentration of analyte, the better the method is.
The precision in the analyte concentration is calculated in this manuscript The standard deviation for the residuals, sdy, obtained from the least squares linear regression can be
used as an estimate of the precision of the method: The standard deviation in output (sdy)is given as,
Eq. 19
Where,
n is the number of measurements and is the sum of the squares of the residuals.
The standard deviation in the analyte concentration (sdx) is given as,
Eq. 20
1.8.4. Estimation of errors
The estimation of errors (in the slope and the y-intercept) is performed using the t-student distribution at 95% confidence intervals. For example, the error in the slope (Δm) is given as,
30
2. Experimental Section
2.1. Instruments
A Shimadzu 1700 Pharmaspec UV-VIS absorption spectrophotometer was used to estimate the concentration of hydrogen peroxide. Three spectrofluorometers (Fluromax 3 and Fluoromax 4, Horiba and Jasco FP-777) were used to study the fluorescence of TPA-OH that was formed during the course of the reaction. The software used to operate the Horiba spectrofluorimeters was FluorEssence v3.5
A 1 cm quartz cystal cuvette (Sigma Aldrich) was used to measure the fluorescence. AlphaImager from Alpha Innotech was used for capturing the gel images. AlphaEaseFC was the software used to operate the instrument.
2.2. Preparation of solutions
2.2.1. Phosphate buffer:
A solution of K2HPO4 (Panreac, 99%) was made by dissolving 50 mmoles of K2HPO4
in 500 mL water. The pH of the solution was adjusted to 7,4 by the addition of concentrated HNO3 (Merck, 65%). The solution was then stored in the refrigerator for
further use.
2.2.2. TPA(Terephthalic acid) solution
The TPA solution was made by dissolving 66 mg TPA (Sigma Aldrich, 95%) in 20mM Phosphate buffer.
2.2.3. Concentrated TBE solution
A solution of 101,81 g Trizma base(Sigma Aldrich, 99%), 55,029 g Boric acid(Riedel de Häen, 99,5%) and 7.776 g of EDTA(analaR, 99,5%) were dissolved in 1,0 L of water. The pH was measured (~8,0) and kept in the refrigerator for further use. The solution was labeled 10X TBE. Further dilutions were made when necessary.
2.2.4. Water
In all cases, Millipore water (resistivity > 18MΩ.cm) was used, unless otherwise mentioned.
31
2.2.5. Vanadium complexes solution
Different solutions of VOSO4, VO(acac) and VO(clor) were made by dissolving respective concentrations of complexes in water.
2.2.6. Hydrogen Peroxide
Water was used to dilute the original hydrogen peroxide (Sigma Aldrich and BDH Prolab , 30%) into required concentration amounts. The concentration of peroxide was estimated using absorbance measurements61.
ε = 74M-1
cm-1
2.3. Spectrofluorimetric measurements
2.3.1. Preparation of solutions
A solution of 400 µM TPA was prepared in 20 mM phosphate buffer. 10 mL of this solution was poured into a 20,0 mL volumetric flask. A certain volume of vanadium complex [VO(acac)2 (Sigma Aldrich, 98%) or VOSO4 (Aldrich)] solution depending on
the concentration needed was added and water was used to fill upto the 20 mL mark. 10 mL of this solution (final concentrations : 200 µM TPA, 10 mM phosphate buffer and 0-100 µM of vanadium complex) was added to another beaker.
In later experiments with galactose, necessary amount of galactose (Koch-Light, pure) was added to the solution of TPA. The solutions were made of 0,050 % (0,05 g galactose in 100 mL solution), 0,25% and 0,50%.
32
Figure 16. Procedure of spectrofluorimetric measurement
2.3.2. Fluorescence measurement
The excitation wavelength was 312 nm and the emission was monitored from 350 nm to 500 nm. The slit wavelength was 1 nm (excitation and emission slits) for the measurements in aqueous solutions and 2 nm (for both the excitation and the emission slits) in solutions with galactose concentration higher than 0,050% or with agarose gels. The integration time was set 1 nm/s for Fluoromax 3, and 0,1 nm/s for Fluoromax 4. These integration times were default settings of the instrument.
The fluorescence was measured after 45 seconds (timed 0 minute) of addition of H2O2
to the TPA/Vanadium solution, 5 minute 45 seconds (timed 5 minutes) and so on until 20 minutes.
When the data contained large levels of noise (observed in presence of galactose), the smoothening was performed using Savitzky-Golay algorithm(10 points of window, 2 degree polynomial).
33
2.4. Agarose gel preparation.
2.4.1. Agarose Gel Electrophoresis
2.4.1.1. Plasmid DNA
pA1 plasmid DNA[consisting of full-length cDNA from Cytochrome P450 CYP3A1 inserted in the PBS plasmid vector(pBluescribe, Stratagene, UK)]Error! Bookmark not defined. repared by Nataliya Butenko was used for gel electrophoresis experiments. The linear DNA(also prepared by Nataliya) was obtained by digesting of pA1 with HINDIII and was used was a reference in agarose gel electrophoresis.
2.4.1.2. DNA cleavage activity
The cleavage activity of DNA was studied by the transformation of the supercoiled plasmid DNA (Sc) to nicked circular and linear DNA. The reaction mixture was prepared by addition (in this order) 6 µL of water, 2 µL (0.2 µg) of supercoiled pA1 DNA, 2 µL of 100 mM K2HPO4 buffer (pH 7,4) and 10 µL of the aqueous solution of
the vanadium complex [VO(acac)2 –Sigma Aldrich, 98% purity) and VO(clor) ( sample
from Prof. Susana Etcheverry].
Before gel electrophoresis, the samples were wrapped up in aluminum foil were incubated for 1 h at 370C. After incubation, 5 µL of loading buffer (0.25% bromophenol blue, 0.25% xylene cyanol, 30% glycerol in water), were added to the samples and the solutions were loaded onto a 1% agarose gel containing ethidium bromide (EtBr). Non-incubated and linearized plasmid DNA was used in the extremes of 18 welled gel for control purposes. The electrophoresis was done at 110 V for 3 h. The bands were then photographed under UV light using AlphaImager.
34
2.4.2. Agarose gels for testing the Fenton-like reaction coupling with TPA hydroxylation.
To a dissolved solution of 200μM TPA (Sigma Aldrich, 99%) in 150 mL of 0,50X TBE, 1,5 g of agarose was added. The solution was then microwave- heated until the agarose dissolved. When the solution cooled down, it was poured in a gel holder to facilitate the solidification.
In one of the experiments, a very concentrated (saturated) and a 100 µM sample of VOSO4 and H2O2 were added while the gel was solidifying. Water was used as a
control. It was taken care that the tip of the pipette did not touch the gel solution during addition.
Marks were made on a side by the use of pipette-tips. The schematic diagram of the gel is given in (Figure 17). The illumination was performed with UV light of 302 nm.
35
2.4.3. Agarose gels in cuvette
To study the fluorescence in gels, agarose gel was prepared with TPA and VO(acac)2
and H2O2.
2.4.3.1. Boiling and dissolving agarose only with TPA.
A solution(Solution 1) of 0,0066 g (400 µmol) TPA and 2,0g (2%) agarose were added to a solution of 50 mL 40 mM phosphate buffer and 50 mL 2X TBE. In another flask, a solution (Solution 2) of 0,0159 g (600 µmol) VO(acac)2 was prepared. A solution of
hydrogen peroxide (1,6 mM) was prepared as well.
Solution 1 was heated until agarose dissolved. 1,0 mL of this solution was added to a
cuvette where 1,0 mL of Solution 2 and 0,4 mL of peroxide were already added. In another cuvette, 1,0 mL of heated Solution 1 was added followed by 1,0 mL of
Solution 2 and 0,4 mL of hydrogen peroxide solution.
2.4.3.2. Boiling and dissolving agarose with TPA,VO(acac)2 and H2O2
A solution of 0,0034 g TPA (200 µmol), 0,0079 g VO(acac)2 (300µmol), 1,0 g agarose
(1%) were added in a 100 mL volumetric flask. The vanadium complex was not added for blank measurements. Instead, water was used. Also added was 4,0 mL 10X TBE, 10,0 mL of 100 mM phosphate buffer and the water was used to fill upto the mark. The solution was then added to another beaker and 15,0 mL of 1,8 mM H2O2 was added and
left for 30 minutes. The solution was then heated until the agarose dissolved. When the temperature of the solution was ~80oC, the solution was added to a cuvette and left for solidification and later fluorescence measurements were performed.
36
3. Results and Discussion
3.1. Agarose gel electrophoresis
The result from one agarose gel electrophoresis is given in Figure 8 .
It can be observed that both VO(acac)2 and VO(Clor) cleave DNA. There is presence of
linear and nicked bands in the samples containing vanadium complexes but not in the control sample. The band intensity of supercoiled DNA decreases with increasing concentration of VO(acac)2 and the band intensity of the nicked and linear DNA
increase with increasing concentration.
3.2. Preliminary tests in agarose gel.
The results of the gel imaging with Vanadium is given in (Figure 18)
Figure 18. Gel imaging of experiment from Figure 17 before addition of H2O2 (left)
and after addition of H2O2 (right). [Excitation at 302 nm and filter at (595 ± 40) nm]
The spots that contained VOSO4 (conc) appeared as dark spots on the image. At lower concentrations of VOSO4, no such spots were observed. The dark spots (on the left in
Figure 18. Gel imaging of experiment from Figure 17 before addition of H2O2 can be
attributed to the precipitation of vanadium hydroxides. An interesting observation was that after the addition of peroxide, large bright spots appeared in the gel. This could be due to fluorescence of 2-OH-TPA formed by the reaction of TPA with .OH generated
37
by H2O2 in contact with the gel. The maximum for the emission of 2-OH-TPA occurs at
425 nm, a lower wavelength lower than the (595 ± 40) nm imaging system filter window. The bright areas were probably due to diffraction in the gel caused by surface changes in the gel. Using this method would require acquiring a different filter of (464 ± 40) nm for the imaging system.
3.3. TPA-hydroxylation coupled with Fenton-like reactions
3.3.1. Method development in aqueous solutions.
Experiments with TPA-hydroxylation with Fenton-like reaction using VO(acac)2/VOSO4 were done. The concentration of the Vanadium complexes were
varied from 0-100 µM and H2O2 was added in a large excess (~9,0 M). The
fluorescence emission spectra were measured every 5 minutes upto 60 minutes. The results can be seen in Figure 19 and Figure 20.
Figure 19. Time evolution of maximum intensity (410 nm) of 2-OH-TPA generated
from different concentrations of VOSO4 over time. H2O2conc = (~9M)
5.500 6.500 7.500 0 10 20 30 40 50 60 I410 nm (a.u .) × 10 10 Time (min) 0,0 1,0 10 25 100 VOSO4 conc (µM)
38
It was expected that the fluorescence intensity should increase over time due to the increase in formation of 2-OH-TPA. However, this was not the case in this experiment. A particular example can be seen in that Figure 21. The intensity decreases as a function of time regardless of the concentration of vanadium complex used.
Figure 20. Time evolution of maximum intensity (410 nm) of 2-OH-TPA generated
from different concentrations of VO(acac)2 over time. H2O2conc = (~9M)
A possible explanation is that the reaction between •OH and TPA provides a mono-hydroxylated compound and the further hydroxylation is negligible only under the conditions when the concentration of TPA is much higher than the concentration of hydroxide radicals53. When the concentration of •OH is higher than the concentration of TPA conditions, hydroxylation could have taken place in one or more carbon atoms than the ortho position (Figure 22).
5.834 6.134 6.434 0 5 10 15 20 25 I 41 0 nm (a.u .) × 10 10 Time (min) 0,0 20 40 60 VO(acac) 2conc
39
Figure 21. Fluorescence spectra measurements for 80µM VO(acac)2 over time.
H2O2conc = ~9M
Figure 22. Figure showing the different positions in the benzene ring where
hydroxylation can take place when large excess of .OH radicals are present.
A low concentration of H2O2 was used in the further experiments. When the
concentration of H2O2 used was 1,8 mM, the intensity of 2-OH-TPA in the solution
increased with time for all concentrations except blank. The results can be seen in
Figure 23 and Figure 24. 0,E+00 2,E-07 4,E-07 6,E-07 8,E-07 1,E-06 345 395 445 495 I (a.u .) Wavelength (nm) 0 5 10 15 20
40
Figure 23. Time evolution of maximum intensity (428 nm) of 2-OH-TPA generated
from concentrations of VO(acac)4 over time. H2O2conc = 1,8M
0 40000 80000 120000 0 5 10 15 20 25 I428 nm (a.u .) Time (min) 0,0 12 25 37 50 62 Conc. VO(acac)2 µM
41
Figure 24.Individual fluorescence spectrum measurements
for different concentrations of VO(acac)2.
H2O2conc =1,8 mM. 0,7 1,2 1,7 2,2 350 400 450 500 I (a.U )/ 10 3 λ (nm)
0,0 µM
0 10 20 30 350 400 450 500 I (a.u )/ 10 3 λ (nm)12 µM
0 20 40 60 350 400 450 500 I/( a.u .)/ 10 3 λ (nm)25 µM
0 20 40 60 80 100 350 400 450 500 I (a.u .)/ 10 3 λ (nm)37 µM
0 20 40 60 80 100 120 140 350 400 450 500 I (a.u .)/ 10 3 Wavelength (nm)50µM
0 40 80 120 160 350 400 450 500 I(a.u.)/ 10 3 λ (nm)62 µM
42
It can be seen that in Figure 23, the intensity of the formed 2-OH-TPA species in the solution increases slightly over time during a course of 20 min. The increase is related to increase in the number of fluorescent species, i.e., 2-OH-TPA. There was no increase in intensity observed for the blank solution.
The next step was to develop a relation between the concentration of Vanadium used and the fluorescence produced. So, a graph between amount of fluorescence and the concentration of vanadium used was made in Figure 25.
Figure 25. Maximum intensity (428nm) of 2-OH-TPA with different concentrations of VO(acac)2 over time. H2O2conc = 1,8 mM
To optimize the particular time period, sensitivity was checked at different time intervals. A rough estimation of the precision in the concentrations was also performed. The results are given in Table 1.
0 20000 40000 60000 80000 100000 120000 140000 160000 0 10 20 30 40 50 60 70 I 42 8 nm (a.u .) Concentration of VO(acac)2(µM) 0 min 5 min 10 min 15 min 20 min
43
Table 1. Parameters to study the sensitivity at different time intervals for TPA
hydroxylation coupled to Fenton-like reactions.The errors are presented with 95% confidence intervals Time (t) (min) Slope (m)/(103) (a.u./µM) y-intercept (b)/ (103) (a.u.) Standard deviation (sdx) (µM) 0 1,70 ± 0,11 0,73 ± 4,2 0,8 5 1,90 ± 0,16 1,0 ± 6,0 1,0 10 2,10 ± 0,24 1,3 ± 8,9 1,3 15 2,20 ± 0,34 2,4 ± 13 1,8 20 2,30 ± 0,37 3,4 ± 14 2,0
At time 0, the sensitivity is significantly less compared to time 10 minutes or above. However, at times 10 minutes or above, the errors in the slope, y-intercept and CVx are
higher. At time 5 minutes, the sensitivity is not significantly different from other time intervals. Therefore, time 5 minutes would be the most favorable time to measure the fluorescence of the 2-OH-TPA species formed in the samples. LOD for time period 5 minutes was calculated to be 4,1 µM from the calibration curve.
The equation for the line at 5 minutes are given as,
Eq. 22
3.3.2. With D-galactose
The next step of the method was to try it in agarose. The problem with agarose is that agarose has to be heated to solidify into gels. It was decided that the system should first be used in galactose. Galactose would provide a very close resemblance to agarose in terms of matrix composition and is easily soluble. Therefore, in the further experiments, increasing concentrations of galactose were added to the TPA solutions.
An initial set of measurements were done with 0,050%, 0.25% and 0,50% D-galactose. The peroxide concentration used was estimated to be 1,8 mM and the data was treated with Savitzky-Golay smoothening.
With the presence of galactose, the fluorescence was lower (the maximum value ~25k units with 110 µM VO(acac)2 (Figure 26) compared to ~130k for 62 µM VO(acac)2
44
. 0,5 1,5 2,5 350 400 450 500 I(a.u.)/ 10 3 λ (nm)0,0 µM
0 0,1 0,2 0,3 0,4 350 400 450 500 I(a.u.)/ 10 3 λ (nm)22 µM
0 2 4 6 8 10 350 400 450 500 I( a.u .) / 10 3 λ (nm)43 µM
0 5 10 15 350 400 450 500 I(a.u.)/ 10 3 λ(nm)86 µM
0 10 20 350 400 450 500 I(a.u.)/ 10 3 λ (nm)110 µM
0 5 10 15 350 400 450 500 I(a.u.)/ 10 3 λ (nm)64 µM
Figure 26.Individual fluorescence spectrum measurements for
different concentrations of VO(acac)2 in presence of 0,050%
45
Figure 27. Maximum intensity (428nm) of 2-OH-TPA generated from different
concentrations of VO(acac)2 over time. H2O2conc = 1,8 mM, galactose= 0,050%.
It can be observed from Figure 27 that the maximum intensity of the formed 2-OH-TPA species increased with concentrations in a linear fashion. The galactose concentration was then increased from 0,050% to 0,50%. At 0,50%, a working range was studied. The study is shown in Figure 28 and Figure 29. The peroxide concentration used for this experiment were 1,9 mM for VO(acac)2 and 1,8 mM for
VOSO4 respectively. It can be observed that at concentrations of 0-300 μM of vanadium
complexes, the fluorescence increased in a linear fashion. However, at higher concentrations the fluorescence intensity remained constant or decreased. It is a possibility that that the complexes precipitated at higher concentrations.
0 5000 10000 15000 20000 25000 0 20 40 60 80 100 120 I428 nm (a .u.) Concentration VO(acac)2 (µM) 0 min 5 min 10 min 15 min 20 min
46
Figure 28. Maximum intensity (428nm) of 2-OH-TPA generated from different
concentrations of VO(acac)2 over time. H2O2conc = 1,9 mM, galactose= 0,50%.
Figure 29. Maximum intensity (428nm) of 2-OH-TPA generated from different
concentrations of VOSO4 over time. H2O2conc = 1,8 mM, galactose= 0,50%.
0 20000 40000 60000 80000 100000 120000 140000 0 50 100 150 200 250 300 350 400 I42 8 nm (a.u ) Concentration of VO(acac)2 (μM) 0 min 5 min 10 min 15 min 20min 0 20000 40000 60000 80000 100000 120000 140000 0 100 200 300 400 500 600 700 I42 8 nm (a.u .) Concentration of VOSO4(μM) 0 min 5 min 10 min 15 min 20 min
47
The next steps were to determine the LOD (Limit of Detection) in presence of 0,50% galactose. Concentrations of as low as 2,0 μM and the highest 83 μM were used. The concentration of peroxide used was estimated to be 1,9 mM. The relationship between the concentrations and the fluorescence is given in Figure 30.
Figure 30. Maximum intensity (428nm) of 2-OH-TPA generated from different
concentrations of VO(acac)2 over time. H2O2conc = 1,9 mM, galactose= 0,50%.
Least squares method was used to calculate the LOD. 4 lowest concentrations were taken for a better estimate of LOD.
A comparison between the different galactose concentrations and the sensitivities (at 5 minutes) for VO(acac)2 was performed, the results of which are given in Table 2.
Table 2. A comparison (at 5 min) between the sensitivities when different wt% of
galactose was used. The values are presented with 95% confidence intervals.
Galactose (wt %) (g/100mL) Slitwidth (nm) Slope (m)/(103) (a.u./µM) y-intercept/ (103) (b) (a.u.) Standard deviation(sdx) (µM) Standard deviation(sdx) (µM) Range (µM) 0,0 1 1,9 ± 0,2 1,0 ± 6,0 1,0 1,0 0-62 0,050 1 0,17 ±0,07 0,5 ± 4,5 8,8 8,8 0-107 0,49 2 0,33 ± 0,03 1,7 ± 1,2 3,0 3,0 0-83 0 5000 10000 15000 20000 25000 30000 35000 0 20 40 60 80 100 I428 nm (a.u .)
Concentration of VO(acac)2(uM)
Fluoroscence vs concentration graph in presence of
0,50% galactose
0 min 5min 10 min 15 min 20 min48
The slope without the presence of galactose is higher (1900 ± 160) a.u./µM whereas, for 0,050% of galactose is (170 ± 70) a.u./µM. The change in the sensitivity is significant at 95% confidence intervals. The precision is lower when galactose is used. (CVx for
0,050% galactose is 8,8 µM whereas for 0,0% galactose is 1,0µM).
The lowering of the sensitivity and the precision could be because the presence of galactose interferes with the fluorescent species (2-OH-TPA). Or, perhaps, galactose, in high concentration, will act as a radical scavenger and decrease the concentration of hydroxyl radicals available to react with TPA. However, with increasing slitwidth increases the sensitivity significantly. With the use of 0,50% galactose and 2 nm slitwidth, the slope obtained was (330 ± 28) a.u./µ.M. whereas with the use of 0,050% galactose and 1 nm slitwidth, the slope obtained was (170 ± 70) a.u./µM. the precision is also better when slitwidth is increased( CVx= 8,8 µM for 0,050% and 3,0 for 0,50%)
3.4. Fluorescence in agarose gels
This would theoretically be the part of the experiment where one could determine if the methodology functions. The main aim of the experiments was to transform the hydroxylation of TPA coupled to Fenton-like mechanism from an aqueous medium to agarose gels.
3.4.1. Boiling and dissolving agarose only with TPA
As the agarose/TPA solution was warm and the Vanadium solution is cold, a homogeneous solution was difficult to achieve. Without a homogenous sample, the results obtained from fluorescence spectrofluorometry are inconclusive because there exists numerous light scattering effects. Thus, another approach of boiling all components of agarose gel-agarose, TPA, H2O2 and VO(acac)2 together was pursued.
3.4.2. Boiling and dissolving agarose with TPA,VO(acac)2 and H2O2
TPA, VO(acac)2, agarose and H2O2 were mixed in one beaker and heated until agarose
dissolved. The sample was added in a cuvette and taken for fluorescence after solidification. The result is given in Figure 31. Fluorescence spectra measurement of 1% agarose gels containing 200µM TPA and 1,8 mM H2O2..