A framework to include the (inter)dependencies of Disaster Risk Reduction
measures in coastal risk assessment
Lydia Cumiskey
a,b,*, Sally Priest
b, Nikolay Valchev
c, Christophe Viavattene
b, Susana Costas
d,
Joseph Clarke
eaDeltares, Boussinesqweg 1, Delft 2629 HV, The Netherlands
bFlood Hazard Research Centre, Middlesex University, London NW4 4BT, UK
cInstitute of Oceanology, Bulgarian Academy of Sciences, P.O. Box 152, Varna 9000, Bulgaria dUniversity of Algarve-CIMA, Campus Gambelas, Faro 8005-139, Portugal
eCH2M, Burderop Park, Swindon SN4 0QD, UK
A R T I C L E I N F O
Keywords:
Disaster Risk Reduction measures Coastal risk assessment Early warning systems Awareness-raising (Inter)dependencies
A B S T R A C T
Effective coastal risk management often involves the selection and appraisal of Disaster Risk Reduction (DRR) measures. Such measures, however, are rarely implemented in isolation and their (inter)dependencies need to be considered to assess the overall contribution to risk reduction. This paper presents a framework that utilises a pathway-based approach to consider such (inter)dependencies. The framework identifies measures that have the potential to directly influence risk reduction (primary measures) at the individual/household level and how these relate to the implementation of other measures (non-primary). These two types of measures are linked using intermediate pathway factors, which aggregate to the effective uptake and/or operation of primary measure(s) and subsequently represent the direct influence on risk reduction when included in a risk assessment. The approach is demonstrated utilising two coastal risk examples. The case of Varna Bay, Bulgaria highlights a pathway, which explores how developing a coastal Early Warning System (EWS), can enable assets to be moved and saved prior to an event. The Praia de Faro, Portuguese application provides an example of how local risk awareness meetings can support the uptake of property raising to protect against erosion. Past experience, poor trust in authorities, house type/feasibility, transient population and strong community networks are identified as key influencing variables across both cases.
The process of considering the (inter)dependencies between measures has potential to lead to improved decision-making and strategy building. The framework developed isflexible in nature and can be applied in many different situations; however, it is one step towards accounting for these (inter)dependencies at the individual/household level. Ex-ante or ex-post survey data, expert judgement and literature have been used to estimate these factors. However, in many cases this good quality data is not available, and is something that national level monitoring strategies, along with the research community, must address.
1. Introduction
Recent and historic low-frequency, high-impact coastal events have demonstrated extensive social and economic impacts on large cities and countries, such as Xynthia (impacting France in 2010), North Sea storm (impacting Netherlands and Belgium, 1953), and Superstorm Sandy (impacting the north-eastern USA, 2012). Coastal communities exposed to such water-related hazards need to both adapt and prepare for larger disasters than being experienced today (Hallegatte et al., 2013). Coher-ently, recently adopted global policies all highlight the need to develop
and monitor, strategies and plans, that reduce disaster risk, and build adaptive capacity to climate change, (e.g. Sustainable Development Goals (United Nations, 2015), Sendai Framework for Disaster Risk Reduction (DRR) (UNISDR, 2015), Paris Agreement on Climate Change (UNFCCC, 2015) and New Urban Agenda (UN-Habitat, 2016)). Furthermore, at a regional level, European member states are obliged to define and update integrated flood and coastal risk management plans and address climate change, see the European Union Floods Directive (European Union, 2007), and European Union Strategy on Climate Adaptation (European Commission, 2013). Such strategies or plans often
* Corresponding author. Flood Hazard Research Centre, Middlesex University, London NW4 4BT, UK. E-mail address:[email protected](L. Cumiskey).
Contents lists available atScienceDirect
Coastal Engineering
journal home page:www.el sevier.com/l oca te/ coa stal eng
http://dx.doi.org/10.1016/j.coastaleng.2017.08.009
Received 1 February 2017; Received in revised form 14 July 2017; Accepted 7 August 2017 Available online xxxx
0378-3839/© 2017 Published by Elsevier B.V.
comprise a number of different“measures”, as they are known within the flood risk and DRR community (UNISDR, 2015; European Union, 2007; Kreibich et al., 2015; Schanze et al., 2008), or“options” which is more commonly used in the Climate Change Adaptation (CCA) community (Lim et al., 2004; De Bruin et al., 2009; Klein et al., 2001; Hallegatte, 2009). In light of the Sendai Framework for DRR, and the acknowl-edgement that CCA is a component of DRR (Kelman et al., 2015), the overarching term“DRR measures” is used for the purpose of this paper. There are various categorisations of such measures; structural vs. non-structural (Parker et al., 2007a; Hutter et al., 2008; Penning-Rowsell and Fordham, 1994), hard vs. soft measures (Hall and Solomatine, 2008), measures vs. instruments (Olfert and Schanze, 2005). Some categories of measures identify the direct influence on hazard (e.g. structural measures such as coastal flood defences and beach nourishment), vulnerability (e.g. non-structural measures such as property level protection) and others identify the indirect effects that aim to influence behaviour (e.g. instruments such as early warning systems (EWS), preparedness planning and insurance). However, these existing categorisations of measures lack consideration of the (inter)dependencies between different measures, for instance needing an effective risk awareness programme to incentivise property level protection or a EWS to facilitate successful and timely movement of assets. These (inter)dependencies are fundamental to the evaluation of any potential impact reduction.
There is consensus that investing in the economic and social benefits of such DRR measures has the potential to outweigh the costs (De Bruin et al., 2009; Rogers and Tsirkunov, 2010; Penning-Rowsell et al., 2005; Pappenberger et al., 2015). The evaluation of individual measures, and combinations thereof, supports a rational comparison between measures against a baseline situation (Penning-Rowsell et al., 2013). A comparison between measures or strategies is often made using Multi-Criteria Anal-ysis and/or Cost-Benefit Analysis (De Bruin et al., 2009; Penning-Rowsell et al., 2005; Hajkowicz and Collins, 2007; Van Ierland et al., 2013) which can be supported with modelled input from risk assessments. Risk as-sessments have mainly focused on modelling direct-tangible economic damages (Jongman et al., 2012; Merz Kreibich et al., 2004) using depth-damage curves (Messner and Meyer, 2006; Meyer et al., 2013) or empirical overall damage reduction factors (Parker et al., 2007a; Thur-ston et al., 2008). Assessing the benefits of those DRR measures that
affect the hazard directly (e.g. raising a dike) is relatively straightforward as modelling can be undertaken to calculate the modified flood depth. DRR measures at an individual scale (e.g. property-level resistance or resilience measures, raising or evacuation of stock or property contents) can also be represented within risk assessment through the modification of depth-damage curves (Thurston et al., 2008; Viavattene et al., 2015). DRR measures such as coastal EWS or awareness raising programmes, which on their own, may not directly influence any risk reduction, may be fundamental to the effectiveness of other measures that directly in-fluence risk reduction and need to be evaluated differently. These con-nections and dependencies between the DRR measures are important to consider when evaluating measures and devising strategies. Methodol-ogies have been proposed that evaluate the benefits of EWS that utilise different reduction factors which consider that 100% of the population cannot be expected to receive, have the ability to, and are willing to effectively respond to a warning and take appropriate actions (Parker et al., 2007b; Priest et al., 2011; Molinari and Handmer, 2011; Carsell et al., 2004) and others estimate the Uptake (UP) and Operator (OP) factors of individual measures (Parker et al., 2008; Clarke et al., 2015; Clarke, 2015). Although these do explore connections between different measures they do not address the connections with other measures like emergency planning, awareness raising, and financial and legal in-struments, providing an opportunity for further research. Indices are often used to quantify the social characteristics of the population, (e.g. the Social Flood Vulnerability Index (SFVI) in the UK (Tapsell et al., 2002), and in the United States (Cutter et al., 2008; Flanagan et al., 2011; Rygel et al., 2006)) and many of the factors in such indices can influence
the uptake and operation of measures. Understanding the threat and
coping appraisal and its impact on behavioural response (Bubeck et al., 2013) can offer further insights into the uptake and operation of mea-sures. This previous research and methods can be built upon and utilised to understand and evaluate the risk reduction of pathways of interde-pendent measures that accounts for social and behavioural factors.
The research presented here aims to provide an innovative frame-work to incorporate interdependent DRR measures in coastal risk as-sessments utilising a pathway-based approach. The framework involves selecting DRR measures that directly and indirectly influence risk reduction at the household/individual level, defining the intermediate pathway factors and associated influencing variables between these measures, and quantifying these factors using the best available data to estimate the appropriate UP and OP factors. The output can be used to estimate the risk reduction using the most appropriate risk assessment method. Adopting this framework permits the consideration of a broader range of measures within risk assessment and recognizes the (inter)de-pendencies between DRR measures in combination. Firstly, the frame-work and how to use it are described, and example applications from the RISCKIT project case studies in Varna, Bulgaria and Praia de Faro, Portugal are presented. Finally, further discussion of the benefits and limitations of the framework are considered.
2. Framework development
2.1. Identifying interdependent DRR measures
Anyflood risk or DRR plan aims to reduce the probability of hazards and/or their potential consequences (UNISDR, 2015; European Union, 2007) by implementing a prioritized set of tailored measures. Such a set of measures can be termed a portfolio (Hall and Solomatine, 2008; Penning-Rowsell et al., 2014) or alternative strategies (Vis et al., 2003). As highlighted previously, various contested categorisations of measures have been proposed related to the way in which they reduce risk (structural vs. non-structural), whether they are engineering based or otherwise (hard vs. soft) or the timing of their implementation (pre, during, post event). These characterisations, however, generally lack emphasis on the required connections between different measures necessary for effective implementation. Although Olfert and Schanze (2007) touch upon connection in their definition of instruments as
“indirectly shaping scope for action” the specific dependencies are not identified. It is critical to make the links clearer between measures that may have a necessary general effect (e.g. awareness raising campaigns) and the implementation of a measure that directly reduces the hazard, exposure or vulnerability of a receptor. Omitting consideration of these (inter)dependencies when scoping, assessing or selecting a DRR measure may lead to an underestimation of the difficulties of implementation and/or sub-optimal strategies being selected. Building on the approaches byPriest et al. (2011)andClarke et al. (2015)an innovative framework (Fig. 1), has been developed to further highlight the (inter)dependencies between multiple measures, along pathways through which they can be included when assessing their potential for risk reduction.
In this framework, although DRR measures will include all measures in the categorisations as outlined above, it distinguishes between primary measures and non-primary measures. Primary measures will directly in-fluence risk reduction by modifying the vulnerability (e.g. by making a property less susceptible to damage; such as property level resilience measures) or the exposure of receptors (such as the evacuation of people or property out of the risk zone prior to an event). Importantly, primary measures are those where it is possible to make a direct link to risk reduction (e.g. damage assessment using depth-damage curves). These primary measures have been further grouped into active and passive preparedness measures, which is afirst critical link to their dependency on other non-primary measures. Active preparedness measures require action before or during an event and as such may be dependent on the receipt of an early warning or actions of others (e.g. an evacuation in-struction). These have been further divided into those that require
operation during the event (e.g. demountable defences) and those that do not require pre-event action or purchase (uptake) before the event (e.g. moving or evacuating household contents). Conversely, passive pre-paredness measures may require uptake before an event (e.g. the modi-fication of a property to be more resilient) but do not require any action during an event to be effective. An additional category of primary mea-sures, long-term mitigation measures includes measures that influence the vulnerability and exposure of assets in a more permanent way (e.g. asset relocation, raisingfloor height of properties). To be able to assess the risk reduction of these measures we apply Uptake (UP) and Operator (OP) factors from existing studies (Parker et al., 2008; Clarke et al., 2015). Herein, these are defined as followed:
▪ Uptake (UP) factor: the proportion of the population/receptors at risk that effectively adopt primary measure(s) prior an event; ▪ Operator (OP) factor: the proportion of the population/receptors
at risk that will effectively respond (incl. operating measures or evacuate) just prior or during aflood.
It is acknowledged that the measures presented on the right ofFig. 1
are not exhaustive but they offer an important categorisation to under-stand the (inter)dependencies. It is important to note that measures at an individual or household level are the focus of this paper, while measures at different levels (e.g. street level temporary barriers) and those that influence the hazard directly (e.g. coastal defence structures and beach nourishment) are not included. It is recognised that there are likely additional (inter)dependencies between hazard influencing measures and non-primary measures, e.g. dike monitoring and the provision of early warning information, but are outside the scope of this research.
Non-primary measures are defined as those that do not directly lead to risk reduction, however, may influence the uptake or improve the operation and effectiveness of other primary measures (or other non-primary measures) during an event. For example, the non-primary purpose of public awareness campaigns is to increase the risk knowledge of those living in flood risk areas so that they behave appropriately (Johnson et al., 2007). This‘appropriate’ behaviour could include implementing
primary measures such as placing sandbags, moving assets or installing property level protection to reduce damages. Non-primary are grouped into four broad categories of sub-measures (Emergency planning and response, Early warning systems (EWS), Risk awareness raising and Financial and legal instruments) to highlight the potential complexity of their influence on the effectiveness on flood risk reduction. For instance, there may be multiple awareness-raising approaches adopted (e.g. in-formation meetings or campaigns) or different aspects that may influence the effectiveness of the approach (e.g. flood warning lead time or coverage or the frequency or quality of a campaign). Furthermore, one non-primary measure can also influence the effectiveness of another non-primary measure (e.g. early warning lead-time and emergency evacuation planning).
The framework is designed so that a user is forcedfirstly to locate the measure of interest and then consider their (inter)dependencies with other measures. Dependent measures are defined as a combination of one or more non-primary measures with one or more primary measures whose effective uptake and/or operation is dependent on a number of intermediate pathway factors. The dependency can be two directional i.e. both measures relying on each other and are therefore interdependent, or one directional whereby only one measure is relying on another measure. These intermediate pathway factors will vary between different combina-tions of non-primary and primary measures that will be discussed in Section2.2. If a non-primary measure is selected a user would then need to identify any associated primary measures through which a risk reduction can be assessed. For example, awareness raising as a measure may be broadly selected and this framework then forces the user to think about what exactly could that awareness raising entail (e.g. school edu-cation programmes and brochures) and how can it lead to the uptake and operation of one or more primary measures that are applicable in their local conditions (e.g. property level resistance). If a primary measure is selected, then utilising the framework and tracing back through relevant pathways, a decision-maker will be prompted into considering whether other improvements might be necessary or desirable to ensure their measure reduces the risk. If a decision-maker is considering property level protection for all houses in aflood zone, the framework can help to
identify which type of property level protection measures (active/passive resilience or resistance) and what subsequent non-primary measures are needed for effective implementation i.e. EWS (increased lead time), awareness raising (campaigns) andfinancial instruments (incentives).
2.2. Understanding the intermediate pathways
The framework assumes that non-primary measures result in the implementation of primary measures. However, often this implementa-tion will not be fully effective i.e. 100% of residents/businesses will not adopt primary measures and of those not everyone will be able or willing to operationalise measures that they will have. For this reason it is necessary to understand which factors influence the effective uptake and operation of these different primary measures.
Following the selection of the interdependent measures, the relevant intermediate pathway factors between these measures can be identified from the framework (see the central diamonds ofFig. 1). Understanding and quantifying the intermediate pathway supports the calculation of the UP and OP factors. The concept of having such factors has in the past been applied for calculating the benefits of EWS (Parker et al., 2007a; Molinari and Handmer, 2011; Carsell et al., 2004; Scawthorn et al., 2006). However, herein the approach is extended to include other measures and new factors. Existing literature highlights that research is more developed for EWS andTable 1presents those factors identified
from a review of existing studies (Parker et al., 2007a; Carsell et al., 2004; Scawthorn et al., 2006) in relation to the approach developed herein. An additional factor, the proportion of the population that receives timely evacuation instruction has been added as well as whether those impacted will have access to any necessary resources to take action (e.g. sandbags, transport for evacuation). The factors in Table 1and those additional added above apply to all primary measures linked to EWS and emergency planning. Identifying these factors was more challenging in the case of risk awareness-raising and for financial and legal instruments as the approach and use of intermediate pathway factors is novel and there is likely to be more influencing factors.
Awareness-raising measures generally aim to share risk knowledge, explain the importance of being prepared for an extreme coastal event and show how people could prepare and respond. For example, four workshops were conducted across flood prone households in Rhine catchment in Germany, which successfully targeted at least 600 people that promoted precautionary behaviour (ICPR, 2005). However, the correlation between this non-primary measure and the experienced increased uptake in precautionary measures could not be confirmed (Bubeck et al., 2012a). Such awareness-raising programmes are usually targeted at a specific group or groups of people within the community and the information shared should be tailored to their specific needs. However, only a portion of those targeted will be informed of their risk and willing to adopt measures. This was the basis for defining the in-termediate factors for awareness raising, as shown inFig. 1. Furthermore, the proportion of the population that are required or incentivised to take measures via legal orfinancial instruments is also expected to influence the willingness to adopt measures.
These intermediate pathway factors will differ depending on the primary and non-primary measures selected and the specific enhance-ments made. For example, improving the coverage of the coastal EWS (non-primary measure) will mean that a higher percentage of the pop-ulation will be warned, which may therefore lead to improved operation of those primary measures that have associated OP factors, but in this scenario all other aspects of the EWS would remain the same (lead time, accuracy etc.). Therefore, the change in OP will be determined by this change only. However, there will be situations when more than one improvement will be planned. Also improving the warning response through engaging local volunteer groups may impact upon another pathway factor, the percentage of the population available and able to respond and, as such, will also affect the OP factor.
2.3. Influencing variables and threat/coping appraisal
This framework tries to address the complex social processes involved in human behavioural responses to non-primary measures, in this case, emergency planning, coastal EWS, risk awareness raising activities and financial and legal instruments. To do this, influencing variables are identified from the literature as those that affect the intermediate pathway factors and in turn influence the effective uptake and operation of the measures.Table 2provides an outline of the influencing variables selected in this approach and their indicative influence on selected in-termediate pathway factors, UP and OP factors based on a litera-ture review.
The scientific background for the selection of these variables was based on, amongst other literature, social vulnerability indices and in-cludes those aspects that have been found to influence pre-event DRR uptake and implementation, risk awareness and understanding and during event response behaviour. Methods to quantify the social vulnerability using census and ex-anteflood data include the Social Flood Vulnerability Index (SFVI) in the UK, see (Tapsell et al., 2002), in the United States (Cutter et al., 2008; Flanagan et al., 2011; Rygel et al., 2006). The influencing variables as shown inTable 2, were identified
based on the abovementioned indices and other indices for assessing vulnerability and resilience (Morrow, 1999; Chandra et al., 2010; Balica et al., 2009). This framework supports Protection Motivation Theory (PMT) which outlines that threat and coping appraisal are the key ele-ments for initiating behavioural adjustment to floods (Rogers et al., 1983). Threat appraisal is a combination of the perceived probability and the perceived severity of the hazard, and therefore is considered to be the degree to which people feel that they will be impacted by the conse-quences of the threat and to what degree. Coping appraisal is a combi-nation of perceived self-efficacy, response efficacy and response costs. Perceived self-efficacy is ones belief that they can adopt a relevant measure and operate it appropriately. Perceived response efficacy is ones' belief that the response measure will be effective. Perceived response costs is a person's perceived estimation of the costs to effectively imple-ment the measure.Grothmann and Reusswig (2006)uses PMT to explain
Table 1
Intermediate pathway factors for estimating the Operator (OP) factor.
Literature Selected Intermediate pathway factors ▪ R1 Reliability of the flood warning
process: proportion of the population at risk which is warned with sufficient lead time to take action - seeParker et al. (2007b)
▪ R2Service effectiveness: (proportion/
% offlooded serviced properties that were sent a timely, accurate, and reliableflood warning) – seeParker et al. (2007b)
▪ Percentage of the population that heard the warning (default 100%) -seeScawthorn et al. (2006)
Proportion of the population that is warned with sufficient lead time [including warning understanding]
▪ PRA: Proportion of householders available to respond to a warning ▪ RA Availability: The proportion of
flooded services properties that received such a warning
▪ PHR Proportion of householders able to respond to a warning
▪ PR Ability: Proportion of householders able to understand and respond to such a warning
▪ All above cited inParker et al. (2007b)
Proportion of the population available and able to respond
▪ Fcfraction of the public that knows
how to respond effectively [and is capable of responding or has someone to help them] - seeCarsell et al. (2004)
Proportion of population that are prepared for impact i.e. know how to respond
▪ Frwfraction of the public that is willing
to respond - seeCarsell et al. (2004)
Proportion of the population willing to respond
the preparatory actions taken to avoidflood damage in Germany while
Bubeck et al. (2012b)supports PMT arguing that risk perception alone cannot explain and promote private flood mitigation behaviour. For studies focusing on risk perception which are not focused on in this framework, seeKellens et al. (2013)for an overview of empirical studies including the Psychometric Paradigm (Fischoff, 1995; Slovic, 1987), the Protective Action Decision Model (PADM) (Lindell and Perry, 2012) and Risk Information Seeking and Processing model (RISP) (Griffin et al., 1999).
Overall the following variables were identified in this framework to most likely have a negative influence on the uptake, operator and sub-sequent intermediate pathway factors; age (i.e. in particular those aged 75 years and above are less mobile), degree offinancial deprivation, tenure (i.e. those living in rental accommodation are less likely to be available to respond), transient populations, tourists/non-native speakers, level of mistrust in authorities and those in homes that have limitations for successfully implementing measures, seeTable 2. On the other hand, variables such as the existence of family or community structures/networks and those with highflood (and hazard) experience would be expected to positively influence the UP, OP and intermediate pathway factors. The details on the influencing variables and intermediate pathway factors (shown in italics) expected to be influenced are shown in
Table 2. Although inTable 2indicative influences are provided (e.g. negative or positive), it is acknowledged that there is contrasting litera-ture depending on the circumstances. Context specific factors can easily change this direction of influence and it is highly recommended that users should consider the specifics of their case and the measures selected as both types of influence are possible. For example, although older populations may require additional assistance during events, if coping on their own there may be low damages saved or few evacuated, however, in situations whereby vulnerable groups are effectively targeted for assis-tance there is evidence to suggest higher numbers of evacuees or increased damage saving (Parker et al., 2008). Other variables that may have an influence but are not highlighted inTable 2 include: gender, accessibility to communication and transportation (Balica et al., 2009), family structure (single-parent households, large families) (Tapsell et al., 2002; Heinz, 2002), education (literacy rates), unemployment, non-car ownership, overcrowding (Tapsell et al., 2002), and ethnicity. Further-more the characteristics of the flood event itself will influence the behaviour uptake of measures e.g. if the event happens at night or during the day, and if it is fast or slow rising water (Parker et al., 2007a).
To use the framework, the appropriate intermediate pathway factors between the non-primary and primary measures should be identified in
Fig. 1. Based on these factors the user should review the list of influencing
variables and consider which ones are particularly relevant in their context based on expert knowledge, census data and ideally local in-terviews. For example, taking a hypothetical case, the area where the planned DRR measures (e.g. awareness raising leading to property resistance measures) has a high proportion of the population over 75,
Table 2
Overview of influencing variables and their indicative influence on intermediate pathway, Uptake (UP) and Operator (OP) factors.
Influencing variables Assumed influence on intermediate pathway factors UP OP Evidence Elderly (aged 75þ)
Mobility and health issues can influence older people's access to warning information (e.g. hearing problems), availability and ability, access to resources (e.g. transport) and willingness to respond (e.g. reluctance to evacuate).
↓ ↓ Older populations may require assistance due to potential mobility and health issues or a reluctance to evacuate (Brunkard et al., 2008; Jonkman et al., 2009; Wood et al., 2010; McGuire et al., 2007). Above 75s are more likely to have health problems (Tapsell et al., 2002).
Financial deprivation
People with a low income are less likely to have thefinancial resources to implement measures can influence their willingness to uptake measures.
↓ ↓ Structural maintenance and mitigation initiatives are often out of reach for low-income households (Tapsell et al., 2002; Morrow, 1999; Burton and Cutter, 2008; Wisner et al., 2003; Kelly and Adger, 2000). Financial incentives can
help with the costs of implementing measures increasing the willingness to uptake.
↑ ↑
Rental occupied
A lack of responsibility among rental property residents could mean that they are less accurately informed of flood risk and willing to uptake measures, and less likely to know how, and be willing to, respond operationally.
↓ ↓ People with non-home ownership (Tapsell et al., 2002) or rental properties have a higher social vulnerability because of limited responsibilities (Morrow, 1999; Heinz, 2002; Wood et al., 2010). Highflood (and hazard) experience
Those with more experience of events are more likely to be prepared forflooding, implementing measures more effectively, and willing to uptake measures and respond.
↑ ↑ Those with more experience are more likely to respond to warnings (Parker et al., 2007a; Kreibich et al., 2005) and implement privateflood mitigation measures (Bubeck et al., 2012a)
High proportion of transient population
Second home owners are less likely to receive a warning, and be available and able to respond.
↓ ↓ Transient populations are more vulnerable (Morrow, 1999; Cutter et al., 2000) and are less likely to have access to warning information (via. FloodLine) (Twigger-Ross et al., 2009). High proportion of tourists/ non-native speakers Tourists/non-native language speakers will be less likely to be warned sufficiently and less accurately informed offlood risk due to language limitation. ↓ ↓ Local language proficiency makes disaster preparedness and response communication difficult (Morrow, 1999; Peguero, 2006). Poor attitudes/ trust in authorities
Areas which have lower trust in authorities are less likely to be willing to respond operationally or uptake measures.
↓ ↓ e.g. Trust in warnings (Mileti, 1995) Existence of family or community structures/ networks
Strong social networks can influence the willingness of the community to respond and uptake measures because they are positively influenced by their actions.
↑ ↑ Social setting factors affect beliefs, decisions, and response (Lindell and Perry, 2012; Mileti, 1995) Table 2 (continued ) Influencing variables Assumed influence on intermediate pathway factors UP OP Evidence House type limitations/ technical feasibility
House type limitations may influence the amount able to respond and that have access to the resources. Some households cannot move assets to a higher floor because it is single story and certain measures may not be applicable for certain house types.
↓ ↓ Mobile homes will be easily destroyed in an event and property level protection would not be useful (Cutter et al., 2000). Buildings with only one storey usually experience greater (relative) damage than houses with several storeys (Parker et al., 2007a; Messner and Meyer, 2006)
who arefinancially deprived, with high flood experience. In this situation the over 75 aged group may require additional assistance to operate the measures and those financially deprived would require financial in-centives even though they have high flood experience and desire to implement measures. An understanding of the influencing variables and threat and coping appraisal, are used to support the estimations of the baseline intermediate pathway factors values (i.e. before measure implementation) and post implementation values. So in the example above, the variables would influence the percentage of the target popu-lation that is accurately informed offlood risk and the percentage willing to take the measures before the event. Further details on estimating values for the intermediate pathway factors and subsequently the UP and OP factors is explained in the following section.
2.4. Estimating the uptake and operator factors
Data fromflood surveys can prove helpful to estimate these inter-mediate pathway factors. For example, those in Germany (ex-post after the 2002 and 2013floods (Kreibich et al., 2005; Thieken et al., 2016), ex-ante in 2011 (Bubeck et al., 2012a)), the UK (ex-ante in 2006 and 2014 (Langley and Silman, 2014; Ipsos, 2006), ex-post after the 2006 and 2007 events (Ipsos, 2008; Environment Agency, 2006)) and Australia in 2007 (Molinari and Handmer, 2011). For the intermediate pathway factors related to early warning,Molinari and Handmer (2011)found that 40% of the surveyed population that experiencedfloods heard the official warning, in Gippsland Australia and 74% in Maitland Australia. While
Parker et al. (2007a) suggests that the percentage of the population receiving a warning is unlikely to exceed 40%. In terms of abilities to respond to a warningParker et al. (2007a)notes that the proportion of households being able to respond ranged from 73 to 85% and between 55 and 64% are available to respond. In 2008–2009, 55% of people living in flood risk areas in the UK knew they were at risk (Environment Agency, 2009). The Scottish Environment Protection Agency (SEPA) research (Flood Aware project, 2013) found that 30% of the target audience of a “roadshow” awareness raising programme for at risk communities, took preparedness action before aflood event and 96% said that they would take actions after the completing the “roadshow” awareness raising programme. It was also found that 75% learnt how they could protect their property from the risk offlooding. Such studies on the effectiveness of awareness raising activities are rare, making it difficult to estimate the associated intermediate pathway factors. It is also recognised that in-tentions may be high directly after such awareness raising activities but reduce over time. Understanding the social characteristics of the target population and their expected behaviour toflood preparedness activities can offer further insight into potential values for these intermediate pathway factors. However, the difficulty of estimating these values is acknowledged and it is recommended that users utilise conservative es-timates (if based on expert judgement) or use a maximum or minimum estimate to identify a range of values. Furthermore, caution should be exhibited if transferring values temporally, even to the same area, as circumstances may have changed in the interim.
An example hypothetical application of the framework for the installation offloodgates following an awareness campaign is examined to highlight how the different variables are combined (seeBox 1). Firstly, the UP factor or the percentage of the population that haveflood gates is estimated based the best available data. In this case it is assumed that we are starting from a baseline of no properties having these measures and therefore UP is 0% and thus 0% is operated effectively. Next the potential improvement of uptake and operation should be estimated based on the intermediate pathway factors. In this hypothetical case, it is assumed for the intermediate pathway factors, that 100% of the population were targeted with an awareness raising campaign, of those 60% were informed of theirflood risk (i.e. received and understood the informa-tion), however only 15% of those are willing to adopt measures (this may be for any of the reasons outlined in Section2.2). This therefore leads to an UP factor of 9% of the overall population who will havefloodgates.
Secondly there is the question of operation and of all thosefloodgates purchased how many were able to operate the measure effectively. This includes applying the intermediate factors of those who received a warning in sufficient time (90%), were available and able to take action (90%), had access to the necessary resources (100%) and were willing to respond (100%), leading to an OP factor of 81%, to the population who have adopted this measure. These percentages are assumed to be high in this case because often a floodgate will only need a short time to implement and are likely to be adopted by those willing and able to respond, the critical variable therefore in this example is whether they received a warning in sufficient time and reliance on a EWS. Thereby, multiplying those percentages together we obtain the value of the 7.3% of all households (within the receptor group identified) will effectively implement aflood gate and reduce their damages.
Some data on UP and OP factors can be estimated directly from the literature for specific measures, which could be helpful for validation of the range of possible percentages. However, this only provides one value instead of going through the process of understanding how to estimate such a factor, using the intermediate pathway factors, thereby potentially lacking the full consideration of elements that require adjustment.Parker et al. (2007a) presents results from a survey of residents that were flooded in events from September 2000 to August 2004 in the UK and found that 83% of moved valuables upstairs or to a safe places, 61% moved cars and 63% used sandbags i.e. OP factors. However, it must be recognised that the flood warning service in the UK has advanced whereby users receive a severe weather warning in advance of aflood warning, thus giving them more time to respond. These new circum-stances may influence these values. Furthermore,Clarke et al. (2015)
estimates that UP is 8% in England and Wales, whereby warning inde-pendent resistant measures is 3% and 5% for warning dependant resis-tance measures, although this is not explicitly for coastal areas. Research conducted byKreibich et al. (2005)found that from a randomly selected sample of households that experienced the 2002 Elbefloods in Germany, only 9% had installed their heating and other utilities in higher storeys, 7% had water barriers available and only 6% had a flood adapted building structure before the event i.e. UP factors (Kreibich et al., 2005). This shows the relatively low values for possible UP factors in compari-son to OP factors and will vary considerably depending on whether the measure is a passive, active, or early warning dependant measure. This kind of data can help to verify or check estimates for UP and OP factors found for the particular application case.
It must be acknowledged that a lot of this available data on UP, OP and intermediate pathway factors is based on UK and German literature, which may not be applicable in all cases. It is advised that this is used with caution as it relates to specific events and situations whereby its applicability should be judged. Special attention should be taken when using the term“percentage/proportion of the population” because in some cases this may be the proportion of population at risk within an identified area (where a flood has taken place) or a random selection of the population. Other sources of data could include, local post disaster studies and literature and expert judgement based on previous events or the specific context conditions.
2.5. Incorporating the framework in risk assessment
A risk assessment is primarily established by the relationships be-tween the hazard, exposed receptors and their associated vulnerability to estimate the impact for a given event. Depth–damage functions are the most commonly applied method to represent the vulnerability of the receptor (Messner and Meyer, 2006; Meyer et al., 2013). Flood depth is treated as the determining factor for assessing the expected damage but is sometimes complemented by other parameters like velocity and duration (Messner et al., 2007; Merz et al., 2010a). For a givenflood depth, the function gives expected losses to a specific receptor (e.g. buildings, infrastructure), either as a percentage of a pre-defined asset value or directly infinancial terms, (Jongman et al., 2012; Merz et al., 2010b).
Depth-damage curves are constructed using empirical damage data or expert judgement or“what if” scenarios (Jongman et al., 2012; Merz et al., 2010b).
To incorporate risk assessment in this framework depth-damage curvesfirst need to be adjusted or shifted to take into account the loss reduction associated to certain primary measures, see (Thurston et al., 2008; Viavattene et al., 2015) for depth-damage curves for property level resilience and resistance measures. Depth damage curves have also been adjusted to take into account specific lead times of warnings, see (Carsell et al., 2004; Scawthorn et al., 2006) but this is not considered here. Primary measures affecting the nature of the receptor such as land use changes simply require that the depth-damages curve used in the assessment is replaced. Another option instead of adjusting the depth-damage curves is to use an empirical overall depth-damage reduction factor that considers the reduction in the cost of damages due to the imple-mentation of a measure, usually calculated from ex-post surveys. Thur-ston et al. (2008) found that installing temporary resistance measures (e.g. temporaryflood guards and airbrick covers) reduce the costs of damage from between 47 and 53%. Research conducted byKreibich et al. (2005)found thatflood adapted use, adapted interior fitting as well as the installation of heating and electrical utilities in higher storeys reduced the mean damage ratios of buildings by 46%, 53% and 36%, respectively.Parker et al. (2007a)suggest that raising and evacuating contents leads to a 5% reduction in overall damages whileScawthorn et al. (2006)assumes that the maximum reduction in damage to content is 35%.
The adapted depth-damage curve should be applied to the proportion of the receptors who uptake and/or operate the associated primary measure effectively i.e. the UP and/or OP factors. For the case outlined in
Box 1, the reduction in damages could be calculated by using an adapted vulnerability relationship with aflood gate, if available, for 7.3% of the receptors and the original depth-damage curve would be applied for the remaining 92.7%. Otherwise an empirical reduction factor such as 50% based onThurston et al. (2008), could be applied to 7.3% of the houses. Our framework aims to beflexible enough so that the estimation of the UP and OP factors can be integrated in multiple forms of risk assessment. 3. Framework application
The framework was broadly applied within the RISC-kit project (van Dongeren et al., 2016) across 10 case study sites to assess the risk reduction of primary and non-primary measures. Each case study iden-tified appropriate potential DRR measures together with local stake-holders and often included both primary and non-primary measures. In this section we draw on two selected examples of Varna Bay, Bulgaria (coastal EWS) and Praia de Faro, Portugal (risk awareness raising meetings) to present an application of the framework within a coastal risk assessment.
3.1. Coastal early warning system in Varna Bay, Bulgaria
For this application in Varna Bay, Bulgaria a coastal EWS is selected
that provides impact-based storm forecasts through user-friendly communication mediums, seeValchev et al. (2016)for details on the forecasting component. Varna Bay has experienced extreme historical storm surges, large waves and coastal erosion (Valchev et al., 2012; Trifonova et al., 2012; Galabov et al., 2015), causing damages to tourist beaches, ports, coastal structures, restaurants, beach bars, shops and leisure facilities (Stakev, 1980; Andreeva et al., 2011). For this reason, the non-primary measures identified include, improved operation of raised contents by restaurant owners and staff (e.g. terrace furniture), and sports clubs/shops owners, staff and members (e.g. surfboards) and movement of cars out of car parks, however these are hampered by the lack an effective coastal EWS.Fig. 2highlights the associated pathway through the framework that combines to estimate the potential differ-ence to the OP factor due to coastal warning improvements. Data on response to warnings in Bulgaria is limited, therefore literature from elsewhere (Parker et al., 2007a) were used to provide baseline values for the intermediate pathway factors and combined with locally collected data (8 interviews) to refine and validate these estimates with local business owners and staff. These interviews highlighted the importance of the following influencing variables for understanding the local context and justifying the selection of values for the intermediate pathway fac-tors: past experience, transient population, attitudes/trust in authorities, house type/feasibility and community networks.
The business and restaurant owners have varying levels of flood experience depending on the length of the business establishment, staff contracting periods, and their specific location at the beach. Many re-spondents reported poor experiences in previous events, with a lack of timely weather warnings and poor emergency support. There is currently no impact-based storm forecast and it could be argued that the public may not trust storm warnings if provided by the same weather author-ities. There is a strong community network in the beach area amongst businesses who share weather forecast and response information. Many of the restaurants are single storey buildings making it difficult to store furniture while the surf clubs need members to collect and transport the surfboards, making their response actions more challenging. Further-more, many businesses and restaurants work on a seasonal basis and may be unavailable to take action during winter.
Box 2outlines the estimation of the OP factor for Varna Bay, Bulgaria. Considering the strong social networks between business owners, and the longer lead time of the storm forecast, the proportion of the businesses that receive warnings is expected to increase by a maximum of 20%.
Parker et al. (2007a)estimates 40% of people will receive a warning (UK based research) and this is cautiously assumed to be the baseline value. The baseline percentage of businesses available and able to respond is assumed to be 70% in line with the range found byParker et al. (2007a), this recognizes the physical abilities of staff, but also the potential storage and transport limitations. Only a small increase up to 80% is expected with an improved warning due to the necessity of a longer lead time required to collect surfboards or drive to businesses if the storm happens on a non-working day or off season. It is assumed that there is sufficient access to resources to complete response effectively. This is coupled with the reported low trust in authorities and interviewees suggestion that Box 1
Estimating the Uptake (UP) and Operator (OP) factor for an active property levelflood resistance measure e.g. flood gate:
UPbaseline¼ % of population that own the measure ¼ 0%
UPpost ¼ % targeted (100) * % informed of flood risk (60) * % willing to respond (15) ¼ 9%
OPbaseline¼ % of the population that operate the measure effectively ¼ 0%
OPpost ¼ % warned (90) * % available and able (90) * % access to resources (100) * % willing to respond (100) ¼ 81%
they may not believe a new warning as a result. Therefore, we have estimated only a 10% increase in the baseline value, to 80% with the establishment of the coastal EWS.
Utilising these values the OP post value is calculated as 38% (seeBox 2) which is in line with existing estimations (Parker et al., 2007a) and comparable with estimates from local interviews undertaken in Varna Bay. The increase is estimated at 18% which although is double the baseline, is still acknowledged to be quite low. This highlights the diffi-culty in really making a difference on impact locally and the constraints to warn residents and business owners effectively to adjust their threat appraisal. Not only must the forecast be improved further, but trust should be built among the authorities and business owners for an improved translation of forecasts into effective action.
To estimate the specific changes in damages, depth-damage curves were used for each receptor group (Dimitrov et al., 2013) and applied in a Bayesian Network analysis, seeJ€ager et al (2017)for more details that are out of the scope of this paper.
The pathway of (inter)dependent measures highlighted in this application is quite straightforward, however, if one was to consider the additional role of other non-primary measures like flood insurance, community awareness raising and emergency management, additional pathways could be utilised adding further complexity to the OP factor calculation. This could also result in additional primary measures being selected that require an UP factor calculation. It is recognised that the estimated factors were based on a range of sources including; existing data from elsewhere, expert judgement and a limited number of in-terviews, thereby their applicability might be queried. Despite this, these are the best available data for this case and present the reality of applying the framework. Furthermore, there is consistency between the data uti-lised for the baseline and post measure implementation situations, and as such comparability is maintained, permitting a before and after assessment.
3.2. Risk awareness raising, Praia de Faro, Portugal
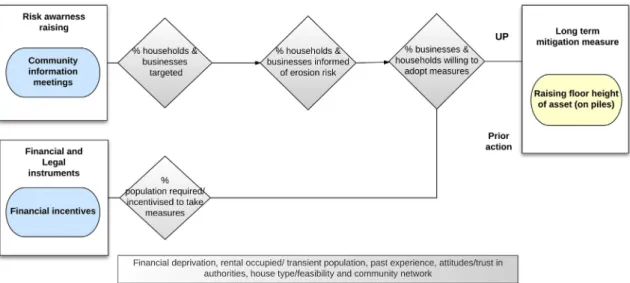
In Praia de Faro, Ria Formosa, Portugal, the framework application shows how it can be used to identify the necessary non-primary mea-sures, to increase the implementation of primary measures. Praia de Faro is a settlement spread along a 5 km shoreline within a sandy peninsula (Anc~ao). The central 2 km are densely urbanised and populated, which has been exposed to storms causing substantial beach erosion and
water-related damage to properties. Both ends of Praia de Faro are occupied by fisherman communities characterized by small and fragile buildings mostly used as first residences. Raising the level of households and businesses by placing them on piles is identified as a feasible primary measure for reducing erosion damage to buildings in the area. By using the framework, it is clear that awareness raising andfinancial incentives are needed to ensure such measures are implemented effectively. Raising the risk awareness of the population is particularly important as the re-lationships between stakeholders (e.g. city council, regional agency of the environmental protection, civil protection and residents) is very weak (Costas et al., 2015). Therefore, information meetings could be used to improve risk communication and awareness between the authorities and local stakeholders.
The relevant intermediate pathway factors for this primary measure are outlined inFig. 3. The house raising requires only an UP factor as it is a permanent measure. To understand the influencing variables and es-timate the intermediate pathway factors expert knowledge and existing literature was used. As in many other cases, no local studies have been completed to provide UP factors and time constraints meant that specific interviews were not possible. Yet, interviews were conducted with a number of stakeholders byCostas et al. (2015)within the project time frame where some general observations were gathered and used to better evaluate the effectiveness of such measures.
Based on expert judgement, the following influencing variables; financial deprivation, rental occupied/transient population, past expe-rience, attitudes/trust in authorities, house type/feasibility and com-munity network, were considered particularly important to build arguments for the intermediate pathway factor estimates. Thefishermen have a lot of experience when dealing with coastal inundation and erosion and as this part of community is close-knit; they would assist each other to operate measures. However,financing is a factor as they tend to have a lower income and therefore do not have the resources to uptake the proposed house raising measures by themselves. Even among busi-nesses (bars, restaurants) that could have a betterfinancial situation to afford property-raising, uptake is currently low due to a lack of knowl-edge and inclusion in the local planning and decision making process. Furthermore, this area has a very high proportion (74%) of second home owners, rented to students during the winter, when storm events typi-cally occur. For this reason, the second home owners have less experience of coastal events and are also less likely to take measures compared to first home residents. The community is also characterized by a low trust
Fig. 2. Pathway of (inter)dependent DRR measures for Varna Bay, Bulgaria.
Box 2
Operator (OP) factor for coastal EWS in Varna, Bulgaria:
OPbaseline¼ % warned with sufficient lead time (40) * % available and able (70) * % access to resources (100) * % willing to respond (70) ¼20%
with the authorities caused by historical tensions and therefore any risk awareness or information meetings would aim to build trust.
Box 3outlines the estimation of the UP factor for house raising in Praia de Faro, Portugal. Currently, in the baseline situation, there are no buildings that have been raised and strengthened to protect against erosion, resulting in a UP baseline value of 0%. To estimate the per-centage of households that will take up the measures after the meetings, the percentage that are targeted, informed of erosion risk and willing to uptake the measure, are estimated. All households would be invited to the meetings but based on past experiences, it is expected that only approximately 50% will successfully attend due to the high percentage of second residence homes and limited participation of renters.
Of those who attend, although very difficult to estimate, it is expected thatfirst home residents are accurately informed of the coastal risks after the meeting, based on their knowledge from previous events. However, new or occasional residents may not absorb this information after the first meeting but would be expected to improve after the subsequent meetings. Thus the proportion of those targeted who are informed of erosion risk is estimated as slightly less than the total number of at-tendees (i.e. 40%). Next, the percentage of households willing to take up this measure is estimated much lower at 20% given the constraining high cost of the measure and lack offinancial incentives for the poor fishermen communities. However, businesses may be more willing given their higherfinancial capacity and new knowledge gained from the awareness meetings. This results in an uptake factor of 8% which is supported by expert judgement from local researchers. To calculate the damage reduction for erosion, the Bayesian Network Analysis is used supported with the work ofCiavola et al. (2011), seePlomaritis et al. (2017)for more details on the coastal risk assessment.
Overall, this application of the framework shows the interdependence between non-primary measures and the applicability of the framework to start from a primary measure such as house raising. Although awareness raising meetings could be put in place to inform households and business of their risks, to be fully effective, efforts to improve the access to financial incentives (i.e. afford the house raising) are required. It is acknowledged that the estimated values in this application could vary significantly if additional local context specific data were collected. Furthermore, to the author's knowledge, there is very limited interna-tional literature to define and support the estimation of intermediate pathway factors related to risk knowledge transfer and how it propagates to effective actions. This framework was considered sufficient, as at a minimum it brings the importance of considering these factors into the discussion on DRR measures and the various aspects that influence loss reduction. Considering the low percentages used in this application, no
matter how many information meetings are completed to transfer risk knowledge, it is still difficult to translate this risk knowledge into action at the household or business level due to the high costs involved. Thus the‘response costs’ component of coping appraisal plays a dominant role in determining their ability to be prepared for coastal risks.
4. Discussion
4.1. Challenges and future research
A current limitation of the framework relates to the level of applica-tion. The current focus is on primary measures at an individual or household level and does not include other primary measures taken at a managerial level by the public and private sectors. This could include; maintaining watercourse capacity before an event and operating larger flood defences (e.g. closing gates, barriers) by water authorities or acti-vating emergency plans and conducting search and rescue/evacuation activities by emergency services, seePriest et al. (2011). Furthermore, the approach presented is limited to individual/household level ap-proaches and neglects the connectivity and dependency upon hazard influencing measures (e.g. coastal defences) undertaken at different levels (e.g. local, regional or national). However, further research aims to extend the approach to address some of these gaps.
There are also challenges related to capturing all of the complexities within the (inter)dependencies as well as clearly establishing the impact of influencing variables. The non-primary measures do not explicitly address internal knowledge, capacity and resource needs within relevant coastal authorities, all of which can directly influence the success of other non-primary measures (such as EWS and risk awareness raising). Such influences could form another layer, which is not considered in this framework. Additionally, the framework might be extended to consider other direct and indirect damages in the impact assessment (e.g. loss of life, health impacts and business disruption) including scope to couple the approach with more detailed modelling techniques, such as evacua-tion modelling.
The temporal aspect of the DRR measures is lightly addressed in the current framework but could be further developed especially if it is extended to consider a broader range of DRR measures. The timing of the implementation of awareness campaigns or EWSs can be critical in determining the effectiveness of the primary measures and hence, risk reduction. The influencing variables and threat/coping appraisal is pur-posely addressed quite loosely within the framework to ensure that there is sufficient flexibility and scope for users to consider which influences are relevant. Indeed, there may be instances where some factors have a
positive and others a negative impact. However, a shortcoming of this flexibility is that it might be difficult for some users to grasp and oper-ationalise these concepts.
The DRR measures presented in the current framework were limited to those aimed at coastalflood (and erosion) mitigation, preparedness and response due to the nature of the study sites. In any case, it is difficult to consider all possible primary measures for a given non-primary mea-sure and therefore although a more generic framework has been pre-sented, it is challenging to produce an exhaustive list of measures. For example in Varna, some of the restaurants havefinancial and property resistance measures in place that offers them additional protection so even if they do not respond to the coastal EWS and move their assets they will be protected. However, DRR measures for multi-hazard risk reduc-tion could be addressed within the framework with some adjustments to the intermediate pathway factors and influencing variables.
Data with which to apply a framework of this nature will always be problematic and might be improved through increased primary survey data collections similar to those undertaken in the UK and Germany, e.g.
Kreibich et al. (2005) and Ipsos (2008). As mentioned a small number of interviews assisted in the process in Varna, and undertaking such in-terviews in the Praia de Faro case would have better supported the expert judgement based estimations. Furthermore, the differences between the proposed coastal EWS and the existing warning information should be clearly defined to determine and justify the OP factors.
4.2. Wider applicability and usefulness
This framework provides a useful tool for decision makers when identifying, evaluating and selecting DRR measures. It extends the work ofClarke et al. (2015)andParker et al. (2008)to include wider range of DRR measures aside from moving and raising assets, and highlights the (inter)dependency between multiple types of DRR measures. The framework demonstrates the importance of addressing the social, phys-ical and economic problems, which in many cases may be a greater challenge than selecting technical measures (Biesbroek et al., 2010).
The connections between multiple DRR measures and their depen-dence on multiple intermediate pathway factors can be easily overlooked in an ‘engineering’ dominated risk reduction plan. The intermediate pathway and UP/OP factors have been used in previous research (Parker et al., 2007b; Clarke et al., 2015) while this framework aims to broaden and interconnect those applications in a wider sense. It is designed in a way that a user can integrate the framework with many types of risk assessment tools to include these (inter)dependencies. However, it does not aim to replace more detailed impact modelling such as evacuation or loss-of-life modelling, which also considers many reduction factors.
From a policy perspective, goals, targets and indicators are being put in place to monitor the effectiveness of DRR (UNISDR, 2015) and sus-tainable development (United Nations, 2015) activities globally. The Sendai Framework for DRR, global Target G relating to EWS, has the following indicators, as defined by the UNISDR Open-ended Intergov-ernmental Working Group on Indicators and Terminology (UNGA, 2016): ▪ Number of people per 100,000 that are covered by early warning information through local governments or through national dissemination mechanisms (Target G, indicator G-3);
▪ Percentage of local governments having a plan to act on early warnings (Target G, indicator G-4);
▪ Percentage of population exposed or at risk from disasters pro-tected through pre-emptive evacuation following early warning (Target G, indicator G-6).
Although these indicators are not directly comparable to the factors identified in this research, governmental efforts to monitor indicators show a very positive trend towards collecting such data at a national level. This offers an opportunity for researchers, policy-makers and practitioners to develop joint methodologies, which support relevant data collection, at a more refined level for national and local level de-cision-making.
The framework brings to the surface the importance for a decision maker to understand the role of individual household or business scale measures and the influencing social, economic or physical variables, which must be sufficiently addressed when selecting DRR strategies. The framework highlights the importance to engage these homeowners and businesses in the planning process and encourage them to manage their own risk, as they are the ones that uptake and operate a significant proportion of the measures. The framework outlined isflexible enough for any user to consider the scale relevant for a particular planning process e.g. local, regional, and national, and always take into account the individual level measures required for successful implementation of any DRR measure. If not, the actual damage savings might be quite low and it is hard to influence.
5. Conclusions
This research outlines a framework to systematically account for the (inter)dependencies between DRR measures in coastal risk assessment. It does so by distinguishing between primary (i.e. direct influence) and non-primary measures (i.e. indirect influence) on risk reduction. It strengthens previous research to understand the intermediate pathway factors and associated limiting variables, to quantify the effective uptake and operation of primary measures for inclusion in a risk assessment. The applications of the framework in Portugal and Bulgaria highlight the importance of targeted awareness raising activities to build risk knowledge, trust and willingness among relevant stakeholders and encourage successful up-take and operation of property level measures. Both applications high-lighted the difficulty to significantly increase the uptake or operation of measures at the building scale, thereby constraining the potential risk reduction effect for coastal risk management. Without proper consider-ation of the interdependent pathways, the risk reduction effects of measures are limited.
Despite the challenges of utilising an approach of this nature, the framework does permit an initial consideration of the complexities and (inter)dependencies between multiple DRR measures and what is required for implementing effective approaches. It offers a step in the right direction to enable and encourage decision-makers, coastal man-agers, engineers and researchers, to identify the contextual and behav-ioural factors that will ultimately influence the effectiveness of DRR measures and support their selection of optimal strategies. Further research is also needed to understand and integrate the layers of complexity between interdependent DRR measures and intermediate Box 3
Uptake Factor (UP) for raising house level to protect against erosion in Praia de Faro, Portugal:
UPbaseline¼ % of households/businesses that own the measure ¼ 0%
UPpost¼ % targeted (100) * % informed of erosion risk (40) * % willing to adopt measure (20)