Boletín de la Asociación de Geógrafos Españoles, 76, 102-130 ISSN: 0212-9426
DOI: 10.21138/bage.2517
Cita bibliográfica: García-Palomares, J. C., Sousa Ribeiro, J., Gutiérrez, J., & Sá Marques, T. (2018). Analysing proximity to public transport: the role of Street network design. Boletín de la Asociación de
Geógrafos Españoles, 76, 102-130. doi: 10.21138/bage.2517
Analysing proximity to public transport:
the role of street network design
Analizando la proximidad al transporte público:
el rol del diseño de la trama urbana
Juan Carlos García-Palomares
Departamento de Geografía Humana Universidad Complutense de Madrid (España)
João Sousa Ribeiro
Departamento de Geografia Universidade do Porto (Portugal)
Javier Gutiérrez
Departamento de Geografía Humana Universidad Complutense de Madrid (España)
Teresa Sá Marques
Departamento de Geografia Universidade do Porto (Portugal)
Abstract
The proximity of homes and employment to public transport networks is a key factor in explaining ridership. One of the most frequent strategies for increasing proximity to public transport is to densify the immediate station environment. However, proximity can also be created through the design of the street network in new urban developments. This article analyses the impact of urban design on public transport network coverage and its potential demand by comparing the real situation of the Madrid Metro network with four hypothetical scenarios representing different types of street network: irregular with high density, irregular with low density, orthogonal and station-oriented. By keeping the distribution of population and employment constant, the differences between the real scenario and each of the hypothetical ones can be explained entirely by the role played by the design of the urban fabric. A series of indicators have been calculated to measure the extent of the impact of street network design on the proximity to public transport: surface of the coverage areas, population and employment covered according to proximity bands, access quality and potential demand. The results obtained show that the station-oriented street system would lead to a substantial increase in population and employment in the first coverage bands, thereby generating a highly significant increase in the potential demand for public transport.
Key words: urban design; public transport; accessibility to stations; coverage analysis; potential demand.
Resumen
La proximidad de los hogares y el empleo a las redes de transporte público es un factor clave en el uso final de las mismas. Una de las estrategias más frecuentes para aumentar la proximidad al transporte público es densificar el entorno de las estaciones. Sin embargo, también se pueden generar proximidad en los nuevos desarrollos mediante el diseño de la trama urbana. En este artículo se analiza el impacto del diseño de la trama urbana en la cobertura de la redes de transporte público y en su demanda potencial mediante la comparación de la situación real de la red de Metro de Madrid con cuatro escenarios hipotéticos, que representan diferentes tipos de red viaria: una red irregular de alta densidad; irregular de baja densidad, ortogonal y un viario orientado a la estación. Para ver el efecto de la trama urbana, se mantienen las distribuciones de la población y el empleo constante, de manera que las diferencias entre el escenario real y cada uno de los hipotéticos se explican únicamente por el papel desempeñado por el diseño de la trama urbano. Para medir la magnitud del impacto del diseño de la trama urbana en la proximidad al transporte público se han calculado una serie de indicadores: la superficie de las áreas de cobertura, la población y el empleo cubiertos de acuerdo a las franjas de distancia, la calidad de acceso y la demanda potencial. Los resultados obtenidos muestran que una trama viaria orientada a la estación daría lugar a un aumento sustancial de la población y el empleo en las primeras franjas
de distancia, lo que genera un aumento significativo en la demanda potencial del transporte público.
Palabras clave: diseño urbano; transporte público; accesibilidad a las estaciones; análisis de cobertura; demanda potencial.
Agradecimientos: The authors gratefully acknowledge funding from the Spanish Ministry of Economy and Competitiveness and European Regional Development Fund (ERDF) (Proyect TRA2015-65283-R).
1 Introducción
One of the key factors in public transport use is proximity to bus stops or stations. As most users access public transport on foot, the more people who live and/or are employed in close proximity to transit, the greater the likelihood the service will be used (Murray et al., 1998). In fact, literature shows there is a significant decrease in the use of public transport as walking distance to bus stops or stations increases (O’Sullivan & Morrall, 1996; Talavera-García & Valenzuela-Montes, 2012; García-Palomares, 2013). Researchers and planners have tried to estimate potential demand, both at existing and proposed stations, from coverage analysis. Coverage analysis calculates the amount of population and employment at certain threshold distances from the station (as a measure of accumulated opportunities; Pirie, 1979).
Since station demand is to a large extent conditioned by the built environment, the integration of transport and land use planning is essential for the achievement of increase public transport use and sustainable development (Bertolini et al., 2005; Talavera-García et al., 2014; Soria-Lara & Valenzuela-Montes, 2014). According to the famous 3D (Cervero & Kockelman, 1997), and with Transit Oriented Developments principles (Cervero, 2004; Chorus & Bertolini, 2016), the demand for new stations will be significantly higher in areas of increasing population and employment densities. These new stations will be fostering a greater diversity and mixture of land use, and achieving an urban design that shortens distances to stations and favours pedestrian mobility. In recent years, explicit reference has been made in the 5D context, adding “Distance to nearest transit stop” and “Destination accessibility” to “Density”, “Diversity” and “Design” (Ewing & Cervero, 2010). This involves generating environments in which streets are oriented to stations, street blocks are of a size that eliminates excessive detours, street segments have high connectivity and there are wide pavements and bicycle lanes, etc. All this should be geared towards facilitating access to public transport at bus stops and stations (Litman, 2005).
Transit Oriented Development (TOD) defenders have repeatedly outlined the importance of urban design for increasing station proximity, thus incrementing station potential demand (Curtis et al.,
2009). However, up to date, these effects have not been empirically measured. The aim of this article is to measure the role of street design in network coverage and walking distance to public transport in isolation from other elements, such as density or land use diversity. This issue is of particular interest since greater coverage implies increased ridership. Until now, the role of street network design has been included in regression models that try to explain public transport demand, normally represented by street network density (Cervero & Kockelman, 1997; Gutierrez et al., 2012). However, street network density is related in part to population and employment density, which may dilute its effect. Moreover, street density does not reflect the possible orientation of streets to the stations, a key factor in the effect of this variable as coverage areas are increased and people's access to stations is made easier. Different street systems with the same network density may have different effects on service areas and station ridership, depending on whether or not the streets are station-oriented.
Some studies relate the street network with station service areas (for example, Jacobson & Forsyth, 2008; Gutiérrez & García-Palomares, 2008; Talavera-García & Soria-Lara, 2015), but a systematic analysis of the impact of the type of street network on the proximity of demand to stations has not been done so far. The main contribution of this paper is the methodology used to measure the effect of urban fabric design on the coverage and demand potential of public transport networks. We have opted to design a series of street system types that aim to reflect the models that are most characteristic of present-day metropolitan spaces. In this case, the Madrid metro system has been used as a real city transport network and all of its stations have been overlaid with each of the model street systems, using a Geographic Information System (GIS). This enables the surface area and the population and employment covered for each type of street network to be calculated and then compared with the station coverage and access quality of the city's real street system.
What this paper suggests is not an unrealistic change in current street patterns towards a station oriented street pattern. Instead, our aim is to measure the impact of different street network designs on the surrounding area of the stations taking into account current population and job distribution pattern. To do this, we take real population and employment data from existing urban areas, and simulate changes in the street pattern. As the distribution of population and employment remains constant, any differences can be explained entirely by the role of the street network design. This information on the impact of the street pattern around the stations is extremely useful to achieve an improved design in new urban developments.
To sum up, the main contribution of this paper to the existing literature on urban design in the proximities of stations is to provide evidence of the influence of the street network design around stations on potential demand. Our results also provide urban planners with a tool to measure the impact of the street network design when addressing land use and transport integrated planning in new urban developments.
The article comprises 6 sections. Section 2, which follows this introduction, is devoted to a literature review and shows the impact of distance on station access and the importance of the urban environment in reducing distance and increasing network coverage, especially the role played by urban design. Section 3 describes the study area and the data used. Section 4 outlines the proposed methodology and the indicators used. Section 5 gives the results obtained and Section 6 summarizes the final conclusions drawn from the study.
2 Background
2.1 The importance of distance in station access and coverage analysis
Distance from home or the origin of any other journey made to transit stations has a negative impact on the use of public transport. For example, Keijer and Rietveld (2000) found that the tendency to use the railways in Holland is 20% higher among people who live less than 500 metres from a station than among those who live between 500 and 1000 metres from it. Alshalalfah and Shalaby (2007) found that among transit users, 60% live within 300 metres from their stop and 80% within 500 metres. Cervero (2007) found that Californians living within one half mile (0.8 kilometres) of a transit station were four time more likely to use transit than those living between one half mile and three miles (4.8 kilometres) of transit and that dense jobs around destination stations significantly influenced the likelihood of transit use. Zhao et al. (2003) have shown that there is an exponential drop in demand for public transport with the distance walked to stops or stations. Ewing and Cervero (2010) reported a public transport demand elasticity of -0.29 for accessibility measured as distance to a public transport stop, suggesting a 10% increase in distance to a stop decreases public transport use by approximately 3%. In Madrid, the ratio of rides per person in Metro from home gradually declines with distance, from 0.55 rides per person in the first 100 metres to scarcely 0.06 at 1500 metres. Decrease is lineal and shows that the ratio of rides per inhabitant falls 6.9% with each additional 100 metres of distance (García-Palomares et al., 2013).
Other studies have calculated distances walked to access public transport to show that these vary according to groups of population, types of urban space, modes of public transport and types of station. In Sydney, for example, Daniels and Mulley (2013) found a median access distance to public transport (bus and train) of 573 metres (824 metres in the 75th percentile), while in Brisbane, Burke and Brown (2007) showed that the median distance people walked from home to public transport stops was 600 m and the median distance people walked from public transport stops to end destinations was 470 m. In Montreal, El-Geneidy et al. (2014) found somewhat shorter distances for bus, train and metro use, with an average of 375 metres and a 75th percentile of 524 metres. In Calgary, Lam and Morrall (1982) calculated the median distance to reach bus stops as 327 metres (450 metres in the 75th percentile), with greater distances in residential areas than in industrial zones. In the same city, O'Sullivan and Morrall (1996) found a median distance of 649
metres to access light railway stations in the suburbs (840 metres in the 75th percentile), which fell to only 326 metres in the CBD (419 in the 75th percentile). Weinstein et al. (2008), using a survey in five rail transit stations in California and Oregon, showed that there was a marked difference between distances reported by users and measurements of walking distances taken with a GIS. The average reported distance was 0.58 miles (about 933 metres) with a 75th percentile of 0.95 miles (1529 metres), while the measured distance was clearly less, with an average of 0.52 miles (837 metres) and a 75th percentile of 0.65 miles (1046 metres). In Singapore, Wibowo and Olszewski (2005) found a median distance of 1140 metres to Mass Rapid Transit stations and 187 metres to bus stops. In Madrid, García-Palomares et al. (2013) showed that the walking distance to access Madrid Metro stations is 770.2 metres (percentile 90), but young people and adults, men, immigrants and transit captives are willing to walk greater distances.
Having established the relationship between distance and public transport use (Wu and Murray, 2005), it is not surprising that planners and researchers use transit catchment areas not only to make predictions about transit ridership, but also to prescribe regulations, such as the relaxation of restrictive zoning, or carve out Transit Oriented Development (TOD) financial plans (Guerra et al, 2012). The literature does not, however, provide a clear rule on how to make this choice (Bertolini et al., 2005). García-Palomares et al. (2013) made use of real walking distances to the stations in order to set the boundaries of transit catchment areas. However, in most cases, standard distance thresholds are used to delimit the service areas of stops or stations and to then calculate the population or activities taking place inside them.1 Distance thresholds of 0.25 miles (400 metres) around bus stops and 0.5 miles (800 metres) around rail stations are normally used (Larsen et al., 2010; Hsiao et al., 1997; Kimpel et al., 2007; Lovett et al., 2002). These are the distance thresholds actually used, for example, by the Greater Vancouver Transport Authority or the Service Planning Guidelines for Sydney (Daniels & Mulley, 2011). The Service Planning Guidelines for Sydney specifies that 90% of households should be within 400 m of a rail line and/or bus route during the day, and within 800 m of a rail line and/or bus route at night time. However, different thresholds are used by other Transport Authorities. Looking at 17 transit agencies with light rail service, O’Sullivan and Morrall (1996) found transit walking distance guidelines that ranged from 300 to 900 metres (0.19 to 0.56 miles). Helsinki uses 300 m (HKL, 2008) and Perth uses 500 m (cited in Daniels and Mulley, 2011).
1 The use of Geographic Information Services (GIS) has made this type of analysis easier, with results that differ
according to the methodologies used to delimit service areas (distances in a straight line or across the network) and calculate population and employment (depending on the spatial units from which the information is gathered) (O´Neill et al., 1992; Peng & Dueker, 1995; Hsiao et al., 1997; Murray et al., 1998; Murray, 2001; Zhao et al., 2003; Moreno & Prieto, 2003; Horner & Murray, 2004; Upchurch et al., 2004; Wu, C. & Murray, 2005; Gutiérrez & García-Palomares, 2008; Biba et al., 2010).
2.2 Street design and access to transit
Accessibility to public transport is affected by urban design. Traditional grid street patterns enhance pedestrian access to public transport facilities: street blocks are usually small and streets are well connected, so that access to stops and stations is easy. However, new developed areas -predominantly designed for private transport- tend to be “enclosed” by a local street system design that limits access from a development to major streets. This type of suburban neighbourhood design is transit-unfriendly and has great implications for the transportation system since it tends to reduce public transit use (Loutzenheiser, 1997; Zhao et al., 2003; Ewing & Cervero, 2001; Miralles, 2002; Gutiérrez and García-Palomares, 2008).
Recent movements proposed from the North America such as Neotraditional Design, Traditional Neighborhood Development, or Smart Growth, on different scales, promote actions that uphold the basic principles of the traditional European cities, such as relatively high densities and mixed land use, for both new development and the improvement of rundown urban areas (Litman, 2009, Miralles & Marquet, 2012). Among the actions proving to be the most significant, particularly in the United States, is the promotion of Transit Oriented Development (TOD) (Cervero, 2004). The success of TOD is based on enhancing accessibility on macro (city level) and micro (local level) scales (Litman, 2009). TOD approaches suggest changes to accessibility at the city level (by improvements to public transport and proximity of development) and changes at the local level (by improving the infrastructure, amenity and development intensity and mix in order to facilitate more trips by walking and cycling) (Olaru & Curtis, 2015; Papa & Bertolini, 2015).
At local level, TOD propose compact urban developments in environments close to stations or public transport network nodes, with mixed uses and a street design that favours pedestrian mobility (Tumlin & Millard-Ball, 2003; Currie, 2006). In the area spanned by a TOD, it is possible to walk to a public transport bus stop or station in 5 to 10 minutes, according to the size and level of services at the stations. Taking access times into account implies recognizing the importance of accessibility to stations in the demand for public transport. In fact, when factors influencing route choices were studied, the most important factor was choosing the shortest or fastest route (Weinstein et al., 2008). Pedestrians believe that their primary consideration in choosing a route is minimizing time and distance to transit. However, other factors influence route choice, like safety, attractiveness of the route, sidewalk quality and the absence of long waits at traffic lights. Special attention is paid in TODs to particular qualities of city space based on designing on a human-scale, with attention to detail, since people experience the landscape up close (Suzuki et al., 2013). It is not just the physical distance that is important, but also the quality of the experience: the design of buildings and orientation to the street (Olaru & Curtis, 2015).
The layout of the urban fabric plays a particularly important role. TODs propose an average perimeter round street blocks of no more than 1350 feet (a little more than 400 metres). In their analysis of seven American TODs, Jacobson and Forsyth (2008) show that the average block size in hectares for an 800 m buffer to the station lies between 3.34 hectares and 1.52 hectares. This generates a fine-grained street network that disperses car traffic and facilitates the creation of a quiet, pedestrian-friendly environment. It is important to reinforce the characteristics favouring access, such as the absence of barriers, or a grid street pattern providing for more pedestrian linkages. The generation of more walkable spaces encourages accessing the station on foot, thereby increasing its demand. Handy et al. (2005) have shown how increased connectivity in the streets lowers the number of car journeys and reduces main road traffic. Rodríguez et al. (2009) employ segment-level primary data collected for 338 street segments in close proximity to one of 71 bus rapid transit stations in Bogotá, Colombia. Factor and regression analysis are used to identify two dimensions of the built environment that are associated with higher levels of pedestrian activity: pedestrian-friendly amenities, comprised of wider and higher quality sidewalks and the presence of amenities such as benches, garbage cans, and bike paths; and connectivity, comprised of higher levels of road density, three- and four-way intersections, and density.
Numerous studies have tried to measure the relationship between built environment and transport mode used. In some cases, the modal distribution of new developments based on new urbanism is compared with that of low density developments characteristic of sprawl. Khattak and Rodríguez (2005) compare the modal distribution of neo-traditional developments with that of conventional suburbs in the United States. Other cases analyse the 3D impact on mobility. Ewing and Cervero (2002) have pointed out elasticities in reduced car use, based on an increase in density, diversity and design. Cervero (2007) focuses on analysing the relationship between urban morphology and public transport demand. He evaluates the benefits of TODs, highlighting the considerable increase in demand for public transport at their stations, which may be five or six times greater than that of stations lying outside the TODs.
Direct ridership models try to estimate ridership as a function of station environments and transit services features, using multiple regression (Kuby et al., 2004; Chu, 2004, Gutiérrez et al., 2011). These models work with explanatory variables related to the station environment, which means implicit consideration of the importance of service areas. In addition to explanatory variables, some models also include variables directly related to urban fabric design. Ewing and Cervero (2001) define 6 types of street system, which they introduce as dummy variables into OLS regression models. Gutiérrez et al. (2011) include street system density within the service area as an explanatory variable in entries to Metro stations. Chu (2004) includes several variables related to the pedestrian environment in a direct model using a Poisson regression. However, in none of these models do the variables related to urban fabric design appear to be significant. On the contrary,
their role is masked by the explanatory strength of density and, to a lesser extent, mixed land use. In our opinion, this low explanatory weighting of variables related to urban design is a consequence of the way in which they are studied. By comparing coverages and walking distances to stations in different types of street system, it is possible to measure the effect of urban fabric design.
3 Case study and data
The proposed methodology was applied to access to the Metro network in the city of Madrid. The municipality of Madrid is an area with a great diversity of land use and high densities of population and employment. It has 3.26 million inhabitants and 1.29 million jobs.
The Metro network is made up of 13 lines and 300 stations and covers some 293 kilometres. It mainly serves the municipal area of Madrid, but in recent years it has been extended to several other towns in the region: Alcorcón, Móstoles, Leganés, Fuenlabrada, Getafe, Rivas-Vaciamadrid and Arganda. However, this study concerns only the lines and stations within the Madrid municipal area. In total, 199 stations belonging to 12 lines of the network were analysed.
The following layers in shape format (projection: ETRS1989) were used to feed the analysis:
• Stations in the Madrid Metro network: This layer contains information on station characteristics (for example, the number of lines that pass through the station). This layer was supplied by the Consorcio de Transportes de la Comunidad de Madrid.
• Street network: This layer was used to delineate the catchment areas of the stations calculating network distances in the current situation. Street network was downloaded from Cartociudad-National Geographical Institute, Instituto Geográfico Nacional, Gobierno de España).
• Buildings, also from Cartociudad-National Geographical Institute, Instituto Geográfico Nacional. This dataset contains all buildings in the city represented as points. Each building contains information on the number of resident population (from the Municipal Register), and information on the number of jobs (from the Economic Activities Directory of the Comunidad de Madrid). Both the resident and job data correspond to year 2010.2
The information was treated using a Geographic Information System (GIS), in this case the ArcGIS 10 (ArcINFO) and its Network Analyst module, using network distances to delimit the coverage areas of stations on the Madrid Metro network.
4 Methodology
To assess the influence of urban design on station accessibility, results from analysing the real situation regarding the Metro station environments were compared with those obtained from four
2 Retrieved from http://www.madrid.org/iestadis/
hypothetical street networks, which aimed to represent four urban design models typical of modern-day cities. Therefore, five scenarios were created: the present situation (real scenario) and a scenario for each of the four types of street system (hypothetical scenarios). In all the scenarios, the spatial distribution of population and employment in Madrid was maintained as invariable so that changes in walking distances, population and employment in each of the hypothetical scenarios were due entirely to the effect of urban design. Street networks in the hypothetical scenarios were overlaid on the 199 stations of the Metro network. The entire process was carried out with GIS using layering tools.
4.1 Design of street network types
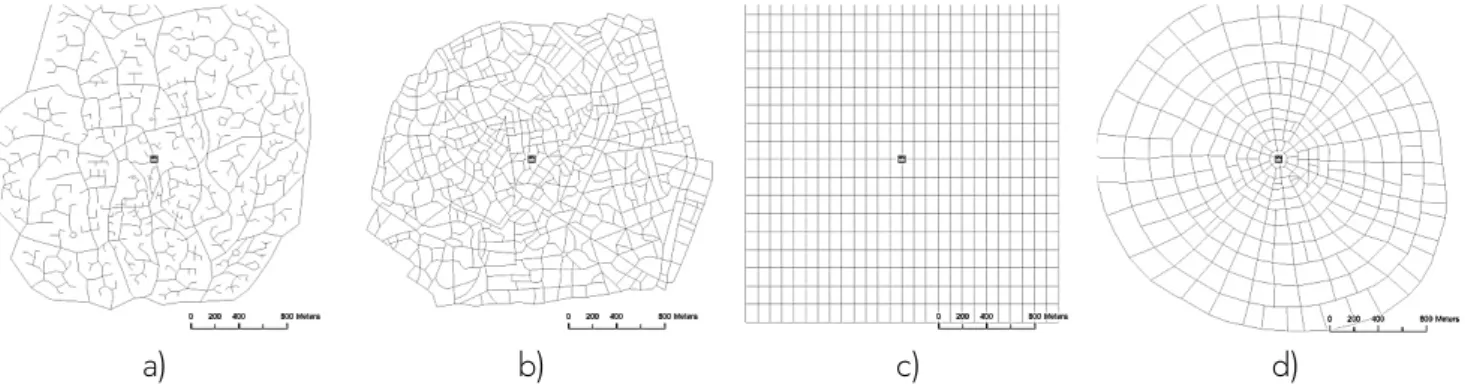
Figure 1 shows street networks in each of the hypothetical scenarios, with the following characteristics:
a. Irregular high density street network: This simulates street networks in the traditional historic centres of European cities. It is typically irregular, with a high density and small-sized blocks. In this case, the centre of the city of Rome in Italy has been taken as a model.
b. Irregular low density street network: This simulates urban development models in the suburbs of big cities. It is a low density model associated with the Anglo-Saxon phenomenon of sprawl, typified by “cul-de-sacs” and winding street networks planned with car use in mind.
c. Orthogonal grid network: This is characteristic of European cities in the second half of the 19th century and the street systems that followed later in Latin American cities. In this case, a street system has been designed around street blocks of 150 by 100 metres with an area of 15,000 m2.
d. Station-oriented street network: This network is shaped like a spider's web and is inspired by urban models geared to public transport (TOD). The street model has a radial pattern, with small street blocks, particularly in areas near stations, and streets leading to the stations in a straight line.
Figure 1. Street network types
Key: a) Irregular with low density; b) Irregular with high density; c) Orthogonal; d) Station-oriented.
Source: authors
4.2 Analysis of coverage areas and walking distances to a station
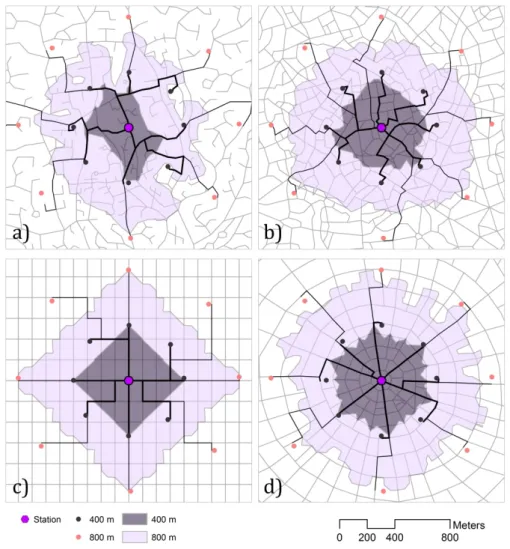
The first comparison of urban designs considers the service area and walking distances for one particular station. This is a fictitious station situated at the centre of each of the street system models created. The service areas are calculated in two distance thresholds of 400 metres and 800 metres, respectively. This is done using the service area tool in the ArcGIS Network Analyst module, which delimits station coverage areas using network distances. Walking distances for accessing the station are analysed by studying 16 points of origin situated on the eight cardinal points at distances of 400 metres and 800 metres. For each of these points, the shortest route to the station is calculated for the four street system models, using the ArcGIS 10 New Route tool. The average and the standard deviation are calculated from the distances obtained for each of the points. By comparing these values with straight-line distances, the detour index associated with each of type of street network is obtained. This initial analysis shows the differences between types of network in a simple and instructive form.
4.3 Service areas and walking distances to the network as a whole
Differences in service area and walking distances are then analysed with respect to the Madrid Metro. This is done by calculating the service area in each of the hypothetical scenarios and comparing it with the service area by the actual street plan (real scenario). Data of surface from the 400 metres and 800 metres service areas are calculated. At the same time, average walking distances to the nearest station from the place of residence and place of work are calculated for each of the scenarios and for the real situation, using the ArcGIS Closest Facility tool to assign each building location to the nearest station. By comparing each of the model scenarios with the real situation, it is possible to determine to what extent certain types of street system bring population and employment closer to the stations in terms of average distance. This is a good measurement of the increase in proximity with urban design.
4.4 Calculation of population and employment coverage
This analysis is based on the increased opportunities indicator, which considers population and employment within a certain distance from the stations (García-Palomares & Gutiérrez, 2008). The Service Area tool is used to delimit the stations' areas of influence in 100-metre bands, up to 1200 metres. These polygon layers are then overlaid on the point layer containing the population and employment distributions and the number of people and jobs falling within the bands are calculated. The analysis is first carried out for the real scenario and then repeated for each of the hypothetical scenarios. Finally, the values of each hypothetical scenario are compared with that of the real situation. In order to facilitate reading of the data, particular attention is given to the standard thresholds of 400 and 800 metres.
4.5 Access quality and synthetic accessibility index
The accumulated opportunities indicator applied to the previous point is an all-or-nothing indicator (number of people and jobs inside or outside the station service area), but it does not take into account differences in access quality within the distance threshold under consideration, or the possibility of station access from distances greater than this threshold. This approach is not realistic since it is known that there is a gradual decrease in station accessibility as distance from them increases. García-Palomares et al. (2013) propose an Access Quality Indicator (AQ) based on normalization of the distance-decay function, derived from empirical measurement of rides per inhabitant at varying distances from metro stations, with a value of 1 given to the first band (maximum accessibility). Once the normalized values of each band are known, the average is obtained, using the size of the population living in each band as a weighting factor, according to the follow up equation: P P R R = AQ i n =1 i i i n =1 i
∑
∑
max (1) where: AQ = access qualityRmax = ratio of rides per inhabitant in the band nearest the station (100 metres), calculated
according to the distance-decay function.
Ri = ratio of rides per inhabitant in band i (also according to distance-decay function)
Pi = population of band i
The values of the indicator oscillate between 1 (all the population is concentrated in the first band) and 0 (station use is zero as the population lives in bands from which nobody accesses it).
Therefore, this indicator gives relative values, which may be useful for comparing stations, networks, and population groups or for evaluating changes over time.
A Synthetic Accessibility Indicator (ASI), based on the access quality indicator, is therefore proposed, which weights the total population covered by its access quality.
P
AQ
=
SAI
·
(2)where:
SAI = Synthetic Accessibility Indicator AQ = Quality Access Indicator
P = total population (covered by the network) in the station catchment area
Results show the number of people in the service area once the distance effect, measured from distance-decay functions, has been discounted and can be interpreted as an indicator of potential demand (García-Palomares et al, 2013).
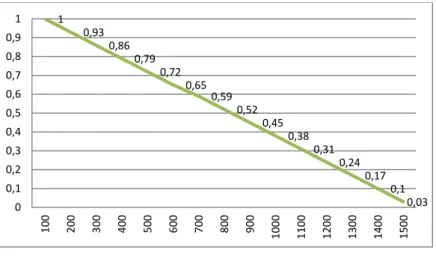
The formulation and distance-decay function used here are those proposed by García-Palomares et al. (2013) in another study, also using the Madrid Metro, to obtain the access quality and synthetic accessibility indicator for the real scenario and the four hypothetical scenarios. Therefore, the weights shown in Figure 2 are applied to the total population and employment found in each of the distance bands.
Figure 2. Distance-decay function (Ri/Rmax) for Metro use in the city of Madrid
Source: García-Palomares et al. (2013)
5 Results
This section shows the results obtained. First shown is the effect of urban street design on the extent of the service areas and walking distances. This is followed by the differences in the amount of population and employment covered between the real scenario (with the existing street network) and
1 0,93 0,86 0,79 0,72 0,65 0,59 0,52 0,45 0,38 0,31 0,24 0,17 0,1 0,03 0 0,1 0,2 0,3 0,4 0,5 0,6 0,7 0,8 0,9 1 100 200 300 400 500 600 700 800 900 0010 1100 1200 1300 1400 1500
the hypothetical scenarios. The final results show the access quality and synthetic accessibility indices for each of these scenarios.
5.1 Differences in the extent of the service area and walking distances for a station
The service area at a distance of 400 metres for a station situated on a station-oriented street network is almost double the service area of a station located on an irregular low density system. Stations on an irregular high density or orthogonal street system would have service areas of intermediate size (those of the orthogonal system being slightly larger) (Table 1 and Figure 3). If the distance in the service area is increased to 800 metres, differences in the surface covered are reduced (with greater distances it is possible to mitigate the long detours characteristic of irregular low density street networks), but there are still considerable differences between the scenarios. Therefore, with a station-oriented street network approximately 50% more surface is covered than with an irregular low density system (Table 1).
Table 1. Sizes of service area for a station (Ha)
Type of street network 400 metres 800 metres Irregular low density 21.34 106.94 Irregular high density 31.91 132.45 Orthogonal 34.87 132.22 Station-oriented 40.87 157.94
Source: authors
Differences in the surfaces covered, depending on the scenario, are due to the variation in detour indices according to the types of street system. In order to demonstrate this effect, walking distances from the 16 cardinal points to the station were calculated for each scenario, confirming that distances that would have to be walked from these points to reach the stations are noticeably less on the station-oriented street system. The detour index in this case is 1.21 at a distance of 400 metres and 1.14 at 800 metres, that is, the distance walked is approximately 20-15% greater than the straight-line distance. The irregular low density and orthogonal street systems once more show an intermediate situation, with detour indices of slightly less than 1.27 for both distances. Finally, the highest detour indices correspond to the irregular low density street systems (1.53 for 400 metros and 1.64 for 800 m). At some points, the detour is particularly large, giving much higher standard deviations in this type of system (Table 2 and Figure 3).
Table 2. Walking distances to access the station from the cardinal points, according to scenarios Scenarios (type of
street network)
Distance Distance/ Network Euclidean
Distance
Distance Distance/ Network Euclidean Distance
400 m 800 m
Mean Std Dev Mean Std Dev Irregular low density 612.2 164.5 1.53 1309.5 522.1 1.64 Irregular high density 507.1 61.6 1.27 987.5 59.3 1.23 Orthogonal 485.3 91.8 1.24 967.0 179.0 1.21 Station-oriented 494.9 74.2 1.21 909.5 40.9 1.14 Source: authors
Figure 3. Coverage areas and walking distances for a station according to types of street system
Key: a) Irregular low density; b) Irregular high density; c) Orthogonal; d) Station-oriented.
5.2 Coverage areas and walking distances in the Madrid Metro network
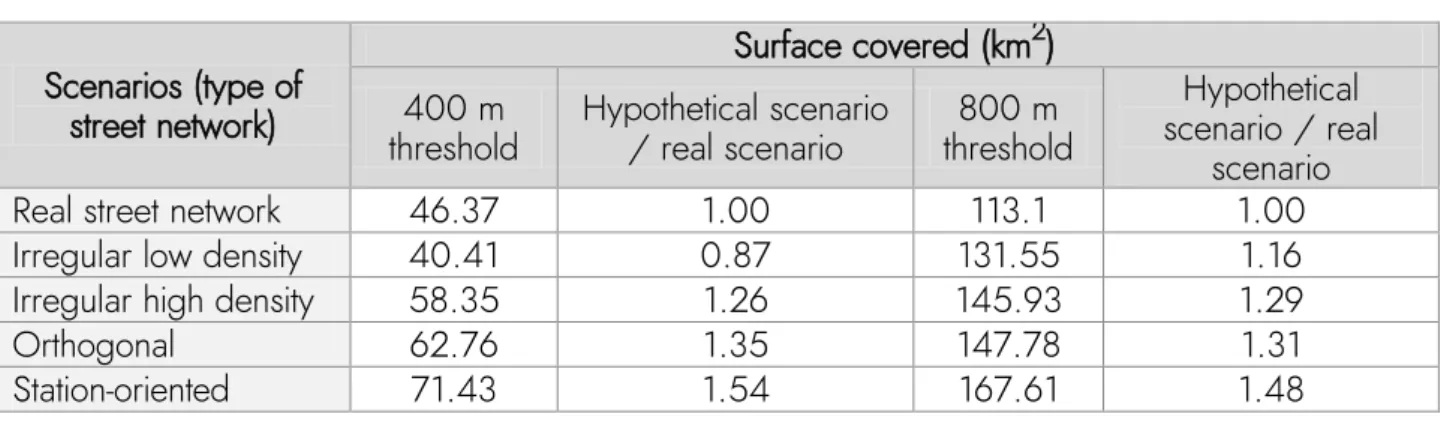
If we examine the service areas in the Madrid Metro network, we see that the surface covered in the existing street system (real scenario) is 46.4 km2 in the 400 metres threshold and just over 113 km2 in the 800 metres threshold. In a hypothetical scenario in which all the station environments would have station-oriented street systems, this coverage area would be multiplied by 1.54 and 1.58 respectively. On the contrary, a low density system would reduce the service area to as much as 87% of the real surface at 400 metres (Table 3). The presence of barriers in the street system at certain stations on the periphery of the city or those serving particular facilities (for example, the two airport stations) means that service areas for all types of street system are greater at 800 metres than in the real system, although this is always significantly less in the case of the irregular low density network. As will be seen, this situation does not affect the population and employment covered.
Table 3. Surface covered by the service areas of the metro stations, according to scenarios Scenarios (type of
street network)
Surface covered (km2) 400 m
threshold Hypothetical scenario / real scenario threshold 800 m
Hypothetical scenario / real
scenario Real street network 46.37 1.00 113.1 1.00 Irregular low density 40.41 0.87 131.55 1.16 Irregular high density 58.35 1.26 145.93 1.29 Orthogonal 62.76 1.35 147.78 1.31 Station-oriented 71.43 1.54 167.61 1.48
Source: authors
For the population of Madrid, the average walking distance to a Metro station is 516 metres from home and 471 metres from the workplace (Table 4). In a scenario in which all stations would have a station-oriented street system, this distance would be reduced by more than 103 metres when accessed from home and by 97 metres accessed from the workplace, just over 20% less in both cases. However, irregular low density street systems keep population and employment away from stations, increasing average distances by 74 and 71 metres respectively (an increment of 14%). The average distances of irregular high density and orthogonal street systems are similar to those of the real system (in both cases slightly lower). This is not surprising, considering the types of street system characteristic of much of the Madrid municipality: irregular low density in the centre and orthogonal in areas of urban expansion.
Table 4. Average distances walked from home and from the workplace, according to scenarios Scenarios Metres From home Hypothetical scenario/ From work
real scenario Metres Hypothetical scenario/ real scenario Real street network 515.7 1.00 471.3 1.00
Irregular low density 589.9 1.14 542.6 1.15 Irregular high density 492.4 0.95 446.9 0.95 Orthogonal 500.4 0.97 460.5 0.98 Station-oriented 412.0 0.80 374.5 0.79
Source: authors 5.3 Differences in coverage in the Madrid Metro network
The 400 metres service area of the Madrid Metro has a total of 1,102,904 inhabitants and 546,166 jobs. If all the stations were in an environment with an irregular high density street system, the population covered would increase by 5%. With an orthogonal system, this increase would be 3% and with a station-oriented system it would be 53%. There would also be an increase in employment covered with these types of street system, although the percentages would be somewhat smaller since there is a greater concentration of employment than of population in the bands nearest the stations (Table 5). In contrast, an irregular low density street system would lead to a significant reduction in both population (-39%) and jobs (-35%) covered (Table 5). A comparison of the station-oriented system and the irregular low density system shows that the former covers 151% more population and 120% more jobs than the latter at the 400 metre distance threshold. Coverage in the real scenario is very similar to that of the two intermediate hypothetical scenarios, which is consistent with the fact that irregular high density and orthogonal street systems are predominant in the areas covered by the Madrid Metro network.
Table 5. Population and jobs covered in a radius of 400 metres, according to scenarios Scenarios (type of
street network)
Population Employment Total
covered
Difference with the
Real Network covered Total Difference with the Real Network Absolute % Absolute % Real street network 1102904 --- --- 546166 --- --- Irregular low density 671589 -431315 -39.11 350206 -195960 -35.88 Irregular high density 1161381 58477 5.30 557434 11268 2.06 Orthogonal 1138036 35132 3.19 553499 7333 1.34 Station-oriented 1689420 586516 53.18 771125 224959 41.19
Source: authors
If the thresholds increased to 800 metres, there is a reduction in the differences between the scenarios at the extremes (irregular low density and station-oriented) and the real scenario (Table 6).
With this distance threshold almost all the population and employment in the station environments are now covered (see Figures 4 and 5), which moderates any differences. At the same time, detours that would be made on shorter distances are overcome with larger distance threshold, another factor that reduces differences between types of street system. In any case, a station-oriented street system would once more lead to a significant percentage increase in the population and employment covered (about 14% and 17% respectively).
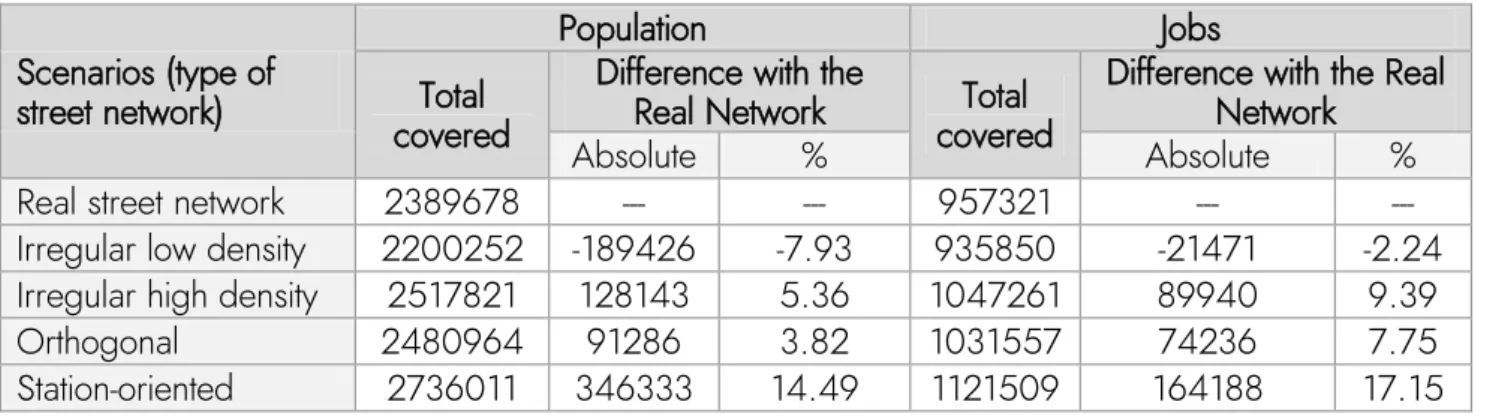
Table 6. Population and employment covered in an 800-metre radius Scenarios (type of
street network)
Population Jobs Total
covered
Difference with the
Real Network covered Total Difference with the Real Network Absolute % Absolute % Real street network 2389678 --- --- 957321 --- --- Irregular low density 2200252 -189426 -7.93 935850 -21471 -2.24 Irregular high density 2517821 128143 5.36 1047261 89940 9.39 Orthogonal 2480964 91286 3.82 1031557 74236 7.75 Station-oriented 2736011 346333 14.49 1121509 164188 17.15
Source: authors
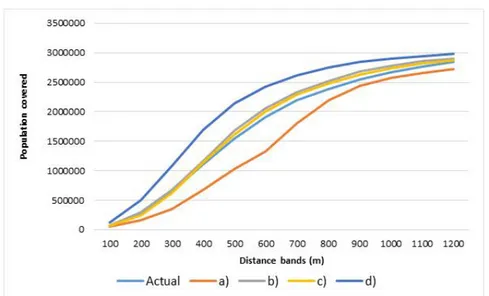
The coverage analysis results are reflected in greater detail in the amount of population and employment covered in the 100 metres distance bands (Figures 4 and 5). The station-oriented street system stands out for the high amount of population covered in the first distance bands (those that contribute the most riders to the Metro), while the opposite is true of the low density system. The other three types are in an intermediate position. For example, some 600,000 jobs are concentrated at a distance of 300 m in the station-oriented street system, which falls to only 200,000 jobs in the irregular low density system and around 400,000 in the intermediate systems. Above 600 m differences between the various scenarios tend to diminish, becoming minimal at a distance of 1200 m. Therefore, designing a street system that facilitates station access would draw population and employment towards the bands closest to the station, thereby increasing Metro ridership.
Figure 4. Distribution of population covered by distance bands to the station, according to scenarios (accumulative)
Key: Types of street network: a) Irregular low density; b) Irregular high density; c) Orthogonal; d) Station-oriented.
Source: authors
Figure 5. Distribution of employment covered by distance bands to the station, according to scenarios (accumulative)
Key: Types of street network: a) Irregular low density; b) Irregular high density; c) Orthogonal; d) Station-oriented.
Source: authors
5.4 Differences in the Madrid Metro network coverage, according to spatial ambits
For reasons of space, this subsection only shows the differences between the real scenario and each of the hypothetical scenarios with respect to the amount of population covered (Figure 6). The patterns for employment are in any case similar.
The effects of street networks in the hypothetical scenarios vary according to the type of system that prevails in each part of the city. With a distance threshold of 400 metres (Figure 6) in the central districts, which have dense street network, differences between the real and the hypothetical scenarios are reduced, especially with the irregular high density and orthogonal networks that are characteristic in these zones. In most of these districts, a station-oriented system would produce increases in the amount of population covered of between 10% and 20%. On the contrary, an irregular low density street network would bring about a significant reduction in the amount of population covered, in some districts exceeding 40%. In peripheral districts the situation is the reverse. The percentage of population covered is lower, not only because of lower station density but also because street network in these areas are more irregular and less dense, with barriers associated with railway and urban motorway infrastructure that considerably reduce their service areas. Thus, irregular high density and orthogonal street networks bring about a much greater increase in population covered than in central districts. A station-oriented street network would lead to increases of over 30% in several of these peripheral districts.
If the coverage areas are increased to 800 metres, there is a reduction in the differences between the hypothetical scenarios and the real situation (Figure 6). The percentage of population covered in the real situation exceeds 90% in many districts, especially central ones, so any changes following the introduction of the hypothetical scenarios are minor. In central districts, irregular high density and orthogonal street networks show similar coverages to those of the real street network. In most districts, the presence of an irregular low density network would lead to losses, while a station-oriented system would bring about a significant increase in population covered in all districts, but especially in the peripheral ones, where it would exceed 20%.
5.5 Differences in access quality and potential demand
The index of access quality from homes in the real situation is 0.68 [equation 1], which means there is a certain tendency for the population to be concentrated in the inner bands of the service area. A station-oriented street system would increase this value to 0.75, and a low density system would reduce it to 0.63 (Table 7). These differences can be explained by the larger amount of population covered by the station-oriented street system in the lower distance bands, which have much greater access quality, while in the low density system the opposite would occur. Irregular high density and orthogonal street networks produce hardly any changes in the quality indicator with respect to the real network. Access quality from the workplace (0.71) is greater than from homes (Table 8) as employment is concentrated in the central areas of the city where network coverage is higher. Once more, the differences between a station-oriented street system and an irregular low density system are maintained, in such a way that the former would produce a significant increase in access quality, in excess of 0.77, while an irregular low density system would reduce it to 0.66. It is therefore the station-oriented street networks that provide the best access quality to stations.
Figure 6. Percentage differences in the population covered between each scenario and the real situation
Types of street networks: a) Irregular low density; b) Irregular high density; c) Orthogonal; d) Station-oriented.
Source: authors
The total population covered by the metro network in the real scenario within a 1200 m limit is 2,851,160 inhabitants. The synthetic accessibility indicator [equation (2)] gives a value of 1,938,789, which is an indicator of potential demand since it considers the distance-decay effect (Table 7). In terms of demand, this can be interpreted as 2,851,160 inhabitants distributed over different bands being equivalent to 1,938,789 concentrated in the first band. With a station-oriented street network, the synthetic indicator would rise to 2,235,794, whereas it would fall to 1,715,859 with an irregular low density network. This indicator is therefore sensitive to the different scenarios, proving that potential demand would vary significantly according to street network types. The results from calculating the indicator show the same tendencies when done from the workplace as when done from homes (Table 8). The station-oriented system would contribute about 15% more demand potential (both from homes and from the workplace) to the Madrid Metro network.
Table 7. Access Quality Index and Synthetic Accessibility Index: population Scenarios
Real low density Irregular high density Orthogonal Irregular oriented Station-Access quality 0.68 0.63 0.69 0.69 0.75 Population covered 2,851,160 2,723,586 2,906,693 2,868,409 2,981,059 Synthetic accessibility index 1,938,789 1,715,859 2,005,618 1,979,202 2,235,794
Source: authors
Table 8. Access Quality Index and Synthetic Accessibility Index: employment Scenarios
Real low density Irregular Irregular high density Orthogonal oriented Station-Access quality 0.71 0.66 0.72 0.72 0.77 Employment covered 1,133,433 1,109,176 1,175,071 1,162,101 1,204,235 Synthetic accessibility index 804,737 732,056 846,051 836,713 927,261
Source: authors
6 Conclusions
Accessibility has been recognized as one of the most important factors affecting transit use. In fact, rail travel levels are high if both origins and destinations are in close proximity to a station (Cervero, 1994). Therefore, concentrating housing and employment within several hundred feet of a rail station will produce far more riders than placing the same level of development half a mile away (Bernick & Cervero, 1997). A further strategy for increasing proximity is to design a street network that avoid detours, thereby reducing distances to stations. This article focuses on the second issue by systematically investigating how street layout impacts on walking distances to stations, and on the surface area, population and employment covered by station service areas. From this, it has been possible to study the extent to which the urban street networks can contribute to creating proximity. Taking the Madrid Metro network as an example, the environments of the 199 stations within the municipality have been analysed and the real situation in terms of coverage (real scenario) compared with the one that would exist if the street network in the station environments were different (hypothetical scenarios). Four hypothetical scenarios have been created, representing four models of street types: high density in historic centres, orthogonal, low density in new developments, and station-oriented. As above-mentioned in the introduction section, we do not suggest a radical remake of the street network as a tool to increase ridership in existing communities, which is clearly unfeasible. Instead, we quantify the differences in the proximity and in the catchment area of different street network designs as a means to provide insights for future urban developments.
The results obtained show that a hypothetical scenario with a station-oriented street network would reduce walking distances to the nearest station in the real situation by more than 100 metres from home and 97 metres from work (in both cases an improvement of over 20%). Furthermore, people also tend to walk from one place to another in a straight line in order to make as few turns as possible (Lamíquiz & López-Domínguez, 2015). Station-oriented street networks not only shorten distances, they also facilitate walking in a straight line, thereby encouraging pedestrian movement. In contrast, in irregular and low density street systems, stations are farther away from homes and workplaces and imply making greater detours, meaning an extra walk of 74 and 71 metres respectively compared with the real scenario (an increment of 14%). Walking distances in the real scenario are very similar to those in the two hypothetical intermediate scenarios (irregular high density and orthogonal street networks). This is consistent with the fact these two types of network predominate in the area covered by the Madrid Metro.
These distances are reflected in the values of the population and employment covered. The station-oriented system is the street network that would concentrate more population and employment in the first coverage bands is, while the opposite situation would prevail in the scenario with an irregular low density system. In fact, the first scenario would have double the population and employment of the second at the 400 metre distance threshold. As with the walking distances, coverage in the real scenario is very similar to that of the two intermediate hypothetical scenarios.
The population and accumulated employment curves according to distance bands to the station show that beyond 600 metres differences between the different scenarios tend to decrease until at a distance of 1200 m they are negligible. This means that a street network design that facilitates station access would enable population and employment to be “moved” to the innermost bands, which would generate growth in demand for the Metro since there is an inverse relationship between distance and demand. This is verified by the synthetic accessibility indicator, which shows a significant increase in potential demand in the station-oriented street network scenario. Analysis of population and employment covered according to scenarios therefore confirms the strategic importance of street network design for creating proximity to stations and increasing metro ridership. As expected, differences between the real scenario and the hypothetical scenarios differ in the districts of Madrid according to which type of street network predominates. An irregular high density or orthogonal system would produce very little change in coverage in central districts (since these are the predominant types of network in the centre), but would considerably improve most of the peripheral districts (with less dense networks). A station-oriented scenario would lead to highly significant improvements in most of the peripheral districts but only moderate improvements in the central ones. From the planning perspective, this conclusion gives particular cause for concern as it is the urban structure of the peripheral districts, which is where the most recent developments are, that least favours use of the Metro.
One limitation of the proposed methodology lies in evaluating the areas covered. Some Metro stations serve particular facilities in environments that lack a street network (for example, the airport), or have significant barriers, such as railway stations. The service area is minimal at these Metro stations and their values condition the total surface of the service area, meaning that they are not very comparable with the hypothetical scenarios (which do not have such barrier effects). However, this situation does not affect population and employment coverage.
This study offers a springboard for future lines of research, such as analysing how types of street network affect walking distances and coverage with respect to different groups of people, especially the more vulnerable (elderly people, children, etc.) or those who most depend on public transport. It is also useful to know the effects of the types of street network for estimating demand from direct ridership models using multiple regressions. This allows ridership to be estimated using independent variables calculated for each of the hypothetical scenarios and the results to be compared with the real situation.
To sum up, this analysis demonstrates that public transport accessibility in new urban developments can be improved not only by increasing density but also by enhancing the design of the street network. Both strategies act in a similar way by increasing the proximity of population and employment to stations and public transport stops. New urban developments should therefore have station environments with a high density of homes and employment and a station-oriented street system. In the same way, where the station environment is still being developed, action should be taken to “redensify” the nearest bands and, as far as possible, extend the capillary street network for pedestrians by improving its orientation towards stations. Improved street network design would reinforce densification strategies so that both could contribute towards increasing the total population and employment covered in the bands nearest stations or public transport stops.
References
Alshalalfah, B., & Shalaby, A. (2007). Case study: Relationship of walk access distance to transit with service, travel, and personal characteristics. Journal of Urban Planning and Development,
133(2), 114-118.
Bernick, M., & Cervero, R. (1997). Transit villages in the 21st century. New York, NY: MGraw-Hill. Bertolini, L., Le Clercq, F., & Kapoen, L. (2005). Sustainable accessibility: a conceptual framework to integrate transport and land use plan-making. Two test-applications in the Netherlands and a reflection on the way forward. Transport Policy, 12(3), 207-220.
Biba, S., Curtin, K. M., & Manca, G. (2010). A new method for determining the population with walking access to transit. International Journal of Geographical Information Science, 24(3), 347-364.
Burke, M., & Brown, A.L. (2007). Distances people walk for transport. Road and Transport
Research, 16(3), 16-28.
Cervero, R. (2004). Transit-oriented development in the United States: experiences, challenges,
and prospects. Transportation Research Board vol. 102
Cervero, R. (2007). Transit-oriented development’s ridership bonus: a product of self-selection and public policies. Environment and Planning A, 39(9), 2068–2085.
Cervero, R., & Kockelman, K. (1997). Travel Demand and the 3Ds: Density, Diversity, and Design.
Transportation Research D, 2, 199-219.
Cervero, R., Ferrell, C., & Murphy, S. (2002). Transit-oriented development and joint development
in the United States: A literature review. TCRP research results digest, nº 52.
Chapleau, R., & Morency, C. (2005). Dynamic spatial analysis of urban travel survey data using GIS. In 25th Annual ESRI International User Conference, San Diego, California (pp. 1-14).
Chorus, P., & Bertolini, L. (2016)- Developing transit-oriented corridors, insights from Tokyo.
International Journal of Sustainable Transportation, 10(2), 86-95.
Chu, X. (2004). Ridership models at the stop level. National Center of Transit Research, University of South Florida.
Currie, G. (2006). Bus transit oriented development. Strengths and challenges relative to rail.
Journal of Public Transportation, 9(4), 1-22
Curtis, C., Renne, J. L., & Bertolini, L. (Eds.) (2009). Transit oriented development: making it happen. Ashgate Publishing.
Daniels, R., & Mulley, C. (2013). Explaining walking distance to public transport: The dominance of public transport supply. Journal of Transport and Land Use, 6(2), 5-20.
El-Geneidy, A., Grimsrud, M., Wasfi, R., Tétreault, P., & Surprenant-Legault, J. (2014). New evidence on walking distances to transit stops: Identifying redundancies and gaps using variable service areas. Transportation, 41(1), 193-210.
Ewing, R., & Cervero, R. (2001). Travel and the built environment: a synthesis. Journal of the
Transportation Research Board, 1780(1), 87-114.
Ewing, R., & Cervero, R. (2002). Travel and the built environment: A synthesis. Transportation
Research Record, 1780, 87-113.
Ewing, R., & Cervero, R. (2010). Travel and the built environment: a meta-analysis. Journal of the
American Planning Association, 76(3), 265-294.
Fitzpatrick, K., Perkinson, D., & Hall, K. (1997). Findings from a survey on bus stop design. Journal
of Public Transportation, 1(3), 17-27.
García-Palomares, J. C., Gutiérrez, J. And Cardozo, O. (2013). Walking accessibility to public transport: an analysis based on microdata and GIS. Environment and Planning B, 40, 1087-1102. Guerra, E., Cervero, R., & Tischler, D. (2012). Half-mile circle. Journal of the Transportation
Research Board, 2276(1), 101-109.
Gutiérrez, J., & García-Palomares, J. C. (2008). Distance measure impacts of public transport service areas. Environment and Planning B, 35, 480-503
Gutiérrez, J., Cardozo, O., & García-Palomares, J. C. (2011). Transit ridership forecasting at station level: an approach based on distance-decay weighted regression. Journal of Transport Geography,
19, 1081-1092.
Handy, S., Cao, X. Y., & Mokhtarian, P. (2005). Correlation or causality between the built environment and travel behavior? Evidence from northern California. Transportation Research D,
10, 427-444.
Horner, M. W., & Murray, A. T. (2004). Spatial representation and scale impacts in transit service assessment. Environment and Planning B, 31, 785-797.
Hsiao, S. L., Sterling, J. J., & Weatherford, M. (1997). Use of Geographic Information Systems for analysis of transit pedestrian access. Transportation Research Record, 1604, 50-59.
Jacobson, J., & Forsyth, A. (2008). Seven American TODs: Good practices for urban design in transit-oriented development projects. Journal of Transport and Land Use, 1(2).
Keijer, M. J. N., & Rietveld, R. (2000). How do people get to the railway station? The Dutch experience. Transportation Planning and Technology, 3(23), 215-135.
Khattak, A., & Rodríguez, D. (2005). Travel behavior in neo-traditional neighborhoods: A case study in USA. Transportation Research A, 39(6), 481-500.
Kimpel, T., Dueker, K., & El-Geneidy, A. (2007). Using GIS to measure the effect of overlapping service areas on passenger boardings at bus stops. Urban and Regional Information Systems
Association Journal, 19(1), 5-11.
Kuby, M., Barranda, A., & Upchurch, C. (2004). Factors influencing light rail station boardings in the United States. Transportation Research A, 38, 223-247.
La Paix, L. C., & Geurs, K. T. (2015). Modelling observed and unobserved factors in cycling to railway stations: application to transit-oriented-developments in the Netherlands. European Journal of
Transport and Infrastructure Research, 15(1), 27-50.
Lam, W., & J. Morrall (1982). Bus passenger walking distances and waiting times: A summerwinter comparison. Transportation Quarterly, 36(3), 407-421.
Lam, W., Morrall, J., & Ho, H. (1995). Pedestrian flow characteristics in Hong Kong. Transportation
Research Record, 1487, 56-62.
Lamíquiz, P. J., & López-Domínguez, J. (2015). Effects of built environment on walking at the neighbourhood scale. A new role for street networks by modelling their configurational accessibility?
Transportation Research A, 74, 148-163.
Larsen, J., El-Geneidy, A., & Yasmin, F. (2010). «Beyond the quarter mile: Re-examining travel distances by active transportation. Canadian Journal of Urban Research, 19(1), suppl., 70-88. Litman, T. (2005). Land use impacts on transport: How land use factors affect travel behavior. Retrieved from http://www.vtpi.org/landtravel.pdf
Loutzenheiser, D. (1997). Pedestrian access to transit. Model to walk trips and their design and urban form determinants around Bay Area Rapid Transit Stations. Transportation Research Record,
1604, 40-49.
Mavoa, S., Witten, K., Mccreanor, T., & O’sullivan, D. (2012). GIS based destination accessibility via public transit and walking in Auckland, New Zealand. Journal of Transport Geography, 20(1), 15-22.
Miralles, C. (2002). Ciudad y transporte. El binomio imperfecto. Barcelona, Ariel.
Miralles, C., & Marquet, O. (2012). Ciudad compacta, la otra cara de la movilidad sostenible.
Mondou, V. (2001). Daily mobility and adequacy of the urban transportation network a GIS application. Cybergeo: European Journal of Geography, 192.
Murray, A. T. (2001). Strategic analysis of public transport coverage. Socio-Economic Planning
Sciences, 35, 175-188.
Murray, A. T., Davis, R., & Stimson, R. J. (1998). Public transport access. Transportation
Research D, 3(5), 319-328.
O’sullivan, S., & J. Morrall (1996). Walking Distances to and from Light-Rail Transit Stations.
Transportation Research Record, 1538, 19-26.
Olaru, D., & Curtis, C. (2015). Designing TOD precincts: accessibility and travel patterns.
European Journal of Transport and Infrastructure Research, 15(1), 6-26.
O'neill, W., Ramsey, D., & Chou J., (1992). Analysis of transit service areas using geographic information systems. Transportation Research Record, 1364, 131-139.
Papa, E., & Bertolini, L. (2015). Accessibility and Transit-Oriented Development in European metropolitan areas. Journal of Transport Geography, 47, 70-83.
Peng, Z., & Dueker, K. (1995). Spatial data integration in route-level transit demand modelling.
Journal of the Urban and Regional Information Systems Association, 7, 26-37.
Pirie, G. H. (1979). Measuring accessibility: a review and proposal. Environment and Planning A,
11, 299-312.
Rastogi, R., & Krishna Rao, K. V. (2003). Travel characteristics of commuters accessing transit: Case study. Journal of Transportation Engineering, 129(6), 684-694.
Rodríguez, D. A. Brisson, E. M., & Estupiñán, N. (2009). The relationship between segment-level built environment attributes and pedestrian activity around Bogota’s BRT stations. Transportation
Research D, 14(7), 470-478.
Saelens, B. E., Sallis, J. F., & FranK, L. D. (2003). Environmental correlates of walking and cycling: findings from the transportation, urban design, and planning literatures. Annals of Behavioral
Medicine, 25(2), 80-91.
Soria-Lara, J., & Valenzuela-Montes, L. M. (2014). Más allá de la estructura urbana y del patrón de viaje. El "entorno de movilidad" como instrumento para la planificación y la evaluación. Boletín de
la Asociación de Geógrafos Españoles, 64, 273-296.
Sung, H., Choi, K., Lee, S., & Cheon, S. (2014). Exploring the impacts of land use by service coverage and station-level accessibility on rail transit ridership. Journal of Transport Geography, 36, 134-140.
Suzuki, H., Cervero, R., & Luchi, K. (2013). Transforming cities with transit: Transit and land-use
integration for sustainable urban development. World Bank Publications.
Talavera-Garcia, R., Soria-Lara, J. A., & Valenzuela-Montes, L. M. (2014). La calidad peatonal como método para evaluar entornos de movilidad urbana. Documents d'anàlisi geogràfica, 60(1), 161-187.
Talavera-Garcia, R., & Soria-Lara, J. A. (2015). Q-PLOS, developing an alternative walking index. A method based on urban design quality. Cities, 45, 7-17.
Talavera-Garcia, R., & Valenzuela-Montes, L. M. (2012). La accesibilidad peatonal en la integración espacial de las paradas de transporte público. Bitácora Urbano-Territorial, 21(2), 97-109
Tumlin, J., & Millard-Ball, A. (2003). How to make transit-oriented development work.
Planning-Chicago, 69(5), 14–19
Upchurch, C., Kuby, M. Zoldak, M., & Barranda, A. (2004). Using GIS to generate mutually exclusive service areas linking travel on and off a network. Journal of Transport Geography, 12(1), 23-33.
Weinstein, A., Schlossberg, M., & Irvin, K. (2008). How far, by which route and why? A spatial analysis of pedestrian preference. Journal of Urban Design, 13(1), 81-98.
Wibowo, S. S., & Olszewski, P. (2005). Modelling walking accessibility to public transport terminals: Case study of Singapore mass rapid transit. Journal of the Eastern Asia Society for
Transportation Studies, 6, 147-156.
Wu, C. S., & Murray, A. T. (2005). Optimizing public transit quality and system access: the multiple-route, maximal covering/shortest-path problem. Environment and Planning B, 32(2), 163-178.
Zhao, F., Chow, L. F., Li, M. T., Ubaka, I., & Gan, A. (2003). Forecasting transit walk accessibility: regression model alternative to buffer method. Journal of the Transportation Research Board, 1835, 34-41.