The Use of Nano and
Microfibers as Novel Supports
for the Separation of
Biomolecules
Adsorption of pDNA in Different Matrix-Based
Supports
Master’s Thesis in Biochemistry
By Carolina Antunes da Costa Esteves
DECLARATION
I hereby declare that I take full responsibility for this thesis and that, to the best of my knowledge and belief, this thesis contains no material previously published or written by another person, except where due reference is made in the text of the thesis.
_____________________________ Carolina Antunes da Costa Esteves
ACKNOWLEDGEMENTS
I want to thank to:
Prof. Dra. Ana Cristina Dias-Cabral, for all the help and support that she gave to me to accomplish this work,
Dra. Angela Sousa, for the help that she gave to me in some laboratory procedures, and Dr, Marvin Thrash, for the PVA nanofibers.
Additionally, I would like to acknowledge all the support that my family, especially, my father, my mother and my sister, and my friends, particularly, Irina Veloso and Anabela Nunes, gave to me in everything, not just in this thesis.
ABSTRACT
The use of plasmid deoxyribonucleic acid (pDNA) in the emerging gene therapy and nucleic acid based biopharmaceuticals requires pure pDNA in large quantities, so it calls for a production of safe pDNA on large scale.
The main achievement of this experimental research was to find alternative matrices to pDNA purification, regarding to economical, simple and efficacy features. The choice of cellulose is due their easy and cheap obtainment and their relatively trouble-free modification; sepharose was mainly to compare results. Were tested two types of adsorption: hydrophobic interaction (is the most common and is easy and low-cost to perform) and anion-exchange (is also easy and low-low-cost and, generally, is more effective). The method of choice was batch adsorption, because of possible problems such as column chromatography high back pressure and poor capacity pDNA binding, furthermore is an easier method to scale-up.
Through hydrophobic interaction was possible to adsorb up to 0,4 μg of pDNA per mg of cellulose microfibers gel, with ammonium sulfate 3,0 M, an enormous concentration of salt, so was concluded that the hydrophobic interaction is due to amount of salt. Through anion-exchange batch, the adorption was up to 2,5 μg of pDNA per mg of gel. Comparing with sepharose based-matrix (adorption was up to 0,7 μg of pDNA per mg of gel), cellulose microfibers are a better support, probably due the surface area expose to ligands. Factors that can be improved in these alternative matrices to pDNA purification experiments are: an increase of pDNA initial concentrations, a decrease of gel mass and, if possible, an increase of matrix surface area, i.e. a decrease of particle/fibers size.
Keywords: adsorption in batch, anion-exchange, cellulose microfibers, hydrophobic interaction, pDNA purification, sepharose particles and surface modification
RESUMO
O uso de ácido desoxirribonucleico plasmídico (pDNA) na emergente terapia génica e em biofármacos requer pDNA puro em grandes quantidades, portanto há uma necessidade de produção de pDNA seguro em larga escala.
O principal objectivo desta investigação experimental foi encontrar matrizes alternativas para purificação de pDNA, dando importância a recursos económicos, simples e eficazes. A escolha da celulose foi devida à sua obtenção fácil e económica e modificação sem grandes problemas; a escolha da sefarose foi, principalmente, para estabelecer termo de comparação. Foram testados dois tipos de adsorção: interacção hidrofóbica (é a mais comum e a mais fácil e económica) e troca-aniónica (também é fácil e económica e, no geral, é mais eficaz). O método de escolha foi adsorção em
batch, devido a possíveis problemas inerentes a cromatografia em coluna, como elevada back pressure e baixa capacidade de ligação do pDNA, para além disso, é um método
mais fácil para larga escala.
Por interacção hidrofóbica, foi possível adsorver até 0,4 μg de pDNA por mg de gel de microfibras de celulose, com sulfato de amónia 3,0 M, uma concentração enorme de sal, portanto, concluiu-se que esta interacção hidrofóbica é por causa do sal. Através de troca-aniónica, foi possível adsorver até 2,5 μg de pDNA por mg de gel. Comparando com a matriz de sefarose (adsorção até 0,7 μg de pDNA por mg de gel), a matriz de celulose é um suporte melhor, provavelmente devido à área da superfície exposta aos ligandos. Factores que podem ser melhorados nestes ensaios com este tipo de matrizes para purificação de pDNA são: um aumento da concentração inicial de pDNA, uma redução da massa do gel e, se possível, um aumento da área de superfície da matriz, ou seja, uma redução do tamanho das fibras ou das partículas.
Palavras-chave: adsorção em batch, interacção hidrofóbica, microfibras de celulose, modificação da superfície, troca-aniónica, partículas de sefarose e purificação de pDNA.
TABLE OF CONTENTS
Declaration... i
Acknowledgements ... ii
Abstract ...iii
Resumo ...iv
List of Tables and Figures ... viii
List of Abbreviations ... x
INTRODUCTION ... 1
Outline ... 1
CHAPTER 1. Plasmid DNA Significance and Applications ... 3
1.1. Plasmid DNA ... 3
1.2. Gene Therapy ... 4
1.3. DNA Vaccination ... 5
CHAPTER 2. Plasmid DNA Purification ... 7
2.1. General procedure ... 7
2.2. Chromatographic Methods ...10
2.3 Hydrophobic Interaction Adsorption ...12
2.4. Anion-Exchange Adsorption ...14
CHAPTER 3. Matrices as Stationary Phase ...16
3.1. Nanofibers ...16
3.1.1. Electrospinning ...17
3.2. Cellulose Fibers ...21
3.3. PolyVinyl Alcohol Fibers...22
CHAPTER 4. Purpose and Fundamental Research Questions ...24
CHAPTER 5. Experimental Plasmid DNA Production ...27
5.1. E. coli Fermentation ...27
5.1.1. E.coli Inoculation ...28
5.1.3. Fermentation ...29
5.2. Cellular Lysis and Plasmid DNA Purification with QIAGEN® kit ...30
5.3. Electrophoresis ...30
5.4. Recover of Anion-Exchange Resins for Plasmid DNA Purification ...32
CHAPTER 6. Experimental Matrices Production ...33
6.1. Ultrasonic Treatment ...33
6.2. Modification of Cellulose Microfibers to Hydrophobic Interaction Adsorption ...35
6.2.1. Activation ...35
6.2.2. Epoxy Groups Quantification ...37
6.3. Modification of Cellulose Microfibers to Anion-Exchange Adsorption ...38
6.4. Modification of CL-6B-Sepharose to Anion-Exchange Adsorption ...40
6.5. Modification of PVA Nanofibers to Anion-Exchange Adsorption ...40
6.6. Scanning Electron Microscopy ...41
6.6.1. Images ...42
6.6.2. Elemental Analysis ...48
CHAPTER 7. Plasmid DNA Adsorption Trials ...51
7.1. Hydrophobic Interaction with Epoxy-Cellulose Matrix ...51
7.1.1. Optimization and Control Experiments...51
7.1.2. Epoxy-Cellulose Batch Adsorption in Ammonium Sulfate 3.0 M ...52
7.1.3. Epoxy-Cellulose Batch Adsorption in Ammonium Sulfate 2.0 M ...54
7.2. Anion-Exchange Interaction with Cationic-Cellulose Matrix ...55
7.3. Anion-Exchange Interaction with Q-Sepharose Matrix (our modification) ...58
7.4. Anion-Exchange Interaction with Q-Sepharose Matrix (commercial) ...60
CHAPTER 8. Discussion ...61 8.1. Matrices Modification ...61 8.2. pDNA Adsorption ...62 CONCLUSIONS ...66 References ...67 Annexes ...78
Annex A - Other Performances of Plasmid DNA Production ...78 Annex B – QIAGEN plasmid maxi kit procedure ...80 Annex C - Other Performances of Hydrophobic Interaction Cellulose Matrix
Preparation ...82 Annex D - Other Performances of Anion-Exchange Matrices Preparations ...84 Annex E – pDNA adsorption isotherms up to 32 hours ...85
LIST OF TABLES AND FIGURES
TABLE 1BACTERIAL CELL CONTENT ... 3
TABLE 2VIRAL SYSTEMS THAT HAVE BEEN DEVELOPED FOR GENE THERAPY ... 4
TABLE 3THE PRINCIPAL APPROVAL SPECIFICATIONS AND RECOMMENDED ASSAYS FOR ASSESSING THE PURITY, SAFETY AND POTENCY OF DNA PREPARATIONS FOR GENE THERAPY AND DNA VACCINES ... 8
TABLE 4CHROMATOGRAPHIC METHODS APPLIED TO PDNA PURIFICATION ... 11
TABLE 5TYPES OF COLLECTORS AND FIBERS ALIGNEMENT ... 19
TABLE 6REAGENTS USED TO PRODUCE TERRIFIC BROTH... 27
TABLE 7SAMPLE ABSORBENCIES DURING PRE-FERMENTATION ... 28
TABLE 8SAMPLE A ABSORBENCIES DURING FERMENTATION ... 29
TABLE 9SAMPLE B ABSORBENCIES DURING FERMENTATION ... 29
TABLE 10FRACTIONS SAVED FOR AGAROSE GEL ELECTROPHORESIS ... 31
TABLE 11LANES IDENTIFICATION AND RESULTS ANALYSIS ... 32
TABLE 12COMPOSITION OF RENEW BUFFER ... 32
TABLE 13SAMPLES VOLUMES AFTER PRE-WASH STEP ... 34
TABLE 14TEMPERATURES OF THE SAMPLES BEFORE AND AFTER ULTRASONIC TREATMENT ... 34
TABLE 15SURFACE MODIFICATION PROTOCOL REAGENTS ... 35
TABLE 16SAMPLES AND REAGENTS USED IN THE ACTIVATION STEP ... 36
TABLE 17SAMPLES PH BEFORE AND AFTER TITRATION AND HCL VOLUME NEEDED ... 37
TABLE 18DRY GEL SAMPLES WEIGHT AND GEL CAPACITY ... 38
TABLE 19SURFACE MODIFICATION PROTOCOL REAGENTS ... 38
TABLE 20SAMPLES AND REAGENTS USED IN THE ACTIVATION STEP ... 39
TABLE 21SAMPLES AND REAGENTS USED IN THE MODIFICATION ... 40
TABLE 22SAMPLES AND REAGENTS USED IN THE MODIFICATION ... 41
TABLE 23ELEMENTAL ANALYSIS OF CELLULOSE MICROFIBERS MODIFIED FOR HYDROPHOBIC INTERACTION ... 48
TABLE 24ELEMENTAL ANALYSIS OF CELLULOSE MICROFIBERS MODIFIED FOR ANION-EXCHANGE ... 49
TABLE 25ELEMENTAL ANALYSIS OF SEPHAROSE MODIFIED FOR ANION-EXCHANGE ... 49
TABLE 26ELEMENTAL ANALYSIS OF PVA FIBERS MODIFIED FOR ANION-EXCHANGE ... 49
TABLE 27CONTROL EXPERIMENT ... 52
TABLE 28 PDNA HYDROPHOBIC INTERACTION ADSORPTION PROTOCOL REAGENTS ... 52
TABLE 29REAL PDNA CONCENTRATIONS ... 53
TABLE 30 PDNA HYDROPHOBIC INTERACTION ADSORPTION AFTER 24 HOURS ... 53
TABLE 31 PDNA HYDROPHOBIC INTERACTION ADSORPTION AFTER 24 HOURS (OTHER RESULTS) ... 54
TABLE 32 PDNA ANION-EXCHANGE ADSORPTION PROTOCOL REAGENTS ... 55
TABLE 33 PDNA ANION-EXCHANGE ADSORPTION AFTER 24 HOURS (ELLULOSE) ... 56
TABLE 34 PDNA ANION-EXCHANGE ADSORPTION UP TO 32 HOURS (CELLULOSE) ... 57
TABLE 35 PDNA ANION-EXCHANGE ADSORPTION AFTER 24 HOURS (Q-SEPHAROSE) ... 58
TABLE 36 PDNA ANION-EXCHANGE ADSORPTION UP TO 32 HOURS (Q-SEPHAROSE) ... 59
TABLE 37 PDNA ANION-EXCHANGE ADSORPTION AFTER 24 HOURS (COMMERCIAL Q-SEPHAROSE)... 60
FIGURE 1IMMUNERESPONSETOPLASMIDDNAVACCINATION ... 6
FIGURE 2LARGE-SCALE PLASMID DNA PURIFICATION STEPS. ... 9
FIGURE 3GENERAL SCHEME OF ELECTROSPINNING DEVICE ... 18
FIGURE 4MOLECULAR STRUCTURE OF CELLULOSE ... 21
FIGURE 5STRUCTURAL FORMULA FOR PVA. ... 22
FIGURE 7MODIFICATIONS GENERAL PROCEDURE SKETCHS ... 26
FIGURE 8AGAROSE GEL ANALYSIS OF THE PLASMID PURIFICATION PROCEDURE ... 31
FIGURE 9REACTION OF POLYMER ACTIVATION ... 36
FIGURE 10DETERMINATION OF BOUNDED GROUPS REACTION ... 37
FIGURE 11REACTION OF POLYMER ACTIVATION ... 39
FIGURE 12NOT MODIFIED CELLULOSE FIBERS ... 42
FIGURE 13NOT MODIFIED CELLULOSE FIBERS (SAMPLE B1) MAGNIFICATION X1000 ... 43
FIGURE 14NOT MODIFIED CELLULOSE FIBERS (SAMPLE B1) MAGNIFICATION X5000 ... 43
FIGURE 15EPOXY-CELLULOSE MICROFIBERS FOR HYDROPHOBIC INTERACTION (SAMPLE (HI)II) MAGNIFICATION X1000 ... 44
FIGURE 16EPOXY-CELLULOSE MICROFIBERS FOR HYDROPHOBIC INTERACTION (SAMPLE (HI)II) MAGNIFICATION X5000 ... 44
FIGURE 17EPOXY-CELLULOSE MICROFIBERS FOR HYDROPHOBIC INTERACTION (SAMPLE (HI)I) MAGNIFICATION X5000 ... 45
FIGURE 18CATIONIC-CELLULOSE MICROFIBERS FOR ANION-EXCHANGE (SAMPLE AE-CEL-I) MAGNIFICATION X1000... 45
FIGURE 19CATIONIC-CELLULOSE MICROFIBERS FOR ANION-EXCHANGE (SAMPLE AE-CEL-I) MAGNIFICATION X5000... 46
FIGURE 20CL-6B-SEPHAROSE BEFORE MODIFICATION, MAGNIFICATION X500 ... 46
FIGURE 21Q-SEPHAROSE MODIFIED BY US FOR ANION-EXCHANGE, MAGNIFICATION X500 ... 47
FIGURE 22COMMERCIAL Q-SEPHAROSE FOR ANION-EXCHANGE, MAGNIFICATION X500 ... 47
FIGURE 23HYDROPHOBIC INTERACTION EPOXY-CELLULOSE BATCH: ADSORPTION ISOTHERM (AFTER 24HOURS) ... 62
FIGURE 24ANION-EXCHANGE CELLULOSE BATCH: ADSORPTION OVER TIME ... 63
FIGURE 25ANION-EXCHANGE Q-SEPHAROSE BATCH: ADSORPTION OVER TIME ... 63
FIGURE 26ANION-EXCHANGE CELLULOSE BATCH: ADSORPTION ISOTHERM (AFTER 24HOURS) ... 64
FIGURE 27ANION-EXCHANGE Q-SEPHAROSE BATCH: ADSORPTION ISOTHERM (AFTER 24 HOURS) ... 65
FIGURE 28ANION-EXCHANGE COMMERCIAL Q-SEPHAROSE BATCH: ADSORPTION ISOTHERM (AFTER 24 HOURS) ... 65
ANNEXES TABLE I DATA FROM OTHER FERMENTATIONS ... 78
ANNEXES TABLE II COMPOSITION OF BUFFERS AND REAGENTS ... 80
ANNEXES TABLE III SAMPLES AND REAGENTS USED IN THE ACTIVATION STEP ... 82
ANNEXES TABLE IV EPOXY GROUPS QUANTIFICATION -SAMPLES PH BEFORE AND AFTER TITRATION AND HCL VOLUME NEEDED .. 83
ANNEXES TABLE V EPOXY GROUPS QUANTIFICATION – DRY GEL SAMPLES WEIGHT AND AMOUNT OF LIGANDS ... 83
ANNEXES TABLE VI SAMPLES AND REAGENTS USED IN THE MODIFICATION (CELLULOSE) ... 84
ANNEXES TABLE VII SAMPLES AND REAGENTS USED IN THE MODIFICATION (SEPHAROSE) ... 84
ANNEXES FIGURE I ANION-EXCHANGE CELLULOSE BATCH: ADSORPTION ISOTHERM (AFTER 4 HOURS) ... 85
ANNEXES FIGURE II ANION-EXCHANGE CELLULOSE BATCH: ADSORPTION ISOTHERM (AFTER 8 HOURS) ... 85
ANNEXES FIGURE III ANION-EXCHANGE CELLULOSE BATCH: ADSORPTION ISOTHERM (AFTER 20 HOURS) ... 86
ANNEXES FIGURE IV ANION-EXCHANGE CELLULOSE BATCH: ADSORPTION ISOTHERM (AFTER 24 HOURS)... 86
ANNEXES FIGURE V ANION-EXCHANGE CELLULOSE BATCH: ADSORPTION ISOTHERM (AFTER 28 HOURS) ... 87
ANNEXES FIGURE VI ANION-EXCHANGE CELLULOSE BATCH: ADSORPTION ISOTHERM (AFTER 32 HOURS)... 87
ANNEXES FIGURE VII ANION-EXCHANGE Q-SEPHAROSE BATCH: ADSORPTION ISOTHERM (AFTER 4 HOURS) ... 88
ANNEXES FIGURE VIII ANION-EXCHANGE Q-SEPHAROSE BATCH: ADSORPTION ISOTHERM (AFTER 8 HOURS) ... 88
ANNEXES FIGURE IX ANION-EXCHANGE Q-SEPHAROSE BATCH: ADSORPTION ISOTHERM (AFTER 20 HOURS) ... 89
ANNEXES FIGURE X ANION-EXCHANGE Q-SEPHAROSE BATCH: ADSORPTION ISOTHERM (AFTER 24 HOURS) ... 89
ANNEXES FIGURE XI ANION-EXCHANGE Q-SEPHAROSE BATCH: ADSORPTION ISOTHERM (AFTER 28 HOURS) ... 90
LIST OF ABBREVIATIONS
AEC Anion-exchange Chromatography
AT Adenine-Thymine
DNA Deoxyribonucleic Acid
dsDNA Double-strand Deoxyribonucleic Acid
GC Guanine-Cytosine
gDNA Genomic Deoxyribonucleic Acid
HIC Hydrophobic Interaction Chromatography
IEC Ion-exchange Chromatography
Oc Open circular
OD Optic density
pDNA Plasmid Deoxyribonucleic Acid
PVA Poly(vinyl) alcohol
Rpm Round per minute
Sc Supercoiled
SEM Scanning Electron Microscope/Miscroscopy
INTRODUCTION
The use of plasmid deoxyribonucleic acid (pDNA) in the emerging gene therapy and nucleic acid based biopharmaceuticals requires pure pDNA in large quantities, so it calls for a production of safe pDNA on large scale.
There are a great number of kit-based DNA purification techniques and conventional chromatography media for adsorption of pDNA, but large scale effective pDNA purification remains a biotechnological challenge, as chromatographic processes normally offer low dynamic binding capacities and poor productivity. Consequently, there is an urgent need for high selectivity, high capacity and high productivity purification methods for pDNA.
Previous work reports about rapid and selective adsorption of DNA to submicron sized polymeric particles in high capacity and recovery (Kim and Rha, 1989). Based on that, there is interest in investigate polymeric structures that can be modified and applied to plasmid adsorption, in this particular case, cellulose microfibers and polyvinyl alcohol (PVA) nanofibers.
OUTLINE
Chapter one focuses in fundamental concepts and background about plasmid DNA and its major applications, gene therapy and DNA vaccination.
A general view about plasmids purification is given in Chapter two, as well as a description about the purification methods based on hydrophobic interactions and anion-exchange, which are the techniques used in this experimental project.
Notions about cellulose fibers, PVA nanofibers (especially those produced by electrospinning) and stationary phases in general are given in Chapter three.
Research aim and main questions beneath this investigation project are enumerated at Chapter four.
Chapter five describes the obtainment of plasmids that were used in the adsorptions studies, with a methodology based on a commercial kit.
Chapter six explains how the several gel matrices were produced and shows the major results.
At Chapter seven, are the adsorptions experiments procedure and the intermediate results.
In Chapter eight, the obtained results are analyzed and clarified.
At the end, the study is concluded and future research suggestions related with this project are given.
CHAPTER 1. PLASMID DNA SIGNIFICANCE AND
APPLICATIONS
Plasmid earned an increasing attention as a biotherapeutic in gene therapy and DNA vaccination. However, a full treatment require milligram quantities of plasmid DNA and that's why is important to developed a cost effective large-scale process for the production of plasmid DNA, which should be capable of providing the product plasmid at required levels of product purity, potency, efficacy and safety (Deshmukh and Lali, 2005; Ferreira et al, 2000).
1.1. PLASMID DNA
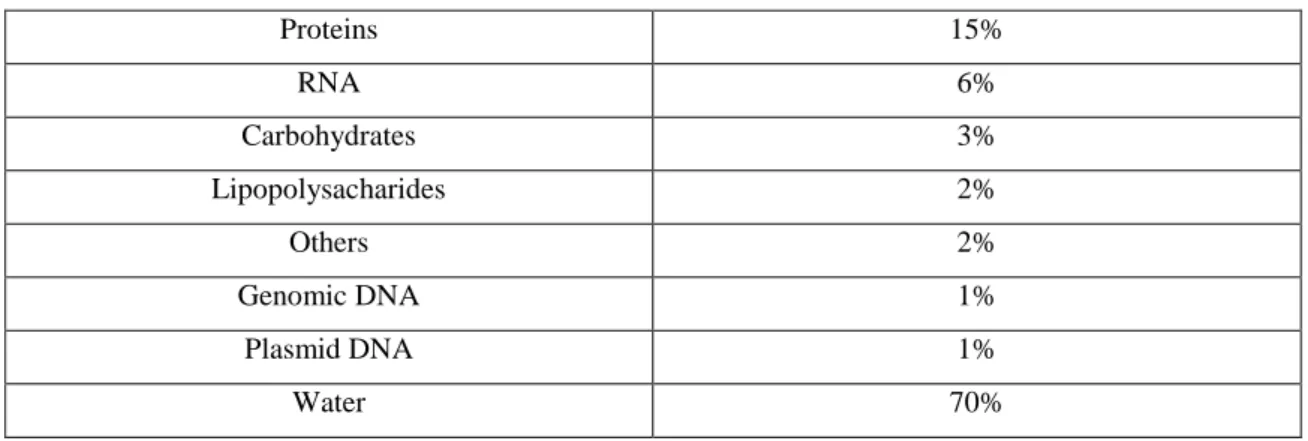
By definition, plasmids are circular, covalently closed, double stranded DNA molecules, very large, when compared with proteins, and comprise approximately 1% of the total content of the host bacterial cell (table 1) (Prazeres et al, 1999).
TABLE 1 BACTERIAL CELL CONTEN T (ADAPTED FROM ATKINSON AND MAVITUNA, 1 991)
Proteins 15% RNA 6% Carbohydrates 3% Lipopolysacharides 2% Others 2% Genomic DNA 1% Plasmid DNA 1% Water 70%
Each pDNA molecule strand is a linear polymer of deoxyribonucleotides linked by phosphodiester bonds, which are negatively charged for pH > 4. The two strands are winding in an anti-parallel way, around each other and around a common axis that gives them the typical right handed double helix structure, stabilized by hydrogen bonds
between adenine-thymine (AT) and guanine-cytosine (GC) base pairs and by stacking forces. Double-helix inside is extremely hydrophobic, because of the aromatic bases close packing. The pDNA helix axis can also coil itself, forming supercoiled pDNA, which is the plasmid configuration that matters to gene therapy and DNA vaccine applications. The other forms of pDNA molecules, besides supercoiled (sc) and open circular (oc), that could be found in cell lysate are: linear (resulting from chemical or enzymatic cleavage of the phosphodiester bonds), denatured (resulting from hydrogen bonding disruption between complementary strands) or oligomeric (resulting from homologous recombination) (Sinden, 1994; Summers, 1996).
1.2. GENE THERAPY
Gene therapy is an approach for tackling diseases at the genetic level by, for example, substitution of a defective gene with the correct nucleic acid sequence in order to restore normal cellular function, through delivery of one or more functional genes into a patient (Anderson, 1992; Crystal, 1995).
One of the major challenges in gene therapy is to get safe vectors able of transporting genes efficiently into the target cells (Legendre et al, 1996).
In the past, viral vectors (examples at table 2) have been used to exploit their natural ability to infect cells, but this use was limited because of safety and regulatory concerns, that include immunogenicity, toxicity and the oncogenes and tumor suppressor genes possible activation/deactivation (Anderson, 1998; Ferreira et al, 1998; Fox, 1999; Luo and Saltzman 2000).
TABLE 2 VIRAL SYSTEMS THAT HAVE BEEN DEVELOPED FOR GENE THERAPY (ADAPTED FROM DARBY AND HINE, 2005 ).
Modified Viral System Reference
Adenoviral
Montain, 2000; Robbins et al, 1998; Sanda et al, 1999.
Retroviral Adeno-associated
Poxviruses Robinson et al, 1999
The use of viral vectors have resulted in adverse reactions in patients, with several deaths reported (Fox, 1999). Also, since 2003, all retroviral-based gene therapy to insert genes into blood stem cells clinical experiments are suspended by Food and Drug Administration (FDA) (FDA, 2003).
Plasmids vectors are considered to be a safer option, free from specific safety concerns viruses-associated and, in general, simpler to develop (Scherman, 2001). However, they are less effective than viral vectors. It is estimated that only one in every 1000 plasmid molecules presented to the cells reaches the nucleus and is expressed, with full treatments requiring milligram quantities of plasmid DNA (Crystal, 1995; Luo and Saltzman, 2000).
1.3. DNA VACCINATION
Plasmid DNA has been also used as a new and safer generation of vaccines, expressing specific antigens on cell membranes, stimulating and enhancing the immune system‟s response and memory (Tighe et al, 1998).
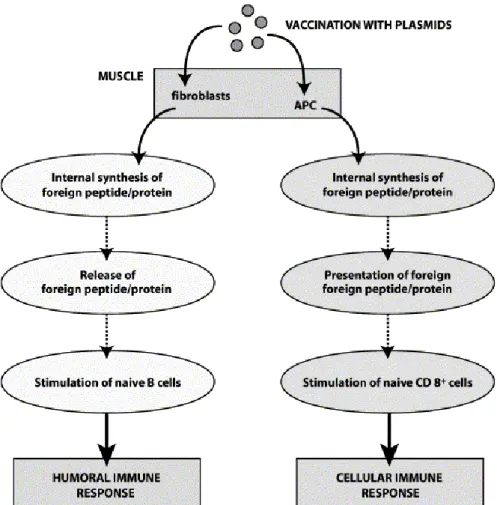
It is believed that pDNA vaccination pathway is similar to the natural intracellular pathogen gene expression pathways, which leads to cellular and humoral responses, and therefore can achieve the same protection afforded by virulent or attenuated infectious microorganisms (figure 1) (Prather et al, 2003).
However, similarly to what happens in gene therapy, DNA vaccines are not effective enough (compared with the viral). In small animals, such as mice, strong immune responses can be induced, but in larger animals (so, the same happens in humans) multiple immunizations of high DNA doses are often required to achieve modest responses (Widera et al, 2000).
FIGURE 1 IMMUNE RESPONSE TO PLASMID DNA VACCINATION (ADAPTED FROM PRATHER ET AL, 2003) [APC = ANTIGEN PRESENTING CELL; CD 8+ = LYMPHOCYTE THAT CARRIES THE CLUSTER OF
CHAPTER 2. PLASMID DNA PURIFICATION
2.1. GENERAL PROCEDURE
Plasmid DNA production can be divide in two stages: upstream processing and downstream processing, however these stages of process development are integrated and must not be approached on an individual basis. So, pDNA production usually begins with the construction and selection of appropriate expression vectors and production microorganisms, followed by the selection and optimization of the fermentation conditions, cell growth, and finally the isolation and purification steps (Kelly and Hatton, 1991).
Upstream processing stage objectives are the design, selection and optimization of appropriate plasmid vectors, production microorganism strains and growth conditions, in order to enable the production of large quantities of stable supercoiled plasmid DNA. Safety and potency demands of gene-therapy vectors, and the inherent requirements for large-scale production and purification of the plasmid vector should be considered at these stages (Prazeres et al, 1999; Schleef, 1999). Fermentation is followed by a sequence of purification steps, which eliminate impurities, to obtain a final plasmid DNA preparation that fulfills the approval specifications – Table 3 (Ferreira 2000).
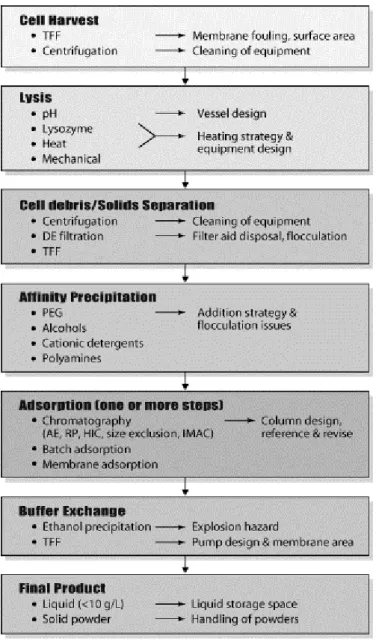
Within downstream stage are some steps that could be identified as: cell harvest, cell lysis, cell debris removal, affinity precipitation, adsorption, and buffer exchange/concentration (figure 2 illustrate those steps), but is not that straightforward. There are several difficulties associated with direct scale-up of some common laboratory procedures.
Current purification methods are kits marketed by commercial companies that take advantage of techniques such as alkaline lysis and the use of disposable chromatography columns. However, these purification conditions do not lend themselves to scale up because they may employ risky chemicals, such as phenol and chloroform, require the use of large amounts of chromatographic resin per milligram of plasmid purified, or necessitate the use of relatively expensive enzymes in order to degrade contaminants, for instance, RNase, and the use of some solutions at high
production scale would turn into considerable capital investment. Due to their simplicity, these purification methods are however the method of choice for the purification of small amounts of plasmid DNA (<20 mg) and are extensively used in research laboratories (Sambrook and Russell, 2001).
TABLE 3 THE PRINCIPAL APPROV AL SPECIFICATIONS AND RECOMMENDED ASSAYS FOR ASSESSING THE PURITY, SAFETY AND POTENCY OF DNA PREPARATIONS FOR GENE THERAPY AND
DNA VACCINES (ADAPTED FROM FERREIRA ET AL, 2000)
Impurity Recommended assay Approval
Specification
Proteins Bicinchoninic acid (BCA)
protein assay Undetectable RNA Agarose-gel electrophoresis Undetectable gDNA Agarose-gel electrophoresis Undetectable
Southern blot < 0.01 µg (µg plasmid)-1 Endotoxins Lymulus amebocyte
lysate (LAL) assay
< 0.01 EU (µg plasmid)-1 (EU = endotoxin units) Plasmid isoforms (linear,
relaxed, denatured) Agarose-gel electrophoresis < 5%
Biological activity and identity
Restriction endonucleases
Coherent fragments with the plasmid
restriction map
Agarose-gel electrophoresis
Expected migration from size and
supercoiling Transformation efficiency Comparable with
plasmid standards
Back to the main steps of pDNA purification, the first one that raises concern is cell lysis. In this step, all the intracellular components, including plasmid DNA, RNA, gDNA, endotoxins and proteins, are released. The shear sensitivity of plasmid and gDNA molecules, as well as the high viscosity of the lysates, is of major concern during plasmid release (Ciccolini et al, 1998; Levy et al, 1999; Prazeres et al, 1999). By far, the most common technique used in the production of plasmid DNA is alkaline lysis. This procedure relies on the use of sodium hydroxide and the detergent sodium dodecyl sulfate (SDS), which combined effects result in the disruption of the cell membrane,
leading to lysis and release of the intracellular components. Subsequent neutralization with sodium acetate precipitates protein and genomic DNA. Upon neutralization, supercoiled plasmid DNA stabilize from its pH-denatured state while large molecular weight (~200 kb) genomic DNA cannot diffuse and anneal properly, resulting in single-stranded genomic DNA precipitation. In addition, at high pH, RNA degrades, which benefits downstream separation steps. However, this lysis is rather delicate as plasmid DNA can be degraded at high pH if high shear conditions are produced during this procedure, and some of the supercoiled DNA could be converted to alternative forms (denatured supercoiled, multimeric, open circle, and linear).
FIGURE 2 LARGE-SCALE PLASMID DNA PURIFICATION STEPS. EACH IMPORTANT STEP LISTED WITH THE CHOICES (LE FT) AND SCALE-UP ISSUES (RIGHT) FOR EACH APPLICABLE TE CHNOLOGY
Following alkaline-lysis, a precipitate is formed that contains cell debris, denatured proteins and nucleic acids, and this must be removed. This might be accomplished by using any solid–liquid unit operation provided that low shear forces are used. Centrifugation on fixed-angle rotors is the most common operation at the laboratory and preparative scales. In large-scale production, filtration is the best option (Ferreira et al, 1999; Marquet et al, 1995; Prazeres et al, 1998; Theodossiou et al, 1997).
Subsequent steps, clarification and concentration, are designed to remove remaining proteins and host nucleic acids, which are usually removed by „salting out‟ using a high concentration of chaotropic salts (Chakrabarti et al, 1992; Horn et al, 1995). Plasmid DNA is commonly concentrated using polyethylene glycol (PEG) precipitation after the clarification step in order further to remove small nucleic acids and to reduce the volume of process streams before adsorption purification. PEG precipitation also enables a buffer exchange, preparing the plasmid extracts for the next purification step (Ferreira et al, 2000).
To purified sc pDNA, liquid chromatography is the method of choice. The size and chemical properties of the target nucleic acid molecules (charge and hydrophobicity), the accessibility of the nucleotide bases to ligands, and the topological constraints imposed by supercoiling are exploited via the interaction of nucleic acids with solid supports, with the objective of selectively isolating and purifying plasmid DNA from impurities. Some of the methods are explained below (subchapters 2.2., 2.3. and 2.4.).
2.2. CHROMATOGRAPHIC METHODS
Generally, chromatography can be described as a separation method that is accomplished by distributing the substances between the mobile and the stationary phases.
As said before, liquid chromatography (LC) is the method of choice to purified sc pDNA. LC consists in a separation of mixture components between two phases: the
mobile phase, which is liquid and moves in a specific direction, and the stationary phase (Sewell et al, 2000). This separation can be based in size, charge, hydrophobicity or affinity of the component that needs to be purified relatively to the stationary phase.
Main chromatographic techniques applied to pDNA purification are: size-exclusion, ion-exchange, hydrophobic interaction, reversed-phase, thiophilic adsorption and affinity, either as an isolated step or integrated in an overall purification process (Sousa et al, 2008).
As said before, LC can be support by size, charge, hydrophobicity or affinity. The methods used in this project are charge and hydrophobicity-related, but a table with all types (table 4) is given below.
TABLE 4 CHROMATOGRAPHIC METHODS APPLIED TO PDNA PURIFICATION
Size-related Size-exclusion chromatography Slalom chromatography Charge-related Anion-exchange chromatography
Hydroxyapatite chromatography
Hydrophobicity-related
Reversed-phase liquid chromatography Reversed-phase ion-pair chromatography
Hydrophobic interaction chromatography
Thiophilic adsorption chromatography
Affinity-related
Triple-helix affinity chromatography Protein–DNA affinity chromatography Immobilised metal affinity chromatography
Boronate affinity chromatography Polymyxin B affinity chromatography
Note: at bold are adsorptions used in this project.
Before describing hydrophobic and anion-exchange chromatographic methods, it is important to describe the limitations of these techniques when applied to pDNA purification. These limitations are due the physical and chemical similarities between impurities and pDNA that result in poor selectivity due to competition or co-elution of impurities in pDNA pools; however this can be improved by reducing impurity load prior to chromatography. Other problem is the high viscosity of feed solutions that increase pressure drop and decreased linear flow rates and throughput, but this could be circumvent by avoiding small beads, dilute feed streams or use expanded beds. At last,
chromatography purification can be limited by the large pDNA size, large size of high
Mr RNA and small pore size, leading to small diffusion coefficients (so poor internal
mass transfer), large peaks (low recovery), small flow rates (long separation times) and poor capacity for pDNA due to lack of accessibility, that can be solved by pDNA compaction, bead size decrease, use of beads with “superpores” or “tentacles”, use formats such as membrane layers and monoliths, pre-digestion of high Mr RNA with RNase and use micropellicular stationary phases (Diogo et al, 2005). One of the most reported drawbacks of pDNA chromatography is poor capacity of stationary phases for pDNA binding, and that is why is important the development of new stationary phases, the major aim of this project (chapter 3) (Diogo et al, 2005).
2.3 HYDROPHOBIC INTERACTION ADSORPTION
Hydrophobic interaction chromatography (HIC) is a well-established bioseparation technique in laboratory and industrial scale protein purification. HIC explores the interaction between immobilized hydrophobic ligands and non-polar regions of, for example, a protein surface in a non-denaturing environment (Queiroz et
al, 2001). These interactions are promoted mainly by van der Waals forces (Van Oss et al, 1986) and the underlying mechanisms have been described using different
approaches such as the solvophobic theory (Melander et al, 1984; Diogo et al, 2002) and preferential interaction theory (Arakawa et al, 1982). HIC is entropy driven process, driven by the release and rearrangement of water molecules that occur during, for example, protein adsorption to the stationary phase (Janson and Rydén, 1998).
The mechanism for HIC adsorption is quite complex and depends on a number of process parameters, including the temperature, pH, salt concentration, adsorbent ligand density, and adsorbent ligand hydrophobicity. The salt type chosen is determinant for the separation success of HIC, the one usually chosen is ammonium sulfate (at 1,0M - 2,4M concentrations) due to its high salting-out ability, high solubility (barely varying in a range of 0–30 ◦C), stability up to pH 8.0 and low cost (Scopes, 1982).
HIC purifies plasmids on the basis of the differences in the hydrophobicity of pDNA and impurities. RNA and denatured gDNA, which are essentially single stranded molecules, have a high hydrophobic character due to the exposure of their hydrophobic bases, whereas pDNA molecules typically present a low hydrophobicity, since the majority of the bases are shielded inside the double helix. Consequently, pDNA can be purified with negative HIC by loading feed solutions at a high concentration of an adequate salt and subsequently performing step or gradient elution with low salt to remove bound impurities (Deshmukh and Lali, 2005; Diogo et al, 2000; Diogo et al, 2001; Li et al, 2005). But the retention time could be a problem in HIC and affect DNA isoforms separation; could induce a partial denaturation of the double helix at AT rich spots, leads to the exposure of the bases to the ligands, so to an increase in the hydrophobic interaction strength. This hypothesis is consistent with the observation that single-stranded oligonucleotides bind more tightly to reverse-phase and hydrophobic interaction matrices than duplex DNA fragments of the same length (Colote et al, 1986; Diogo et al, 2000; Huber, 1998).
One of the widely used stationary phases on HIC is sepharose CL-6B derivatised. Experiments carried out with Sepharose CL-6B derivatised with a mildly hydrophobic ligand (1,4-butanediol diglycidyl ether), proved that is possible to separate native sc pDNA from the more hydrophobic nucleic acid impurities (RNA, gDNA, oligonucleotides, denatured pDNA) under non-denaturing conditions and in the presence of 1,5M of ammonium sulphate (explained by the fact that pDNA molecules have the hydrophobic bases packed and shielded inside the double helix, and thus, the hydrophobic interaction with the HIC media is minimal, whereas single stranded nucleic acids impurities show a higher exposure of the hydrophobic bases, and thus, interact with the hydrophobic ligands). Sepharose CL-6B derivatised with 1,4-butanediol diglycidyl ether was successfully used for the separation of pDNA isoforms (in the presence of 1,5M of ammonium sulphate), so has also been used analytically for the monitoring and control of pDNA quality. Other cellulose and sepharose based HIC materials have also been found to promote the binding of poly A, denatured DNA or viral RNA. (Cashion et al, 1980; Diogo et al, 1999; Diogo et al, 20022).
2.4. ANION-EXCHANGE ADSORPTION
Ion-exchange chromatography (IEC) is one of the most commonly used methods for downstream recovery of biomaterials. Although this process is based essentially on the interactions between charged biomaterials and charged resins, hydrophobic and other non-specific interactions may also be involved, with increased salt concentration the ion shield reduced the electrostatic attraction and retention volume in the column, on the other hand, as the salt concentration raises to reaches a specific threshold, retention volume increases with the salt concentration. The advantages of this technique are rapid separation, no solvent requirement, decontamination with sodium hydroxide and a wide selection of process-grade stationary phases (Eon-Duval and Burke, 2004; Melander et
al, 1989).
Particularly, in pDNA purification, the separation is based on the interaction between DNA negatively charged phosphate groups and positively charged ligands on the stationary phase (Prazeres et al, 1998). The polyanionic structure of nucleic acids can be exploited by IEC, because the overall charge of nucleic acids depends on the number of bases that make up the molecule (one negative charge per base), the expected elution profiles follow the order of increasing molecular size, but it also could be sequence dependent. A salt gradient is employed to displace the different nucleic acids that should elute in order of increasing charge density, a property, which in turn is a function of chain length and conformation. In some cases, base sequence and composition affect the elution pattern of nucleic acids in anion exchangers. Several inversions in retention time as a function of chain length were attributed to a higher AT content of the more retarded molecule (as said before, hydrophobic interactions may be involved) (Huber, 1998; Prazeres et al, 2001; Sinden, 1994; Yamakawa, 1996).
When using AEC to separate pDNA, the clarified lysate feed should always be loaded at a sufficiently high salt concentration (typically >0.5M NaCl) to avoid an unnecessary adsorption of low charge density impurities, such as low Mr RNA, oligonucleotides and proteins. Under these conditions, a significant amount of impurities elute in the flow through and capacity can be fully exploited for pDNA adsorption. Molecules with a high charge density, such as pDNA isoforms, high Mr RNA and gDNA are retained and subsequently eluted by increasing the ionic strength of the mobile phase. Many AEC stationary phases display poor separation selectivity
towards pDNA and impurities due to their similar binding affinities. This lack of selectivity makes purification of pDNA very difficult to achieve in a single AEC step. In most cases a second chromatographic step is needed to meet the required purity or pre-purification steps are required (Colpan and Riesner, 1984; Eon-Duval and Burke, 2004; Ferreira et al, 2000; Prazeres et al, 1999).
Q-Sepharose has been extensively used for AEC of pDNA too. This strong anion exchanger is made of 6% highly cross-linked agarose particles derivatised with quaternary amino groups. A comparison of the performance of Mono and Hi-load Q-Sepharose columns on the small and large-scale purification of pDNA showed that both columns were able to separate sc and oc isoforms (Chandra et al, 1992).
CHAPTER 3. MATRICES AS STATIONARY PHASE
As said before, one of the major problems in plasmid purification is the stationary phase capacity. So, there are a great interest in explore alternative matrices that could be modified and applied to plasmid adsorption. As plasmids are large molecules, is newsworthy to give special attention to micro and nano-particles based-matrices. The polymers used to produce these matrices were cellulose, a natural one, and polyvinyl alcohol, a synthetic one.
A technique of growing interest, and the one used to fabricate the PVA nanofibers used in this project, is electrospinning, whose important advantages are the production of very thin fibers to the order of few nanometers with large surface areas, simplicity of functionalization for various purposes, superior mechanical properties and ease of process. The possibility of large scale productions combined with the simplicity of the process makes this technique very attractive for many different applications (like tissue engineering, drug release, implants and biotransformation to wound healing) (Min, 2004).
3.1. NANOFIBERS
Nanofibers have very small diameters, large surface area per unit mass and small pore size, making them interesting candidates for a wide variety of applications, such as templates (Liu, 2004; Sun et al, 2003), reinforcement (Bergshoef and Vancso, 1999; Kim and Reneker, 1999), filtration (Yoon et al, 2006; Ma et al, 2005), catalysis (Stasiak
et al, 2007; Chen et al, 2007), biomedical and pharmaceutical applications (Welle et al,
2007; Cui et al, 2006; Luu et al, 2003) and electronic and optical devices (Choi et al, 2003; Kim and Yang, 2003; Wang et al, 2002). Properties such as strength, weight, porosity and surface functionality can be manipulated, depending on the polymer used. Furthermore, small insoluble particles can be added to the polymer solution and encapsulated in the dry nanofibers (Frenot and Chronakis, 2003).
The major purpose of nanofibers application in purification processes is benefit from an increased surface area, because specific surface area increases as dimensions decrease, in other words, a higher proportion of atoms is on the surface.
There are a few different methods to produce nanofibers, including, for example, phase separation (Ma and Zhang, 1999) and drawing (Ondarçuhu and Joachim, 1998), but a unique synthetic method, electrospinning, has received a special attention lately.
3.1.1. ELECTROSPINNING
Electrospinning, or electrostatic spinning, is a novel process for forming fibers with submicron scale diameters through the action of electrostatic forces (Fong and Reneker, 2001). While conventional fiber spinning techniques are capable of produce polymer fibers with diameters down to micrometer range, electrospinning is capable of produce fibers in the nanometer diameter range, including diameters lower than 100nm (Frenot and Chronakis, 2003).
Electrospinning was first described as a fabrication technology by Rayleigh in 1897 (Burger et al., 2006), studied in more detail by Zeleny in 1914 (Zeleny, 1914) and patented by Formhals in 1934 (Formhals, 1934). However, it only has been applied in nanotechnology in 1990 and since then, an increasing number of studies have shown that a large variety of polymers can be electrospun (Reneker and Chun, 1996).
Electrospinning has substantial adaptability for processing a variety of polymers with possible control of the fiber fineness (Greiner and Wendorff, 2007; Jayaraman et
al, 2004; Li and Xia, 2004; Reneker and Chun, 1996), orientation (Li et al, 2003),
surface morphology (Casper et al, 2004) and bicomponent cross-sectional configuration (Lin et al, 2005; Sun et al, 2003).
In general, in electrospinning, a high electric potential is applied to a polymer solution (majority) or melt. The fibers are derived by charging a liquid typically to 5-30 kV versus a ground a short distance away, which leads to charge injection into the liquid from the electrode. The sign of the injected charge depends on the polarity of the electrode, so a negative electrode produces a negatively charged liquid. The charged
liquid is attracted to the ground electrode of opposite polarity, forming a Taylor cone at the nozzle orifice as the polymer solution is drawn out by the electric field to form a liquid jet. As the solvent of the polymer jet evaporates, the jet solidifies and a polymer fiber is formed. In the past decade, substantial attention was drawn to electrospinning with research interests focusing on the theoretical foundation of the electrospinning process, including fiber initiation, jet instability, and the structure and morphology of the electrospun fibers (Deitzel et al, 2001; Fong et al, 1999; Reneker and Chun, 1996; Shin et al, 2001; Yarin et al, 2001; Yarin et al, 20012). A general scheme of electrospinning process is represented at figure 3.
FIGURE 3 GENERAL SCHEME OF ELECTROSPINNING DEVICE [DC = DIRECT CORRENT] (ADAPTED FROM YAO ET AL, 2003)
Essentially, an electrospinning consists of three major components: a high-voltage power supply, a spinneret and an electrically conductive collector. For most experiments, an ordinary hypodermic metallic needle and a piece of aluminum foil work well as the spinneret and the collector, respectively (Li et al, 2006).
There is only one procedure to electrospinning, but there are several nanofibers collectors, so it is possible to obtain different types of nanofibers, depending on the end use of resultant nanofibers. The most commons are: a cylinder collector with high
rotating speed (the one represented at figure 3), an auxiliary electrode/electrical field, a thin wheel with sharp edge and a frame collector. The collector design and the nanofibers structure obtained are represented at table 5.
TABLE 5TYPES OF COLLECTORS AND FIBERS ALIGNEMENT (ADAPTED FROM HUANG ET AL, 2003)
CYLINDER COLLECTOR WITH HIGH ROTATING SPEED
It has been suggested that by rotating a cylinder collector at a very high speed up to thousands of rpm, electrospun nanofibers could be oriented circumferentially (Boland et al, 2001;
Matthews et al, 2002).
AUXILIARY ELECTRODE/ELECTRICAL FIELD
Deposited fibers can be circumferentially oriented substantially by employing an auxiliary electrical field. The alignment effect with and without the auxiliary electrical fields can be seen
from the comparison shown below (Bornat, 1987).
W
THIN WHEEL WITH SHARP EDGE
The tip-like edge substantially concentrates the electrical field so that the nanofibers are almost all attracted to and can be continuously wound on the bobbin edge of the rotating wheel. The
distance between two fibers can varied from 1 to 2 μm; before reaching the electrically grounded target, the nanofibers retain sufficient residual charges to repel each other (Theron et
al, 2001).
FRAME COLLECTOR
Another approach to fiber alignment can be by simply placing a rectangular frame structure under the spinning jet other (Huang et al, 2003).
As said before, there are a number of factors that can be controlled in electrospinning, but there are several external parameters and processing variables that affect the electrospinning process: system parameters such as molecular weight, molecular weight distribution and architecture (branched, linear etc.) of the polymer and
solution properties (viscosity, conductivity and surface tension), and process parameters such as electric potential, flow rate and concentration, distance between the capillary and collection screen, ambient parameters (temperature, humidity and air velocity in the chamber) and finally motion of target screen (Wilkes, 2001). For instance, the polymer solution must have a concentration high enough to cause polymer entanglements yet not so high that the viscosity avoids polymer motion induced by the electric field. The solution must also have a surface tension low enough, a charge density high enough, and a viscosity high enough to prevent the jet from collapsing into droplets before the solvent has evaporated. Morphological changes can occur upon decreasing the distance between the syringe needle and the substrate. Increasing the distance or decreasing the electrical field decreases the bead density, regardless of the concentration of the polymer in the solution (Deitzel et al, 2001).
3.2. CELLULOSE FIBERS
Cellulose is a naturally occurring polymer of great interest, because of its abundant availability, biodegradability, compatibility with biological systems and low non-specific binding when used during purification. It consists of a linear polymer of 1,4 β-D-glucose (fig. 4). Cellulose fibers are useful in wide range areas, such as
filtration, biomedical applications and protective clothing (Zhang et al, 2008, Cuculo et
al, 2001). There has been growing interest in the use of cellulose in chromatographic
techniques, because it provides an interesting spectrum of geometrical and morphological forms, the support is relatively inexpensive and the raw material is renewable (Gemeiner et al, 1998).
Cellulose-based media displays the characteristics for an ideal matrix: a high specificity, the absence of hydrophobic binding sites (hydrophilic), good chemical stability (neutral and stable under storage and operational conditions), good mechanical rigidity, high binding capacity (contain functional groups to allow attachment of the affinity ligands), good recoverability, high reproducibility and low cost. However, there is main objection against cellulose-based affinity adsorbents; they may exhibit nonspecific adsorption (Aniulyte et al, 2006; Clonis, 1987; Groman et al, 1987; Liu et
al, 1994; Narayanan et al, 1990).
3.3. POLYVINYL ALCOHOL FIBERS
Polyvinyl alcohols (PVA) are synthetic polymers used since the early 1930s in a wide range of industrial, commercial, medical and food applications including resins, lacquers, surgical threads and food-contact applications (DeMerlis and Schoneker, 2003).
PVA empirical formula is (C2H4O)n(C4H6O2)m and has a molecular weight
between 30,000 and 200,000 g/mol, is water soluble and is insoluble in aliphatic and aromatic hydrocarbons, esters, ketones and oils. Physically, in general, PVA is an odorless white to cream-colored granular powder (Handbook Pharm. Excip., 1994; Japan. Pharm. Excip. Dir., 1996).
The physical characteristics of PVA are dependent on its method of preparation from the hydrolysis, or partial hydrolysis, of polyvinyl acetate (fig. 5), being classified as partially hydrolyzed or fully hydrolyzed (DeMerlis and Schoneker, 2003).
FIGURE 5 STRUCTURAL FORMULA FOR PVA: (A) PARTIALLY HYDROLYZED; (B) FULLY HYDROLYZED.
PVA has already been used to make anion-exchange membranes, prepared through a reaction with quaternary ammonium groups, but this was meant to be applied in a completely different area of purification processes; was made for alkaline direct methanol fuel cell applications (Xiong et al, 2008). So, its application to pDNA adsorption is completely new.
CHAPTER 4. PURPOSE AND FUNDAMENTAL
RESEARCH QUESTIONS
As said before, one of the major problems in plasmid purification is the stationary phase capacity. So, the main achievement of this experimental research is to find alternative matrices to pDNA purification, regarding to economical, simple and efficacy features.
The choice of cellulose is due their easy and cheap obtainment and their relatively trouble-free modification; sepharose was mainly to compare results.
At the beginning, the aim was to produce cellulose nanofibers from cellulose pulp solution by electrospinning, but that was not possible to accomplish. Since good results about sepharose derivatized are known and cellulose has a similar structure, cellulose derivatized microfibers were test with the possibility to be a better matrix than sepharose, with two types of adsorption: hydrophobic interaction (is the most common and is easy and low-cost to perform) and anion-exchange (is also easy and low-cost and, generally, is more effective).
Back to the major intend, due the higher surface capacity, the study of nanofibers is indispensable. The electrospun nanofibers sample was send from Cincinnati, Ohio, USA, but it was a small sample and the polymer used was PVA. Due the polymer structure and small amount, PVA nanofibers are going to be modified only to carry out anion-exchange adsorption.
The method of choice is batch adsorption, because of possible problems like column chromatography high back pressure (due the small particles sized stationary phase) and poor capacity pDNA binding (due pDNA large size), furthermore is an easier method to scale-up.
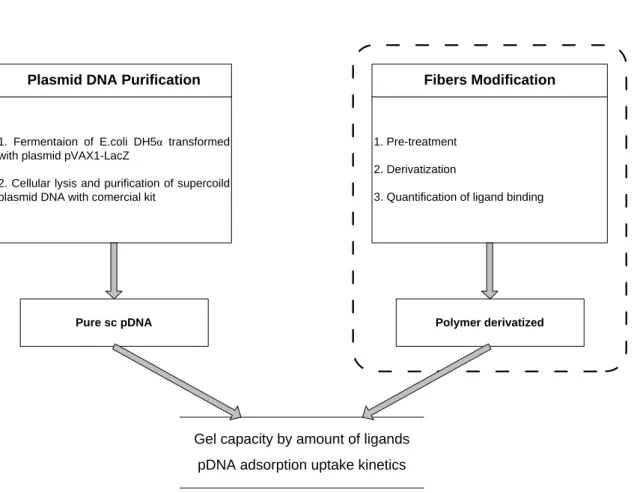
So, the fundamental research question is: how those matrices behave in plasmid DNA purification? The approaches how to answer this question are represented schematically at figures 6 and 7.
Plasmid DNA Purification
1. Fermentaion of E.coli DH5α transformed with plasmid pVAX1-LacZ
2. Cellular lysis and purification of supercoild plasmid DNA with comercial kit
Fibers Modification
1. Pre-treatment 2. Derivatization
3. Quantification of ligand binding
Pure sc pDNA Polymer derivatized
Gel capacity by amount of ligands pDNA adsorption uptake kinetics
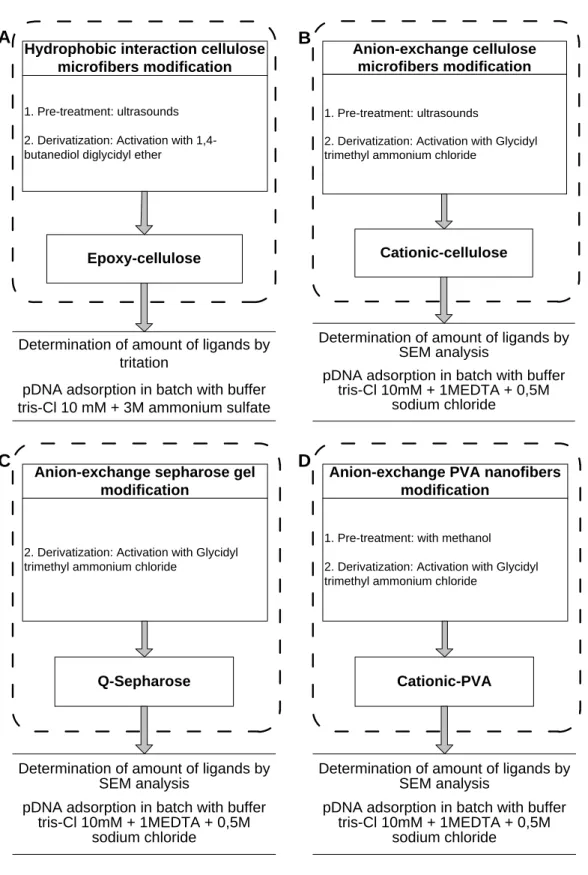
FIGURE 6 GENERAL RESEARCH PLAN. ACCORDING TO THE TYPES OF POLYMER AND INTERACTION, MODIFICATION PROCEDURE DIVERGE.
Hydrophobic interaction cellulose microfibers modification 1. Pre-treatment: ultrasounds
2. Derivatization: Activation with 1,4-butanediol diglycidyl ether
Epoxy-cellulose
Determination of amount of ligands by tritation
pDNA adsorption in batch with buffer tris-Cl 10 mM + 3M ammonium sulfate
A
Anion-exchange cellulose microfibers modification
1. Pre-treatment: ultrasounds
2. Derivatization: Activation with Glycidyl trimethyl ammonium chloride
Cationic-cellulose
Determination of amount of ligands by SEM analysis
pDNA adsorption in batch with buffer tris-Cl 10mM + 1MEDTA + 0,5M
sodium chloride
B
Anion-exchange sepharose gel modification
2. Derivatization: Activation with Glycidyl trimethyl ammonium chloride
Q-Sepharose
Determination of amount of ligands by SEM analysis
pDNA adsorption in batch with buffer tris-Cl 10mM + 1MEDTA + 0,5M
sodium chloride
C
Anion-exchange PVA nanofibers modification
1. Pre-treatment: with methanol
2. Derivatization: Activation with Glycidyl trimethyl ammonium chloride
Cationic-PVA
Determination of amount of ligands by SEM analysis
pDNA adsorption in batch with buffer tris-Cl 10mM + 1MEDTA + 0,5M
sodium chloride
D
FIGURE 7 MODIFICATIONS GENERAL PROCEDURE SKETCH OF: A. CELLULOSE MICROFIBERS TO HYDROPHOBIC INTERACT ION; B. CELLULOSE MICROFIB ERS TO ANION-EXCHANGE; C.
CHAPTER 5. EXPERIMENTAL PLASMID DNA
PRODUCTION
5.1. E. COLI FERMENTATION
The 6,05 kpb plasmid pVAX1-LacZ (Invitrogen, Carlsband, CA, USA) used in the experiments was produced by a cell culture of Escherichia coli DH5α.
Globally, growth was carried out at 37°C in a bioreactor with 250 mL of Terrific Broth (table 6) supplemented with 30 μg/mL kanamycin. The dissolved oxygen concentration was kept at 30% of saturation, and growth was suspended at the late log phase (OD600 ≈ 8).
Cells were recovered by centrifugation and stored at −20°C.
TABLE 6 REAGENTS USED TO PRODUCE TERRIFIC BROTH (TB)
Reagents Information available Concentration required Tryptone - 12 g/L Yeast extract - 24 g/L Glycerol M=92,10g/mol 4 mL/L KH2PO4 and K2HPO4 solution1 M=136,09g/mol and M=174,18g/mol 0,017 M and 0,072 M 1
5.1.1. E.COLI INOCULATION
The solutions, LB-Agar and TB media, and all the required material were autoclaved previously.
Petri dishes with LB-Agar with kanamycine were prepared to inoculate the cells. Escherichia coli DH5α transformed with plasmid pVAX1-LacZ was inoculated and
grew overnight, at 37ºC.
5.1.2. PRE-FERMENTATION
A few bacterial colonies that grew overnight were inoculated in 62,5 mL of TB media with 30 μg/mL kanamycin. The suspension were kept under rotation (250 rpm), at 37ºC, until a OD600 ≈ 2,6 was reached.
TABLE 7 SAMPLE ABSORBENCIES DURING PRE-FERMENTATION
Time (h) Absorbency’ Dilution Absorbency
1,0 0,457 None 0,457
2,5 0,939 1:2 1,878
3,0 0,638 1:4 2,552
Final (3,1) 0,684 1:4 2,736
The volume used to carry out the fermentation was calculated through the following formula:
2
So, the pre-fermentation suspension volume was 9,842 mL to each 125 mL of fermentation broth.
2
ODpre-ferment = pre-fermentation suspension optic density;
Vpre-ferment = pre-fermentation suspension volume;
ODferment = fermentation suspension optic density (0,2);
5.1.3. FERMENTATION
Fermentation suspensions (already with kanamycin and pre-fermentation suspension) were kept under rotation (250 rpm), at 37ºC, until a OD600 ≈ 8,0 was
reached. The absorbency was measured hour by hour, in the beginning, just to see how
E.coli population grows (tables 8 and 9).
The growth was stopped with centrifugation. The suspensions were transferred to falcons that were centrifuged 15 min, at 4ºC and 5000g. Then, supernatant was discarded and cells pellet was frozen at -20ºC.
TABLE 8SAMPLE A ABSORBENCIE S DURING FERMENTATION
Time (h) Absorbency’ Dilution Absorbency
1,0 0,555 None 0,555 2,0 0,701 1:2 1,402 3,0 0,433 1:5 2,165 4,0 0,536 1:5 2,680 Overnight 19,0 0,765 1:10 7,65 20,0 0,770 1:10 7,70
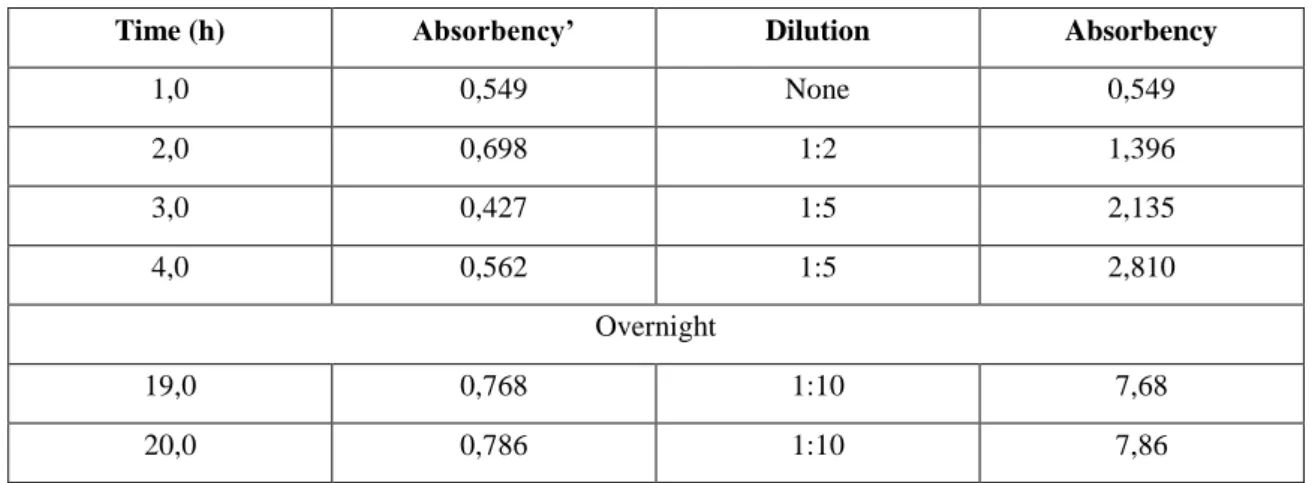
TABLE 9 SAMPLE B ABSORBENCIE S DURING FERMENTATION
Time (h) Absorbency’ Dilution Absorbency
1,0 0,549 None 0,549 2,0 0,698 1:2 1,396 3,0 0,427 1:5 2,135 4,0 0,562 1:5 2,810 Overnight 19,0 0,768 1:10 7,68 20,0 0,786 1:10 7,86
The procedure was repeated, several times, with a few changes: the tryptone mass measured was 6,25g (instead of 3,858g) – but only samples C and D –, the
centrifuge velocity used, at the end, to precipitate de pellet was 4500 rot/min (instead of 5000 rot/min) and the absorbency measure hour by hour was no long performed – all. The tryptone mass used at the first time is the one that is currently used at the laboratory (concentration of 12g/L) and the second is the one that is indicated at the papers (concentration of 20g/L). The centrifuge velocity alteration was due the finding that 4500 rot/min is sufficient to precipitate the cells. The absorbencies after pre-fermentation and pre-fermentation as the volume needed to carry out pre-fermentations are at annex A.
5.2. CELLULAR LYSIS AND PLASMID DNA PURIFICATION WITH QIAGEN® KIT
QIAGEN Plasmid Purification Kits are based on the selectivity of patended QIAGEN Resin, allowing purification of ultrapure supercoiled plasmid DNA with high yields.
QIAGEN plasmid purification protocols are based on a modified alkaline lysis procedure, followed by binding of plasmid DNA to QIAGEN Anion-Exchange Resin under appropriate low-salt and pH conditions. RNA, proteins, dyes, and low-molecular-weight impurities are removed by a medium-salt wash. Plasmid DNA is eluted in a high-salt buffer and then concentrated and desalted by isopropanol precipitation (QIAGEN Plasmid Purification Handbook 11/2005).
The kit buffers composition and the procedure are described at annex B.
5.3. ELECTROPHORESIS
Agarose gel electrophoresis was performed to analyzed pDNA yield and quality. To do that, were saved four aliquots from different steps of pDNA purification procedure that are summarized at table 10.
TABLE 10 FRACTIONS SAVED FOR AGAROSE GEL ELECTROPHORESIS
Sample id. Fraction Volume (L) Contain
1 Cleared lysate 120 sc and oc pDNA and
degraded RNA
2 Flow-through 120 only degraded RNA
3 Buffer QC wash
fractions 240 completely clear
4 Buffer QF/QN elute 60 Pure pDNA
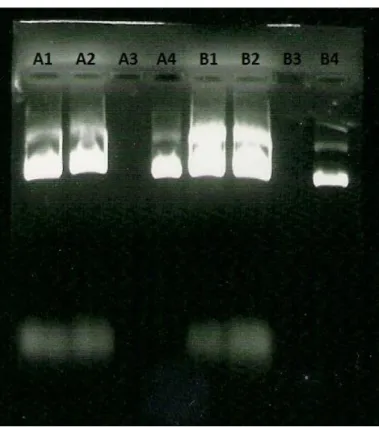
Figure 8 shows the analytical gel of the different steps fractions from two performances of QIAGEN kit pDNA purification (A and B). The lanes identification and results analysis are below at table 11.
TABLE 11LANES IDENTIFICATION AND RESULTS ANALYSIS
Lane Identification Analysis
1 A1 Cleared lysate containing sc and oc pDNA and degraded RNA, as expected 2 A2 Flow-through containing the same impurities that A1, but it was supposed to be only
degraded RNA after the first step, the sample still have a high impurities degree 3 A3 Buffer QC wash fractions completely clear, as expected
4 A4 Buffer QF/QN elute with pDNA and a light contamination of genomic DNA
5 B1 Same as A1
6 B2 Same as A2
7 B3 Same as A3
8 B4 Buffer QF/QN elute with pure pDNA
5.4. RECOVER OF ANION-EXCHANGE RESINS FOR PLASMID DNA PURIFICATION
After elution of plasmid DNA following the procedures suggested by the manufacturer, the tips were washed briefly with deionized water to remove any particulate materials that are trapped on top of the packed resins and salt deposits on the outer surface of the tips before storage.
Immediately before applying the used tips for plasmid DNA purification, 10 mL of “renew” buffer (3M NaCl, 0,15% Triton X-100) is added into the tips and allowed to flow through to remove any residual material from the previous use. This process was repeated three times (Chang et al, 1999).
TABLE 12COMPOSITION OF RENEW BUFFER
Reagents Information available Concentration required NaCl M = 58, 443 g/mol 3 M Triton X-100 - 0,15%
CHAPTER 6. EXPERIMENTAL MATRICES PRODUCTION
Cellulose fibers origin:
Pine cellulose pulp obtained by Kraft method was used as a source for the microfibrillated cellulose. The pulp was treated in three steps: a refining step to increase the accessibility of the cell wall to the subsequent monocomponent endoglucanase treatment, an enzymatic step and a second refining.
Cellulose pulp was torn into small pieces (a portion corresponding to 360,6g of dry cellulose) and wetted in 4L of distilled water. After 3 hours, the cellulose suspension was mechanically refined using a Valley Beater Rafiner to 27ºSR.Cellulose pulp thus obtained was seeped out by filtration and homogenized in Karl Frank Homogenizer. Next, the enzyme was added. In this enzymatic treatment, 360,6g (calculated as dry fibers) of the refined pulp was dispersed in 9L of phosphate buffer (pH 7, final pulp concentration 4%(w/w)) with 0,11 μL of monocomponent endoglucanases per gram dry fiberand then incubated for 2 hours at 50ºC. The mixture was stirred manually every 30 minutes. Then, the samples were washed with 30L of deionized water, drained and homogenized. The monocomponent endoglucanase was denaturated by heating at 80ºC for 30 minutes and then the pulp sample was washed with 20 liters of deionized water. The pre-refined and enzyme treatedpulp was refined once again with the Valley Beater, this time, to 92ºSR (Szewczyk, 2009).
The cellulose fibers (not yet in a micro scale range) that Katarzyna Szewczyk obtained were stored in a solution of water with 20% ethanol, at 4ºC.
6.1. ULTRASONIC TREATMENT
First of all, a pre-wash step was performed to remove ethanol from samples. Samples were washed by a centrifuge method: washing with water, five rounds of 1min, at 4600 rpm and 25ºC. A total of eight samples were prepared (Table 13):
TABLE 13SAMPLES VOLUMES AFTER PRE-WASH STEP
Sample A1 A2 A3 A4 B1 B2 B3 B4
Volume (mL)
22,0 22,0 24,0 22,0 27,5 27,0 25,0 27,0
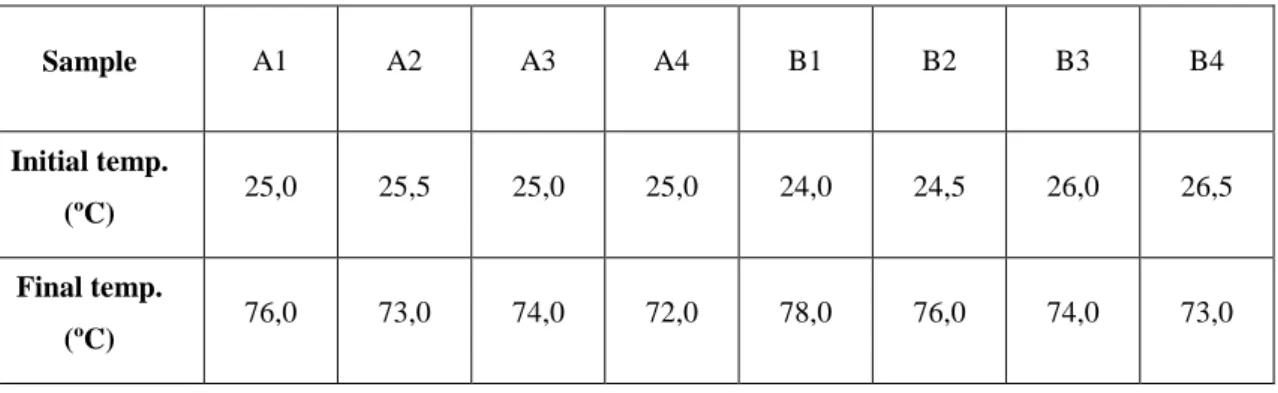
Samples were treated with ultrasounds (Labsonic P B Braun Biotech Intern., amplitude 80, cycle 0,5), during 30 minutes, with a break of 30 seconds in every minute, to not overheating and homogenize the sample. The initial and final temperatures of fibers were measured (Table 14).
TABLE 14 TEMPERATURES OF THE SAMPLES BEFORE AND AFTER ULTRASONIC TREATMENT
Sample A1 A2 A3 A4 B1 B2 B3 B4
Initial temp.
(ºC) 25,0 25,5 25,0 25,0 24,0 24,5 26,0 26,5
Final temp.
(ºC) 76,0 73,0 74,0 72,0 78,0 76,0 74,0 73,0
The samples were stored, at 4ºC, in a solution of water with 20% ethanol, until completion of the next step.
6.2. MODIFICATION OF CELLULOSE MICROFIBERS TO HYDROPHOBIC INTERACTION ADSORPTION
The protocol used for this step was based on Sundberg‟s (Sundberg and Porath, 1974). The list of reagents is at table 15.
TABLE 15 SURFACE MODIFICATION PROTOCOL REAGENTS
Reagents Information available Concentration required 1,4-Butanediol diglycidyl ether M = 202,20 g/mol 62% pure - Sodium hydroxide M = 40 g/mol 99% pure R35, S26, S45, S37/39 0,6 M and 1 M
Sodium borihydride M = 37,83 g/mol
99% pure -
Sodium thiosulphate M = 158,11 g/mol
99% pure 1,3 M Hydrochloric Acid M = 36,46 g/mol 37% pure d = 1,19 R34, R37, S26, S45 0,01 M 6.2.1. ACTIVATION
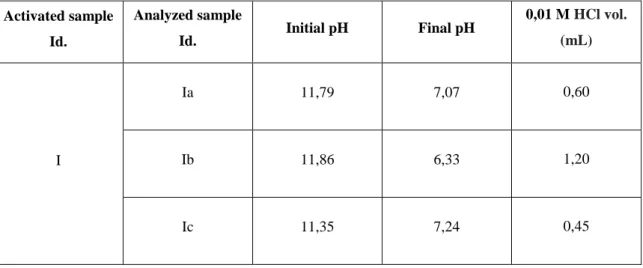
Per gram of cellulose microfibers gel, the sample was mixed with 1 mL of 1,4-butanediol diglycidyl ether and 1 mL of 0,6 M sodium hydroxide solution containing 2 mg of sodium borihydride per milliliter (figure 9). The suspension was mixed by rotation for 8 hours at 25ºC and the reaction stopped by washing the gel with large volumes of water with the centrifuge-wash method. The amounts used are described in table 16.
After washing, to determine the amount of bound substance (step 6.1.2.2), were retired 500 mg samples and the rest of the gel was placed in 1M NaOH overnight, to inactivate the free epoxy groups.
FIGURE 9 REACTION OF POLYMER ACTIVATION (ADAPTED FROM SUNDBERG AND PORATH, 1974)
TABLE 16 SAMPLES AND REAGENTS USED IN THE ACTIVATION STEP
Sample
Identification (HI)I
Primary sample A2, A3 and A4
Mass (g) 50,15 Volumes (mL) Required Measured or Prepared Diglycidyl ether 50,0 50,0 Sodium hydroxide 0,6 M 50,0 50,0 Sodium hydroxide 1 M 500,0 500,0 Masses (g) Required Measured Sodium hydroxide 0,6 M 1,22 1,23 Sodium hydroxide 1 M 20,0 20, 408 Sodium borihydride 0,100 0,101 Bath Temperature (ºC) 24,9 Rotation (U/min) 67
After 24h with 1M NaOH, the cellulose microfibers gel was washed with a great amount of water and then stored, at 4ºC, in a solution of water with 20% ethanol.
![FIGURE 3 GENERAL SCHEME OF ELECTROSPINNING DEVICE [DC = DIRECT CORRENT] (ADAPTED FROM YAO ET AL, 2003)](https://thumb-eu.123doks.com/thumbv2/123dok_br/19173962.942392/29.892.222.715.477.779/figure-general-scheme-electrospinning-device-direct-corrent-adapted.webp)