2º Cycle in Master in Geographic Information Systems and Spatial Planning
Analysis land use and land cover
changes and the driving forces:
A case study in Kaysone Phomvihan
District, Laos
M
2018
Bandit Mienmany
Analysis of land use and land cover changes and the driving forces:
A case study in Kaysone Phomvihan District, Laos
Dissertation of Master in Geographic Information Systems and Spatial Planning Supervisor: Ana Cláudia Moreira Teodoro
Co-supervisor: Patrícia Catarina dos Reis Macedo Abrantes
Faculty of Arts, University of Porto
Analysis of land use and land cover changes and the driving forces:
A case study in Kaysone Phomvihan District, Laos
Bandit Mienmany
Dissertation of Master in Geographic Information Systems and Spatial Planning Supervisor: Ana Cláudia Moreira Teodoro
Co-supervisor: Patrícia Catarina dos Reis Macedo Abrantes
Juri members
Professor Doctor António Alberto Teixeira Gomes Faculty of Arts - University of Porto
Professor Doctor Ana Cláudia Moreira Teodoro Faculty of Sciences - University of Porto
Professor Doctor Lia Bárbara Cunha Barata Duarte Facutly of Arts - University of Porto
6
Table of Contents
Acknowledgement ... 9 Resumo ... 11 Abstract ... 12 Index of Figures ... 13 Index of Tables ... 15 Abbreviations... 16 Chapter 1 - Introduction ... 181.1. Background of the study ... 18
1.2. Research objectives and questions ... 22
1.3. Method ... 22
1.4. Thesis organization ... 23
Chapter 2 - Literature review ... 25
2.1. Land use and land cover concept ... 25
2.2. Drivers of land use and land cover changes ... 26
2.2.1. Proximate driver ... 27
2.2.2. Underlying driver ... 28
2.2.3. Identifying LUCC Drivers in Laos ... 30
2.3. Remote sensing for LULCC classification ... 31
2.4. Land use and land cover change model ... 33
2.4.1 Logistic regression model ... 35
2.4.2. Cellular Automata model... 36
Chapter 3 - Study area ... 38
3.1. Geography ... 38
3.2. Socio-economic and demographic context ... 39
3.3. Land use planning and urban development in Laos ... 43
Chapter 4 - Methodology ... 47
4.1. Study framework ... 47
4.2. Satellite images classification for LULCC analysis ... 48
4.2.1. Remote sensing data ... 48
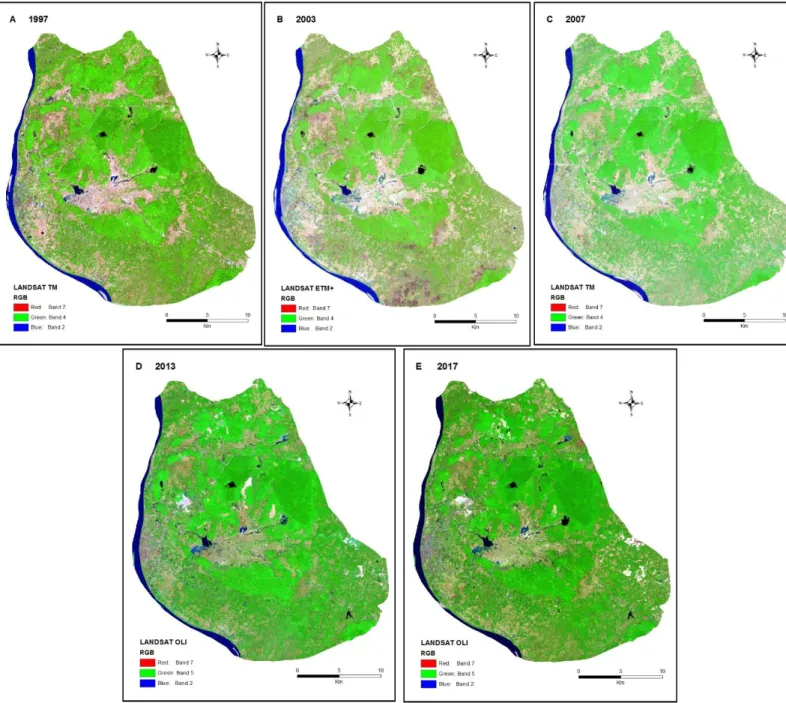
4.2.2. Satellite image classification ... 51
4.2.3. Accuracy assessment ... 53
4.3. Identification of proximate drivers ... 54
4.3.1. Characterization of LULCC ... 54
4.3.2. Proximate drivers (Dependent variables) ... 55
4.4. Quantification of underlying drivers (independent variables) ... 56
4.4.1. Independent variable dataset ... 56
4.4.2. Biophysical ... 57
4.4.3. Socio-Economic ... 61
4.5. Statistical analysis ... 65
4.5.1. Statistical dataset ... 65
7
4.5.3. Multi binary logistic regression ... 67
4.5.4. Model Validation ... 68
4.6. LULC simulation ... 69
4.6.1 Model setting ... 69
4.6.2. Transitional Potential model ... 70
4.6.3. Cellular Automata simulation ... 70
4.6.4. Validation ... 70
Chapter 5 - Results ... 72
5.1. Accuracy assessment of satellite image classification ... 72
5.2. LULCC analysis ... 72
5.2.1. LULCC in magnitude and rate ... 72
5.2.2. LULC conversions ... 75
5.3. Multi binary logistic regression ... 79
5.3.1. Exploratory data ... 79
5.3.2. LULC conversion models ... 80
5.3.3. Model validation ... 84
5.4. LULC simulation ... 87
5.4.1. Simulated LULC in 2017 ... 87
5.4.2. LULC simulation for 2022 ... 90
Chapter 6 - Discussion ... 94
6.1. Satellite image classification ... 94
6.2. LULCC drivers ... 95
6.2.1 Proximate drivers ... 95
6.2.2. The underlying drivers ... 96
6.3. LULC conversion models ... 97
6.3.1. Forest to shrub conversion ... 97
6.3.2. Shrub to agriculture conversion ... 98
6.3.3. Shrub to built-up conversion ... 99
6.4. LULC simulation. ... 99
6.5. LUCC and spatial planning challenges ... 100
Chapter 7 - Conclusions and Recommendations ... 103
7.1. Conclusions ... 103
7.2. Limitations and recommendations ... 105
7.2.1. Limitations ... 105 7.2.2. Recommendations ... 105 References ... 107 Appendices ... 115 Appendix A ... 115 Appendix B ... 127
8
Declaration of honor
I declare that this dissertation is my own and has not previously been used in another course or curricular unit of this or another institution. References to other authors (affirmations, ideas, thoughts) scrupulously respect the rules of attribution, and are duly indicated in the text and bibliographical references, according to the norms of reference. I am aware that the practice of plagiarism and self-plagiarism is an academic offense.
Porto, 16/07/2018
9
Acknowledgement
This dissertation would not have been possible without the support from relevant people and sectors. First, I would like to express my sense of thanks and appreciate to Erasmus Mundus, ALFABET Project for their financial support, and to the coordinator teams between University of Porto and National University of Laos for their assistance and advice.
I would like to express my deepest thank and gratitude to Prof. Ana Cláudia Moreira Teodoro for serving as supervisor and for her support, dedication, timely advice and meticulous scrutiny that led this thesis successfully. I would also like to thank my co-supervisor Prof. Patrícia Catarina dos Reis Macedo Abrantes for her valuable and kindly advice in this thesis.
In addition, I also thank you to Prof. António Alberto Teixeira Gomes for accepting me to joint this master course, and your encouragement and strong motivation during this course. I thank you all professors of this master course and the staffs from International Office at Faculty of Arts for their support during the course and activities.
Further gratitude to National Geography Department, Ministry of Home Affairs, Laos for providing the data and advice in this thesis. Finally, I would like to thank my family who always supports and encourages me with their best wishes and confidence. Without them, I would go this far.
10
Resumo
As alterações no uso e ocupação do solo (LULCC) causadas por actividades humanas directas e indirectas têm consequências a nível local e global. No Laos, com destaque para as áreas urbanas, as práticas de uso do solo relacionadas com expansão da agricultura, urbanização e desflorestação afectam o o solo enquanto recurso finito, e contribuem para a degradação dos recursos naturais. No distrito de Kaysone Phomvihan, uma das principais cidades do Laos, verifica-se uma forte degradação e um ritmo intenso de conversão do solo associado aocrescimento económico e urbano ao longo das últimas décadas.
Este estudo parte do pressuposto que o entendimento dos padrões de LULCC e das suas forças motrizes são imprescindíveis para projectar os processos de LUCC e suas tendências espaciais para futuro no sentido de fornecer pistas e conhecimentos relevantes para a tomada de decisão. Portanto, o estudo tem como objectivo analisar alterações no uso e ocupação do solo e as suas forças motrizes para um período de vinte anos, entre 1997 e 2017. Tem ainda como objectivo complementar simular os padrões de uso e ocupação do solo para o anode 2022, num cenário BAU. A área de estudo é o distrito de Kaysone Phomvihan, onde se irão aplicar dados resultantes de detecção remota e fontes estatíticas, e combinar métodos provenientes de detecção remota, sistemas de informação geográfica e estatística, afim de aplicar um modelo de análise de forças motizes e de simulação do uso e ocupação do solo.
Os resultados revelam que as forças próximas do uso e ocupação do solo longo do período de vinte anos foram a conversão da floresta em vegetação herbácea e/ou arbustiva e a vegetação herbácea e/ou arbustiva convertida área da urbana e em área para agricultura. A área florestal teve a maior diminuição e a área construída teve o maior aumento. Além disso, variáveis biofísicas e socioeconómicas também contribuíram significativamente para as estas conversões, nomeadamenteo declive, a temperatura, a densidade populacional, a distância ao urbano, as estradas e à rede hidrográfica.
A tendência espacial da expansão urbana foi principalmente o oeste do distrito. As tendências espaciais da expansão agrícola e as conversões florestais foram a sul e a leste do distrito. Finalmente, o modelo simulado para 2022 evidencia que os padrões de uso e
11
ocupação do solo de 2017 para 2022 são ligeiramente diferentes. A área florestal terá ainda maior perda devido à conversão para área agrícola e para área urbana.
Palavras-chave: alterações de uso/ocupação do solo, forças motrizes, detecção remoto, sistemas de informação geográfica, análise estatística, modelação e simulação espacial, Kaysone Phomvihan.
12
Abstract
Land use and land cover changes (LULCC) caused by direct and indirect human activities have a wide range of consequences at local and global level. In Laos and its main cities, land use practices related to agriculture expansion, urbanization and deforestation have an effect on land use and natural resource degradation. Kaysone Phomvihan district is one of the main city in Laos that is facing with land use degradation from those practices due to an economic and urban growth over decades in the district that resulted in land use conversion and land concession widely.
Since, understanding in LULCC patterns and the driving forces are needed to project LULCC processes and their spatial trends, which will provide relevant knowledge that is a useful guideline for policymakers and civil society. Therefore, this research aims to analyze LULCC and the driving forces in the period 1997-2017 in order to simulate LULCC patterns for the year 2022 in Kaysone Phomvihan district by using remote sensing data, geographic information systems combined with statistical analysis and LULCC model.
The results revealed that the proximate drivers of LULCC over the 20 years were forest conversion to shrubland, and shrub area converted to agriculture and urban areas, which forest area was the highest decrease and built-up area was the highest increase. Moreover, both biophysical and socio-economic variables had significantly contributed to LULC conversions such as slope, temperature, population density, proximate to town, roads and to water sources.
Since, the spatial trend of urban expansion was mostly in the western of the district. For the spatial trends of agriculture expansion and forest conversions were in the southern to the eastern part of the district.The simulated LULCC model in 2022 found that LULC patterns of 2017 and 2022 were slightly different. Forest area still was the highest loss due to the conversion to agriculture and built-up areas that had driven by economic and urban growth in the district.
Keywords: LULCC, driving forces, remote sensing, geographical information systems, statistical analysis, LULCC model, Kaysone Phomvihan district.
13
Index of Figures
Figure 1.1: Methodology of this research to achieve research objectives and questions ...23 Figure 2.1: Proximate/direct drivers and underlying/indirect drivers of LULCC (Geist and Lambin, 2002; Lambin et al., 1999; Turner II et al., 1995)...26 Figure 2.2: Passive sensor (reflected energy) and active sensor (emitted energy) (source: GrindGIS ) ...31 Figure 2.3: Five components of CA: lattice, cell state, neighbor, transition rule and time (White and Engelen, 2000) ...37 Figure 3.1: Geographical location of Kaysone Pmomvihan district (source: NGD Laos) ...39 Figure 3.2: The East-West Economic Corridor route between Myanmar, Thailand, Laos and
Vietnam (source: ADB 12). ...42 Figure 3.3: The East-West Economic Corridor route through three districts: Kayson Phomvihan, Phine and Dansavan (source: ADB 2012). ...42 Figure 3.4: Road network in Kaysone Phomvihan district connects with East-West Economic Corridor And Lao-Thai Friendship Bridge (source: ADB 2012). ...43 Figure 3.5: Kaysone Phomvyhan urban zone, three main construction projects and Special Specific Economic Zone sites (A, B, C) are in Kaysone Phomvyhan district except site C is in Seno district (S) (source: ADB 2015). ...45 Figure 4.1 Study framework applied in this study ...47 Figure 4.2: Data analysis processes in this research ...48 Figure 4.3: The RGB bands combination considered for the supervised classification of the years 1997 (A), 2003 (B), 2007 (C), 2013 (D) and 2017 (E) ...53 Figure 4.4: Binary map of forest to shrub conversion: 0 not changed and 1 changed ...55 Figure 4.5: Biophysical variables that include rainfall (A), temperature (B), altitude (C), Slope (D) and soil type (E) ...60 Figure 4.6: The population density of the years 2000 (A), 2005 (B), 2010(C) and 2015(D) ...62 Figure 4.7: Proximate the nearest area to town (A), villages (B), roads (C) and to water Area (D) ..64 Figure 4.8: Example dataset of shrub to built-up conversion in period 1997-2003 that includes the Dependent variable (red color) and the independent variables (blue color). ...66 Figure 5.1: LULC classes of the year 1997, 2003, 2007, 2013 and 2017 ...74 Figure 5.2: Changes of LULC classes in four periods ...74 Figure 5.3: Classified LULC map in the years 1997(A), 2003(B), 2007(C), 2013(D) and 2017(E) .75 Figure 5.4: LULC classes in gain and loss over the study period ...76 Figure 5.5: Three LULC conversions considered as the main proximate drivers of LULC changes over the study period ...77 Figure 5.6: Three main LULC conversions map ...78 Figure 5.7: Spatial trends of the three LULC conversions map ...79
14
Figure 5.8: The ROC and AUC of three land use conversion models ...85
Figure 5.9: The probability of forest to shrub conversion in the over study period...86
Figure 5.10: The probability of shrub to permanent agriculture conversion in the over study period ...86
Figure 5.11: The probability of shrub to built-up conversion in the over study period ...87
Figure 5.12: The Reference LULC map 2017 and the simulated LULC map 2017 ...88
Figure 5.13: Multi-resolution included 4 plots of simulated LULC in 2017 ...90
Figure 5.14: LULC map 2017 and simulated LULC map 2022 ...91
Figure 5.15: Three main LULC conversions map between 2017-2022 based on Cellular Automata simulation ...92
Figure 5.16: LULC conversion probability 2022 indicates in percentage from the highest (certain areas) to the lowest (uncertain areas). ...93
15
Index of Tables
Table 1.1: Land use group and type with the percentage of distribution (Source: Boutthavong et al.,
2016) ...19
Table 2.1: Categories and subtype of LULCC model (Lambin et al., 2001). ...35
Table 3.1: The population census in Kaysone Phomvihane district ( source: Japanese International Cooperation Agency JICA 2015) ...40
Table 3.2: The proportion of the population engaged in each sector in 2010 by (Source: JICA 2015) ...40
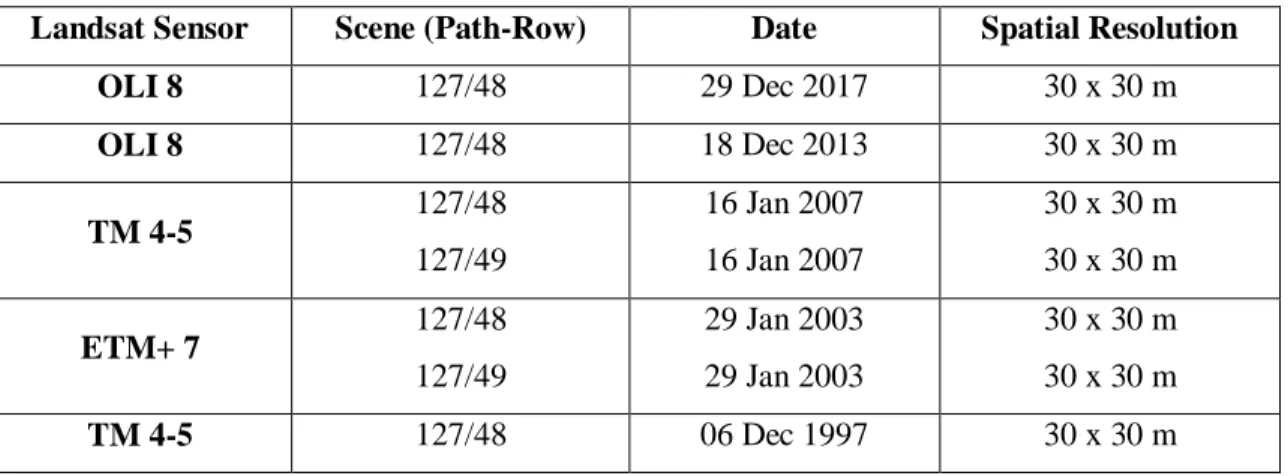
Table 4.1: Landsat images used in this study from USGS site ...49
Table 4.2: Calibration file of Landsat OLI in 2007 ...50
Table 4.3: Landsat sensors information for calibration files ...51
Table 4.4: Criteria of land use classes based on the Laotian Ministry of Agriculture and Forestry. .52 Table 4.5: Binary code of LULC conversions ...55
Table 4.6: Biophysical and socio-economic variables for MBLR analysis. ...56
Table 4.7: The population density in Kaysone Phomvyhan District...61
Table 4.8: The dependent and the independent variables included in 15 datasets ...65
Table 4.9: Variance inflation factor (VIF) scale ...67
Table 5.1: LULC classes in km2 and % in the year 1997, 2003, 2007, 2013 and 2017 ...73
Table 5.2: LULCC of the different classes in Km2 and % for four periods ...73
Table 5.3: LULC class conversions between 1997-2017 ...76
Table 5.4: Correlation test based on Pearson’s rank ...79
Table 5.5: Three LULC conversion models in each period...83
Table 5.6: Changed areas in km2 and in % between the reference LULC map 2017 and the simulated LULC map 2017 ...88
Table 5.7: Kappa and correctness of the simulated LULC map in 2017...89
Table 5.8: Changed areas in km2 and % between LULC in 2017 and LULC in 2022 ...90
16
Abbreviations
ATCOR: Atmospheric and Topographic Correction
ASTER: Advanced Spaceborne Thermal Infrared Emission and Reflectance Radiometric AUC: Area Under Curve
CA: Cellular Automaton
CEC: Cation Exchange Capacity
DHUP: Department of Housing and Urban Planning DN: Digital Number
DBH: Diameter Breast Height DEM: Digital Elevation Model
EIA: Environmental Impact Assessment EWEC: East-West Economic Corridor EO: Earth Observation
ETM+: Enhance Thematic Mapper Plus FPR: False Positive Rate
GDP: Gross Domestic Product GDEM: Global Digital Elevation Map
ISRIC: International Soil Reference and Information Center JICA: Japanese International Cooperation Agency 2015 Lao PDR: Lao’s People Democratic Republic
LFA: Land Forest Allocation LST: Land Surface Temperature LULC: Land Use and Land Cover
LULCC: Land Use and Land cover changes LR: Logistic Regression
17 MBLR: Multi Binary Logistic Regressions
MOLUSCE: Modules for Land Use Change Evaluation NIR: Near Infrared
NUSS: National Urban Sector Strategy OLI: Operational Land Imager
ODA: Official Development Assistance
PDPI: Provincial Department for Planning and Investment PLMO: Provincial Land Management Office
RS: Remote Sensing
ROC: Receiver Operating Curve RGB: Red Green Blue
SEDAC: Socioeconomic Data and Application Center SPSS: Statistical Package for Social Sciences
SSSEZ: Savan-Seno Special Economic Zone
SSEZ: Special-Specific Economic Development Zone SEDP: Socio-Economic Development Plan
SWI: Short Wave Infrared
TB: At-satellite Brightness Temperatures TM: Thematic Mapper
TOA: Top of Atmosphere TPR: True Positive Rate
USGS: United States Geological Survey UTM: Universal Transverse Mercator VIF: Variance Inflation Factor
18
Chapter 1 - Introduction
1.1. Background of the study
Land use and land cover (LULC) system are a fundamental part of the Earth's surface, and LULC changes (LULCC) has significant impacts on human society, climate, biodiversity, hydrological cycles, biogeochemical processes (Baldyga et al., 2008; Lambin et al., 2001; Were et al., 2014). LULCC are the intended employment and management strategy that placed on the land by human agents or land managers to exploit the land use and reflects human activities such as industrial and residential zones, agricultural fields, grazing, deforestation, and mining among many others that have affected on land and natural resources at local and global level (Chrysoulakis et al., 2004; Zubair, 2006).
Since 1950, the world population increased exponentially and this growth is producing major changes in LULC. In some countries, intensive agriculture is producing massive deforestation while in cities, unplanned or inadequately managed urban expansion is leading to rapid sprawl, pollution, and environmental degradation, together with unsustainable production and consumption patterns (Montgomery et al., 2004).
Over the last fifty years, LULC has undergone dramatic changes (FAO, 2005). LULCC are being mostly influenced by government policies for economic development that promotes the expansion and promotion of agricultural production as well as the infrastructure and urban growth (Fujita et al., 2007; Meyfroidt and Lambin, 2008). In Laos, the development projects although benefit the country’s economy. In the practical, sometimes they resulted in natural resources an environmental impacts (Baird and Shoemaker, 2005; Cornford, 1999).
Baird and Shoemaker (2005) reported that although economic and development policies have good intentions in upgrading local livelihood and descending the poverty. In the practical, sometimes they contribute to a long-term poverty, land and environment degradation and increasing social conflict.
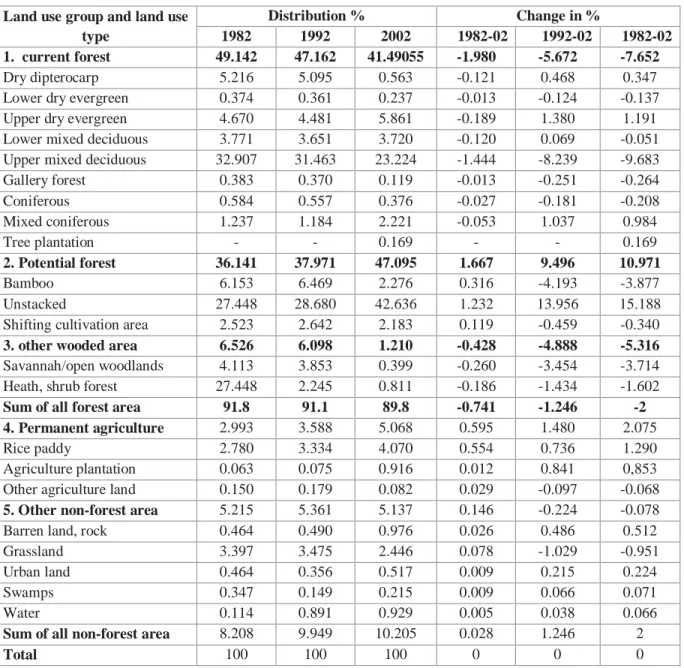
Thus, LULC in Laos has changed dynamically over decades, especially forest areas. In 1982 forest cover was 11,636,900 ha (49%), in 1992 it was 11,168,000 ha (47%) and in 2002 it was 9,824,700 ha (41. %). This reflects a rapid decrease from 1992 to 2002 by 1,343,300
19
ha (5.5%), while from 1982 to 1992 it was only 468,900 ha (2%) (see Table 1.1). Most of these changes are due to unsustainable harvesting, commercial logging, wood extraction, and urban and infrastructure development (Boutthavong et al., 2016).
Table 1.1: Land use group and type with the percentage of distribution (Source: Boutthavong et al., 2016).
Land use group and land use type
Distribution % Change in %
1982 1992 2002 1982-02 1992-02 1982-02
1. current forest 49.142 47.162 41.49055 -1.980 -5.672 -7.652
Dry dipterocarp 5.216 5.095 0.563 -0.121 0.468 0.347 Lower dry evergreen 0.374 0.361 0.237 -0.013 -0.124 -0.137 Upper dry evergreen 4.670 4.481 5.861 -0.189 1.380 1.191 Lower mixed deciduous 3.771 3.651 3.720 -0.120 0.069 -0.051 Upper mixed deciduous 32.907 31.463 23.224 -1.444 -8.239 -9.683 Gallery forest 0.383 0.370 0.119 -0.013 -0.251 -0.264 Coniferous 0.584 0.557 0.376 -0.027 -0.181 -0.208 Mixed coniferous 1.237 1.184 2.221 -0.053 1.037 0.984 Tree plantation - - 0.169 - - 0.169 2. Potential forest 36.141 37.971 47.095 1.667 9.496 10.971 Bamboo 6.153 6.469 2.276 0.316 -4.193 -3.877 Unstacked 27.448 28.680 42.636 1.232 13.956 15.188 Shifting cultivation area 2.523 2.642 2.183 0.119 -0.459 -0.340
3. other wooded area 6.526 6.098 1.210 -0.428 -4.888 -5.316
Savannah/open woodlands 4.113 3.853 0.399 -0.260 -3.454 -3.714 Heath, shrub forest 27.448 2.245 0.811 -0.186 -1.434 -1.602
Sum of all forest area 91.8 91.1 89.8 -0.741 -1.246 -2
4. Permanent agriculture 2.993 3.588 5.068 0.595 1.480 2.075
Rice paddy 2.780 3.334 4.070 0.554 0.736 1.290
Agriculture plantation 0.063 0.075 0.916 0.012 0.841 0,853 Other agriculture land 0.150 0.179 0.082 0.029 -0.097 -0.068
5. Other non-forest area 5.215 5.361 5.137 0.146 -0.224 -0.078
Barren land, rock 0.464 0.490 0.976 0.026 0.486 0.512
Grassland 3.397 3.475 2.446 0.078 -1.029 -0.951
Urban land 0.464 0.356 0.517 0.009 0.215 0.224
Swamps 0.347 0.149 0.215 0.009 0.066 0.071
Water 0.114 0.891 0.929 0.005 0.038 0.066
Sum of all non-forest area 8.208 9.949 10.205 0.028 1.246 2
20
According to FAO (2000), the LULCC related to agriculture expansion, urbanization and deforestation in Laos have caused land use and natural resource degradation, with 84% of the soils moderately degraded. In addition, agriculture and urban expansion are among important causes of the deforestation and LULC conversion in the potential or nearby cities in Laos. Thus, the deforestation and LULC conversion in this region have become a major issue in environmental change.
The knowledge and understanding of LULCC in Laos are still sparse. There are lacks in spatial perception about LULCC and in data acquisition to support LULC dynamic and the future changes analysis. These are main obstacles to provide the essential solutions for the spatial planning and decision-making.
In fact, most of LULC research in Laos focus on the change patterns and the driving forces context but without spatial context in predicting and modelling the future changes. Since LULCC model in the future is a new approach for the study area, which is important for giving the spatial planning information and land use planning. Only a few LULC research were referred (ADB, 2015; ELSA, 2015; PDPI, 2009; Nolintha and Masami, 2011), but they did not apply spatial prediction because the prediction of the future LULCC is a more difficult task as it requires comprehensive knowledge of the interaction between the driving forces(Riebsame et al., 1994).
Thus, an understanding of the spatial-driven relationships related to LULCC will help to address pertinent questions that are related to location and quantity changes such as: where are LULC changes taken place? What is the rate of change likely progress? And what is the future process? (Pontius Jr and Schneider, 2001).
This dissertation will focus on Kaysone Phomvihan district in order to analyze LULCC and the driving forces. Kaysone Phomvihan district is the main city in Savannakhet province that is the second largest province and most intensive population in Laos after Vientiane Capital.
This study area was chosen because few studies spatially related with LULCC were implemented for this area, and also because Kaysone Phomvihan district is one of the major cities in Laos that is currently having a strong economic development and urban growth that have an impact on LULCC (UNDP, 2011).
21
In fact, the economic and urban development over last decades in the district has influenced land resource demands and land concession widely, which is also causing a problem in land use management and planning in the district (Luanglatbandith, 2007). According to ADB (2012), the core problem in urbanization of Kaysone Phomvihan district is taking place with minimal coordination, inadequate infrastructure and insufficient concern for environmental impacts. This results in disorganized growth, inefficient land use, damage and loss of natural resources and inadequate access to urban services. These problems can be attributed to poor urban management, and spatial planning, poor connectivity between urban planning and environmental management, and insufficient investment in infrastructure and community services. Understanding land use patterns and changes as a major importance in this context. Since, accurate and timely information of land use change is highly necessary to many related spatial planning sectors and actors for estimating levels and rates of deforestation, urbanization, wetland and soil degradation and many other landscape-level phenomena (Vogelmann et al., 2001).
Remote sensing data coupled with geographic information systems (GIS) and statistical analysis are effective tools to identify, analyze and understand LULCC patterns (DeFries et al., 2010; Long et al., 2007; Serneels and Lambin, 2001; Verburg et al., 2004). Many studies have proved to achieved a good spatial modeling and prediction of the future LULCC through the several models such as logistic regression, Cellular Automata and Agent-based (Swart, 2016; Araya and Cabral, 2009; Serneels and Lambin, 2001; Jaimes et al., 2010; Lambin and Geist, 2006; Serra and Pons, 2008; Seto and Kaufmann, 2003; Were et al., 2014).
Therefore, this study focuses on applying remote sensing data and GIS technique integrated with the statistical approach and LULCC model to analyze the LULCC patterns and the driving forces in Kaysone Phomvihan, Savannakhet province over 20 years from 1997-2017 in order to predict LULCC in 2022.
This will provide relevant knowledge and data, which are useful guidelines for the local government and civil society in formulating the strategies and master plans to ensure that it will contribute to address the land use issues and to achieve sustainable development.
22
1.2. Research objectives and questions
The main objective of this research is to analyze the LULCC and the driving forces over 20 years from 1997-2017 in Kaysone Phomvihan district. From this complementary objective is to simulate LULCC for the future. The specific objectives are the following:
1. To analyze the LULCC patterns of forest area, permanent agriculture area, built-up area, shrub area and water bodies in the years 1997, 2003, 2007, 2013 and 2017.
2. To identify the proximate drivers and spatio-temporal trends of the changes, and quantify underlying drivers that have influenced LULCC.
3. To apply multi binary logistic regression method in analyzing the spatial relationship between the dependent and independent variables of LULCC. 4. To simulate LULCC for the year 2022.
5. To give spatial information to support land use planning and decision-making. In order to achieve these objectives, the research questions were formulated as the following:
1. What are the LULCC patterns of forest, permanent agriculture, built-up, shrub and water? And what are the proximate and underlying drivers, and their spatial trends?
2. What are the relationships between the dependent and the independent variables? 3. Does the simulated LULCC model achieve the accurate result to predict LULCC
in the future? And what are the future LULCC?
4. What the spatial planning will be considered on the LULCC in the study area?
1.3. Method
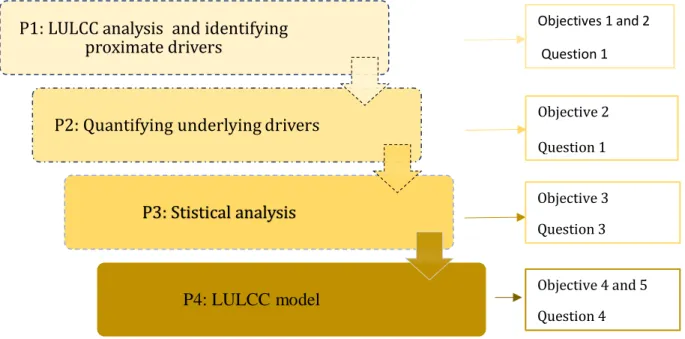
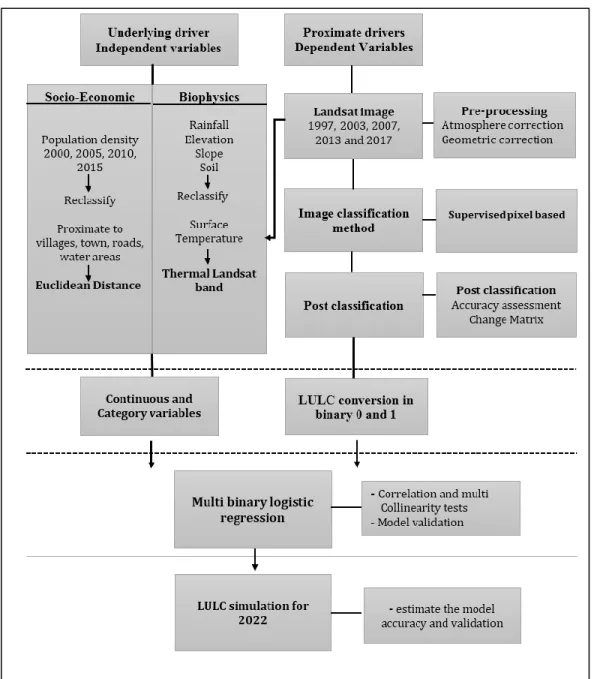
Figure 1.1 describes the methodology in this study in order to achieve the research objectives and questions. The methodology is divided into four phases as the following:
Phase 1: The objectives are to classify the satellite images by a supervised algorithm in order to analyze LULCC in the periods of 1997-2003, 2003-2007, 2007-2013 and 2013-2017. Then, the main LULC conversions and their spatial trends were identified as the proximate
23
drivers (dependent variables) of LULCC. Since, the proximate drivers will be utilized for multi binary logistic regression analysis.
Phase 2: The aims are quantifying the underlying drivers and preparing the independent variables for multi binary logistic regression. The underlying drivers in this study include biophysical and socio-economic variables (Geist and Lambin, 2002; Kissinger et al., 2012).
Phase 3: The objective is to analyze the spatial relationship between the dependent variables (proximate drivers) and the independent variables (underlying drivers) in order to explain the probability of LULC conversions.
Phase 4: The objectives are applying LULCC model to estimate the predictive ability and the accuracy of the model, and then validating the result. If the result achieved acceptable accuracy, then the LULC simulation for 2022 will be conducted.
Figure 1.1: Methodology of this research to achieve research objectives and questions.
1.4. Thesis organization
This thesis has been divided into seven chapters. The first chapter is an introduction that presents an overview of the thesis: the research background, objectives, questions and
P1: LULCC analysis and identifying proximate drivers
P2: Quantifying underlying drivers
P3: Stistical analysis P4: LULCC model Objectives 1 and 2 Question 1 Objective 2 Question 1 Objective 4 and 5 Question 4 Objective 3 Question 3
24
the thesis outline. The second chapter is the literature review on the related theoretical framework and documents that can be formed the research methodology and investigation. The third chapter is an introduction to the study area and related information such as geographical location, background, socio-economic and relevant research in the study area. The fourth chapter corresponds to the data and methodological part. This chapter introduces the study approach in each stage, the specific methods, data and material used, especially introducing the analysis process to achieve the research objectives and questions. The fifth chapter describes the main results of satellite image classifications, the proximate and underlying drivers, as well as the results of multi binary logistic regression and simulated LULCC model. These results were reviewed and discussed in the sixth chapter that explains the main findings related to the relevant studies and research. Finally, the seventh chapter presents the main conclusions and recommendations. In this section, key findings and critical points that need further treatment have been forwarded as a recommendation for related sectors and future work.
25
Chapter 2 - Literature review
2.
1. LULC conceptThe expression of “land use” and “land cover” are very frequent and can be easily confused. However, both definitions are important. According to Lambin et al. (2001), land cover points to the biophysical attributes of the Earth’s surface whereas land use is the human purpose or intent applied to these attributes on the way the land cover is used.
According to NOAA (2017), land cover indicates a region that is covered by forests, wetlands, impervious surfaces, agriculture, and other land and water types. Land cover can be identified by analyzing satellite and aerial imagery. Land use is how people use the landscape whether for development, conservation, or mixed uses, the different types of land cover are managed or used differently by human agent, policy and interest.
Land use is the intended employment and management strategy placed on the land use by human agents, or land managers to exploit the land use and reflects human activities such as industrial and residential zones, agricultural fields, grazing, logging, and mining among many others (Chrysoulakis et al., 2004; Zubair, 2006).
According to FAO (1998), land use “is characterized by the arrangements, activities and people that undertake in a certain land cover type to produce, change or maintain it”. Thus, this expression “establishes a direct link between land cover and the actions of people in their environment”. Similarly, Lambin and Geist (2006) defined land use as “the purpose for which humans exploit land cover” that includes “both the manner in which biophysical attributes of the land are manipulated and the intent underlying that manipulation, i.e., the purpose for which the land is used”.
In this research, the data used were the classified satellite images to analyze land cover classes and integrate with the spatial data included biophysical and socio-economic variables in order to analyze the change patterns and how land is used in the study area. Therefore, the terms “land use and land cover” (LULC) was used in this research.
26
2.2. Drivers of LULCC
LULCC can be caused by several factors related to the complex interaction between social, political, economic, technological and biophysical variables (Geist and Lambin, 2002). Thus, considerable research has been conducted to identify the drivers of LULCC: from urban processes of land use change (Lambin et al., 2001; Seto and Kaufmann, 2003) to deforestation in tropical regions (DeFries et al., 2010; Geist and Lambin, 2002; Houghton, 2012) and to agricultural expansion and land use changes in mountainous ecosystems (Alexander et al., 2015; Mottet et al., 2006; Serra and Pons, 2008).
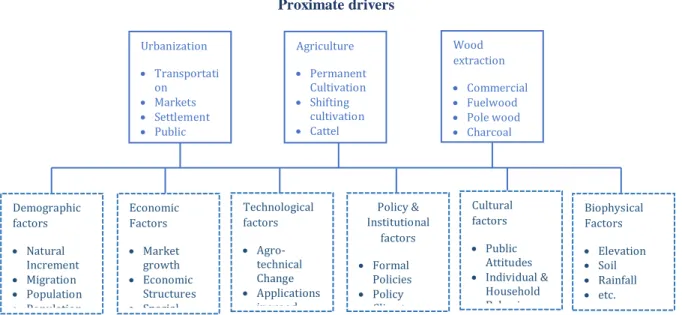
According to several authors, the causes of LULCC can be categorized as direct (proximate) or indirect (underlying) drivers (see Figure 2.1). The direct causes comprise human activities that could arise from the continuous use of land and directly alters driven forces for instance urbanization, deforestation, agriculture expansion, wood extraction. On the other hand, indirect causes are fundamental forces that strengthen more direct causes of LULCC include economic, biophysical, political/institutional, socio-cultural and technology (Geist and Lambin, 2002; Lambin et al., 1999; Turner II et al., 1995).
Urbanization Transportati on Markets Settlement Public Service Agriculture Permanent Cultivation Shifting cultivation Cattel Ranching Wood extraction Commercial Fuelwood Pole wood Charcoal Production Demographic factors Natural Increment Migration Population Population Economic Factors Market growth Economic Structures Special Technological factors Agro-technical Change Applications in wood Policy & Institutional factors Formal Policies Policy Climate Cultural factors Public Attitudes Individual & Household Behavior Biophysical Factors Elevation Soil Rainfall etc. Underlying drivers Proximate drivers
Figure 2.1: Proximate/direct drivers and underlying/indirect drivers of LULCC (Geist and Lambin, 2002; Lambin et al., 1999; Turner II et al., 1995).
27 2.2.1. Proximate drivers
The proximate or direct drivers are the human activities and actions that have a direct effect on LULCC (Geist and Lambin, 2002; Jaimes et al., 2010; Kissinger et al., 2012). The urbanization, agriculture expansion, deforestation and infrastructure development are among the drivers of LULCC.
In terms of urbanization, it has an impact to agricultural and forest lands that are generally accompanied by an increase in energy use, high demand of natural resources and food that lead to urban growth and land concessions (Braimoh and Onishi, 2007). The urban areas account for only 2% of the Earth's surface but over half of the world's population nowadays resides in cities (UN, 2014). These exert tremendous pressures on land and its resources, especially in developing countries. According to Weier (2002), over the next century, urbanization is predicted to move at a rapid pace. It is estimated that worldwide migration towards the cities increases at three times the rate of population growth. In addition, FAO (2011) estimated that in 2050, 100 million hectares of land would be transformed for residential, industrial and infrastructure purposes, and more than 90% of lands in less developed countries.
The development of infrastructure is correlated with urban growth and also leads LULC conversion, especially in Latin America, Asia and Africa (Geist and Lambin, 2002; Hosonuma et al., 2012; Kissinger et al., 2012). Since, better access to markets is correlated with land use conversion by infrastructure can trigger market development, cash crop adoption and economic growth. Infrastructure extension can be a component of rural development and settlement policies that drive market integration (Kissinger et al., 2012).
In the context of agricultural expansion has tremendous impacts on habitats, biodiversity and land use changes. Foley (2011) estimates that worldwide agriculture land has already cleared or radically transformed 70% of the world’s prehistoric grasslands, 50% of savannas, 45% of temperate deciduous forests and 25% of tropical forests. Agriculture is mainly expanding in the tropical region where it is estimated that about 80% of new croplands are replacing forests (Geist and Lambin, 2002).
Multiple studies argue that agriculture expansion causes forest conversion and it results in deforestation: the development of subsistence or commercial agriculture can cause forest
28
loss (Alexander et al., 2015; Kissinger et al., 2012; Hosonuma et al., 2012). Global food demands increase agriculture production and agricultural cropland expansion, which lead land use change associated with the deforestation: the forest conversion to permanent cropland, cattle ranching and shifting cultivation. These have an influence on the deforestation, especially in mainland Asia, Latin America and Africa (Kissinger et al., 2012). In case of shifting cultivation, the deforestation was driven by slash-and-burn agriculture is more widespread in upland zones of Asia than elsewhere (Kissinger et al., 2012; Geist and Lambin, 2002).
Another factor that explains deforestation can be the extraction of wood (for either commercial use or fuelwood for domestic use) (Hosonuma et al., 2012). The commercial wood extraction is frequent in both mainland and insular Asia. In Africa, the harvesting of fuelwood by individuals for domestic uses are associated with wood extraction and deforestation (Geist and Lambin, 2002).
2.2.2. Underlying drivers
The underlying drivers are fundamental (social) processes that underpin the proximate causes and either has an indirect impact on local and national or global level (Geist and Lambin, 2002). Kissinger et al. (2012) stated that there are complex interactions of social, economic, political, cultural and technological processes that affect the proximate drivers. Several studies mention an extra group of environmental or biophysical drivers as explaining forces for LULC (Aguiar et al., 2007; Jaimes et al., 2010; Were et al., 2014). Thus, these underlying drivers can be divided into environmental or biophysical, economic, demographic, policy, technological, cultural, and institutional drivers (see Figure 2.1). They can be considered as interconnected concepts, all linked to each other and operating in multiple scales (Geist and Lambin, 2002).
Economic growth: Economic drivers are essential to consider when explaining land use changes (DeFries et al., 2010; Geist and Lambin, 2002; Kissinger et al., 2012). Market growth, rising income of population, commercialization or change in poverty rates can all have an influence on the conversion of land use (Aguiar et al., 2007; Geist and Lambin, 2002). Other research mentioned that economic growth based on the export of primary
29
commodities and increasing demand for timber and agricultural products in the global economy is identified as the main indirect drivers of deforestation and degradation across the tropical countries (Kissinger et al., 2012).
Population growth: Population growth and density are extensively discussed as an important driver for land use change (Kissinger et al., 2012; Alexander et al., 2015). The growth of urban population places pressure on rural landscapes for commercial agriculture (DeFries et al., 2010). Mutoko et al. (2014) argued that population growth increase the demand for food, and leads to agricultural intensification in developing countries.
Policy: The policy framework has an influence on how land is used to change regulations that can have enormous effects on land use. There is a number of developing countries that suffer from a causation link between rural poverty, land degradation and deforestation such as poor rural households abandoning degraded land to frontier forested lands, cropping in poor soils lead to further degradation, and finally, it leads to land abandonment and land conversion (Barbier, 2000).
Biophysical: Usually refers to catastrophic factors that lead to sudden shifts in the human-environment condition (Geist and Lambin, 2001). It comprises the natural processes of the environment such as climatic variations, topography, drainage, soil type and geomorphic processes. Verburg (2004) noted that biophysical factors mostly do not drive land use change directly, they can cause LULCC (through climate change) and they influence land use allocation decisions (soil quality).
Socio-cultural: Cultural factors often affect economic and policy drivers, public attitudes, values and beliefs toward the environment are important that how land is used in terms of socio-culture aspect (Geist and Lambin, 2002). Understanding values and beliefs of communities are essential in particular towards people and the future generations that can contribute to land use management and planning (Geist and Lambin, 2002).
Technological: Technological progress also fosters growth in individual city size because of knowledge accumulation leads to enhance urban scale economy or improving the ability to manage cities through transport technologies that have increased access to land and greater access to markets that have an impact to land use and finally, the conversion (Gruber and Peckham, 2009).
30
2.2.3. Identifying LULCC Drivers in Laos
Few studies identified LULCC drivers in Laos, Thongmanivong et al. (2006) examined land use change patterns and the driving forces of socio-economic development by farmer’s decisions regarding changing land use in areas along the new North-South Economic Corridor that passes through Luang Namtha and Bokeo provinces in northwestern Laos over the period 1995 -2005. This research found that one of the reasons for the rapid expansion is increasing trade and investment with neighboring countries. This driver is quite complex and includes large land concessions, medium to small-scale investments, as well as household based activities.
Okamoto et al. (2014) studied LULCC in a village of the Vientiane municipality, the results found that there were two different processes and causality linkages from urban process to forest degradation and fragmentation due to commercial logging and wood extraction are significant processes with more than one third of the study area converted to shrubland and degraded forest.
For the forest loss caused by urbanization and development in Laos were explained by Mabbitt (2006) that the most basic factors are high demand for wood and non-wood forest products in wood-deficient markets in some countries, shifting cultivation practices and forest fires are still the main causes as well as the conversion of forest land to permanent agricultural land and infrastructure development. However, a reason for this agriculture expansion is the fact that increased population and economic growth that led farmers to change their future view from subsistence agriculture to economy perspective (Fujita et al., 2007).
Another study has pointed out that other factors of forest loss in Laos are due to: 1) unsustainable wood extraction from forest; 2) pioneering shifting cultivation; 3) agricultural expansion; 4) industrial tree plantation; 5) mining; 6) hydropower development; 7) infrastructure development; 8) fire and 9) urban expansion (Kulik, 2014).
Therefore, the driver of LULCC in Laos can be referred as the direct drivers (proximate) that alter from human activities include urbanization, land concession, deforestation. The indirect drivers increased LULCC that have an influenced by socio-economic process:
31
urbanization due to the economic and population growth, change subsistence agriculture to commercial agriculture production that leads forest and shrub lands conversion, and wood extraction and shifting cultivation lead to the deforestation.
2.3. Remote sensing for LULCC classification
Maktav et al. (2005) stated that traditional data collection methods such as demographic data, census and sample maps were not satisfactory for the purpose of urban land use management. The accurate information of LULCC is therefore highly essential to many sectors. To achieve this, remote sensing data can be used and it provides LULC useful information.
Remote sensing (RS) refers to the science or art of acquiring information of an object or phenomena in the Earth's surface without any physical contact with it. Moreover, this can be done though sensing and recording of both reflected or emitted energy and then the information is processed, analyzed and applied to a given problem (Campbell, 2002) (see Figure 2.2).
Figure 2.2: Passive sensor (reflected energy) and active sensor (emitted energy) (source: GrindGIS ).
32
RS provides an efficient approach to monitor and detect land cover changes. The RS data are one of the primary sources extensively used for change detection in recent decades (Lu et al., 2004). The RS is important for estimating levels and rates of deforestation, habitat fragmentation, urbanization, wetland degradation and many other landscape phenomena (Campbell, 2002).
The number of RS applications for urban studies has showed the potential to map and monitor urban land use and infrastructure. Herold and Menz (2001) mentioned that urban land use information with high thematic, temporal and spatial accuracy that derived from remote sensing data is an important condition for decision support to city planners, economists, ecologists and resource managers. Generally, LULCC have a wide range of impacts on environmental and landscape attributes that include the quality of water, land and air resources, ecosystem processes and functions (Rimal, 2011). Therefore, the use of RS data and image processing techniques provide accurate, timely and information for detecting and monitoring changes in LULC.
In order to analyze LULCC, image classification results with high accuracy are mandatory. Image classification refers to the extraction of different classes or themes that usually were categorized from the satellite image classification (Weng, 2012). The classification using RS techniques have attracted the attention of research community as the results of the classification are the backbone of environmental, social and economic applications (Rimal, 2011). Lu and Weng (2007) categorized the image classification methods into supervised, unsupervised, parametric, nonparametric, subpixel, and many others. Some image classification methods are discussed as follows:
Supervised classification method: land cover classes are defined. The reference data are available and used as training samples. The signatures generated from the training samples are then used to train and classify the spectral data into a thematic map (Lu and Weng, 2007).
Unsupervised classification method: clustering-based algorithms are used to partition the spectral image into a number of spectral classes that is based on the statistical information inherent in the image. This method has no prior definitions of the classes are used. The analyst
33
is responsible for labelling and merging the spectral classes into meaningful classes (Lu and Weng, 2007).
Parametric method: Gaussian distribution is assumed, the parameters (e.g. mean vector and covariance matrix) are often generated from training samples. When the landscape is complex, parametric classifiers often produce ‘noisy’ results. Another of the major drawback is that it is difficult to integrate ancillary data, spatial and contextual attributes, and non-statistical information are needed for the classification procedure (Lu and Weng, 2007). parametric method: without an assumption about the data is required. Non-parametric classifiers do not employ statistical parameters to calculate class separation. This method is especially suitable for incorporation of non-remote-sensing data into a classification procedure (Lu and Weng, 2007).
2.4. LULCC model
A way to understand LULCC dynamics and their drivers is to model LULCC. Several studies showed that the models of LULCC can be divided into two broad categories: non-spatial and non-spatial (Jaimes et al., 2010; Lambin and Geist, 2006; Serneels and Lambin, 2001; Serra et al., 2008; Seto and Kaufmann, 2003; Were et al., 2014). The first category models analyze the magnitude and rate of LULCC, without considering a spatial variation. The second, on the other hand, focuses on LULCC at a specific spatial level (for instance administrative units) and detects spatial variation of LULCC in the biophysical, socioeconomic and policy context (Seto and Kaufmann, 2003; Huang et al., 2007).
The spatial LULCC models are important for understanding LULCC processes. The knowledge of drivers in time and space is needed, in order to do this, the identification of proximate drivers is necessary for the spatial change prediction whenever insight the underlying drivers is essential for predicting the future drivers of LULCC (Serneels and Lambin, 2001). Specifically, detecting historical trends of the drivers help to construct future scenarios because it broadens knowledge about past and recent drivers (Kissinger et al., 2012; Veldkamp and Lambin, 2001). For instance, information about the development of an underlying driver such as population growth is useful for predicting the future of LULCC (continuous population growth keeps on affecting land use) (Kissinger et al., 2012).
34
Lambin et al. (2001) distinguished several categories of LULCC models: empirical-statistical, stochastic, optimization, dynamic (process-based) and integrated models (see Table 2.1).
Empirical-statistical models identify explicitly the causes of LULCC by using multivariate analysis of possible exogenous contributions to empirically derived rates of the changes (Lambin et al., 2000).
Stochastic models for LULCC consist mainly of transition probability models that describe stochastically processes that move in a sequence of steps through a set of states. The transition probabilities can be statistically estimated from a sample of transitions that occurs during the time interval (Hägerstrand, 1968).
Optimization models techniques originate from the land rent theory that are mostly used in economic context (Kaimowitz and Angelsen, 1998). The models are based either linear programming at the microeconomic level, and general equilibrium models at the macroeconomic scale (Kaimowitz and Angelsen, 1998; Lambin et al., 2000).
Dynamic (process-based) simulation models have been developed to analyze LULCC processes and their evolution. The simulation models emphasize the interactions among all components that are based on a prior understanding of the driving forces in LULCC systems and processes (Lambin et al., 2000).
Integrated models are based on combining elements of the different modelling techniques. Therefore, these types of the models are referred to as integrated models, although in many cases they are better described as hybrid models (Wassenaar et al., 1999; Lambin et al., 2000).
No matter which model type is used, modelling of LULCC tries to address at least one of the following questions: 1) Which one of the socio-economic and biophysical variables contribute most to an explanation of LULCC and why? 2) Which locations are affected by LULCC? 3) What rate do LULCC progress and when? (Lambin et al., 2001). The LULCC models that were used in this study are discussed as the following sections.
35
Table 2.1: Categories and subtype of LULCC model (Lambin et al., 2001).
Category of models Representative models
Statistical models
Linear Regression Models
Econometric Models
Multinomial Logit Models
Canonical Correlation Analysis Models
Stochastic models
Natural-Sciences Oriented Model Approaches Markow Modeling of land use
GIS-Based Modeling of Land use change Cellular Automata
Agent-based
Optimization models
Linear Programming Models. Single and Multi-Objectives
Dynamic Programming
Goal Programming, Hierarchical Programming, Linear and Quadratic Assignment problem, Bonlinear Programming Models
Utility-Maximization Models
Multi-Objective/Multi-Criteria Decision-Making Models Spatial interaction models
(Dynamic models)
Potential models
Intervening opportunities models Gravity/spatial models
Integrated models
Gravity-spatial interaction based and Lowery type integrated models Simulation integrated models
Urban/Metropolitan level simulation models Regional Level simulation Models Global Level Simulation Models Input-Output-Based Integrated Models.
2.4.1 Logistic regression model
Logistic regression (LR) quantifies the relationship between the drivers and probability of LULCC. LR model has been used to project the future LULCC, which are based on the past trends and drivers that determine the conversions between the different categories of LULC (Millington et al., 2007; Were et al., 2014). LR measures the probability of particular LULCC process from the given drivers (Rossiter and Loza, 2012). Moreover, it can estimate the direction and intensity of the independent variables (explanatory variables) by predicting the probability outcome associated with each category of the dependent variable that can be used to map where the probability occurred on LULC conversion.
The LR has been used in deforestation analysis (Geoghegan et al., 2001; Pontius Jr and
Schneider, 2001), agriculture (Serneels and Lambin, 2001), and urban growth model (Allen,
36
process analysis, and the outcomes are reasonably well (Irwin and Geoghegan, 2001). Allen (2003) also highlighted the use of LR to identify which variables are most appropriate to represent the urban change process and LR had a good explanation of the spatial relationship. Since, as LR is widely used and the satisfactory model for LULCC study. Therefore, LR was considered the proper model for this study in order to quantify the spatial relationship between drivers and explain how the drivers influence LULCC.
2.4.2. Cellular Automata model
Cellular Automata (CA) provides the powerful tool for the dynamic modelling of LULCC that is a method to take spatial interactions into account. The roots of CA in geography can be traced in ”A Monte Carlo approach to diffusion” by (Hagerstand,1965). The CA estimates the taken time in transition that can generate complex spatial
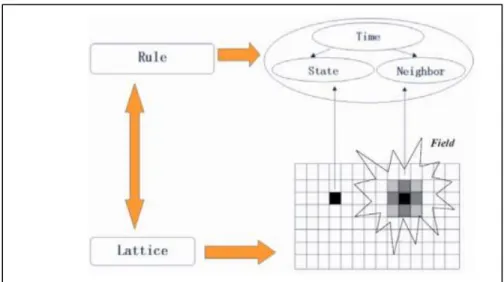
patterns from the simpleset of rules and predicts LULCC in the future(Singh, 2003). The CA essentially comprises the following elements: 1) a cell spaceor lattice, 2) a finite set of cell states, 3) a definition of a cell’s neighborhood, 4) a set of transition rules to compute a cell’s statechange and 5) time steps in which allcell states are simultaneously updated (White and Engelen, 2000)(see Figure2.3). The CA model alsorequiresGIS-based input asimageformat such as land use maps, road maps, protected areas, etc.
The CA are manyhas theability to performthe spatial dynamics and time explicitly. CA canbeincorporated with thespatial component and it addresses dynamism with simple rulesthat increasescomputational efficiency. SincethecomputationalefficiencyofCAleads it becomes favorite LULCC modeller (Singh, 2003). Besides, the ability of CA that represents the complex systemswith spatialand temporal behaviours from a set ofsimple rules and states that made this technique very interesting for geographers and urban researchers(Alkheder and Shan, 2005).Wagner(1997)mentioned that CA can be considered asthe analyticalengine of GIS.
37
Figure 2.3: Five components of CA: lattice, cell state, neighbor, transition rule and time (White and Engelen, 2000).
38
Chapter 3 - Study area
3.1. Geography
Kaysone Phomvihane district is the capital city of Savannakhet province. The district is located between latitude 16° 26' 33'' N and 16° 44' 53'' N, and between longitude 105° 01' 26'' E and 106° 44' 10'' E. It has a total area of 701.18 km2.
In terms of climate, the district has a tropical savanna climate with little subtropical climate characteristics as the city located 16.4° north of equator. The hottest month is April with a temperature varying from 29.5 °C to 35.2 °C while the coolest month is December with the temperature from 15.2 °C to 28.7 °C. The city experiences dry season during winter months and wet season during summer months due to activation of monsoon. The driest month is December with a precipitation total 2.0 millimeters (0.079 in), while the wettest month is August with precipitation total 323.1 millimeters (12.72 in) (Reid, 2015). In what concerns landscape, the district has 90% of large flat areas and 10% are hills. The large flat areas are mainly covered by agricultural activities and important forest areas as well as the settlement area in the western district and along the Mekong River (see Figure 3.1).
Kaysone Phomvihan district is the second-largest city in Laos after Vientiane Capital and the district is along the Mekong River-front in the western that shares the border with Moukdhan province, Thailand (LNBSS, 2015) (see Figure 3.1). The district has a favorable position. Since, it is considered as the crossroad between the northern and southern Laos. This marks a geographical advantage in the opportunity to attract foreign investment into the district (Nolintha and Masami, 2011). Especially, the second Lao-Thai friendship bridge is currently booming economy that has brought the new commercial development in the northern part of Kaysone Pomvyhan town (LNBSS, 2015).
39
Figure 3.1: Geographical location of Kaysone Pmomvihan district (source: NGD Laos).
3.2. Socio-economic and demographic context
Fidloczky (2002) studied urban land use development in Laos and the result found that the urban expansion results mainly from strong socio-economic development and increased population in urban centers, which is partially due to immigration trends from rural towards urban areas. In relation, urban areas in Laos have increased in size since 1992 from 84,000 ha to 135,000 ha in 2002. This equals an average increase around 5000 ha per year and this trend is likely to continue.
40
Based on the 2015 Population and Housing Census (National Statistics Center, NSC), the population of Kaysone Phomvihan district was approximately 90,900 and a total number of households was 12,252, which gives an average household size of 5.8. In terms of sex distribution, the female population was 38,914 and accounting for 51% of the total population that was slightly higher than the male population of 37,991(49%) (ADB, 2015). The population density of the district is 17 people /ha but the city center of Kaysone Phomvihan district has a relatively high population density of 75 people/ha. The Japanese International Cooperation Agency (JICA) projected populations to 2030 by that time the population of the district is expected to increase of 128,200 by 2030 (ADB, 2015) (see Table 3.1).
Table 3.1: The population census in Kaysone Phomvihane district ( source: Japanese International Cooperation Agency JICA 2015).
Year Total Population
2010 78,900
2015 90,900
2020 101,700
2025 114,500
2030 128,200
In 2010, about 60% of households in the district are engaged in the commercial and service sectors that reflect an increasing number of medium and large trading and commercial enterprises in the district. Over 38% of the households are engaged in agriculture including small-holder farming, rice production, livestock and poultry raising and fish farming. Only a small proportion of the households is involved in handicraft making and home-based activities (ADB, 2015) (see Table 3.2).
Table 3.2: The proportion of the population engaged in each sector in 2010 by (Source: JICA 2015).
Sector % of HHs
Agriculture and forestry 38.3
Handicraft 1.3
41
Based on the gross domestic product (GDP), over the last three year periods 2007 to 2010, the economy of Kaysone Phomvihane district grew from 9.4% to 9.8%. The GDP per capita increased from US$712 in 2006 to US$1,027 in 2010 and reached to US$1,464 in 2014. Three main sectors contributed to this growth, namely agriculture sector (with a share of 20.9% of GDP in 2006 to 20.3% in 2010), service sector (GDP share reducing from 48.2% in 2006 to 46.6% in 2010) and industrial-commercial sectors (its share of GDP with 30.8%) (ADB, 2015).
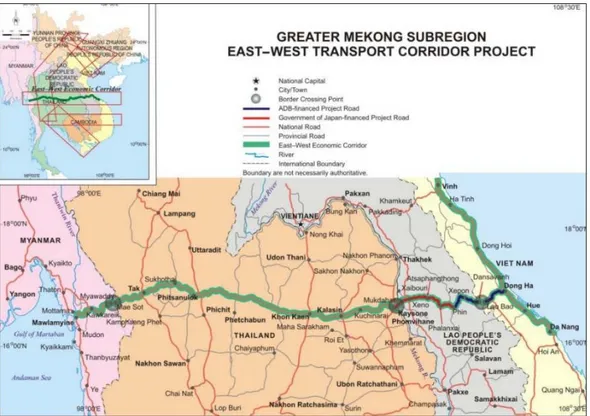
These GDP growths can be due to the strategic positioning of the district at the crossroads between the EWEC (East-West Economic Corridor) connecting to Thai and Vietnamese road networks, and the Mekong River by second Lao-Thai friendship bridge (see Figure 3.2-3.4). In fact, after the second Lao-Thai friendship bridge was completed, the number of foreign and joint-venture companies in the district is doubled in the province between 2005 and 2008 from 30 projects in 2005 to 70 projects in 2008.
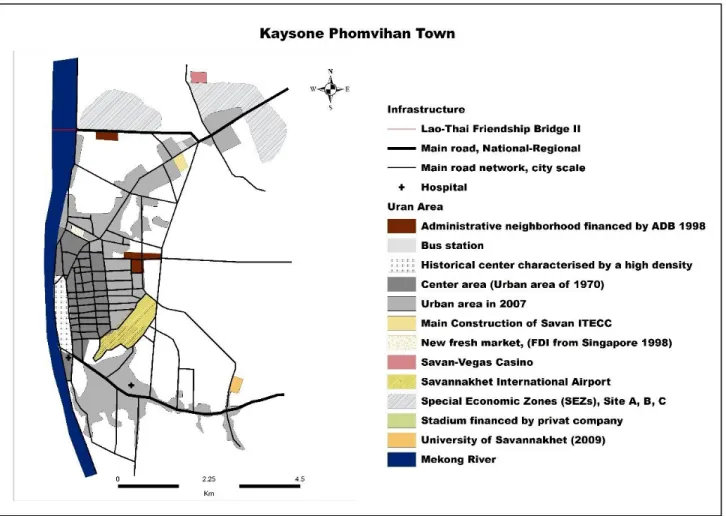
It is noteworthy that 12 projects have a major impact to land use in the northern city area that is near to the bridge and only three projects are in the historical city center (see Figure 3.5). Especially, Savan-Seno Special Economic Zone (SSSEZ), the SSSEZ has showed dynamism that influences urban land use, the initial plan is identified two sites, and then this plan has been modified to 600 hectares with four sites: Savan City (A), Logistic Park (B), Savan Park (C) and a resettlement site (D). All these sites are located in the northern urban area that is near the bridge (site A), along route number 9 (sites C and D), except site B located in Seno district (ELSA, 2015; ADB, 2012, 2015) (see Figure 3.5).
42
Figure 3.2: The East-West Economic Corridor route between Myanmar, Thailand, Laos and Vietnam (source: ADB 2012).
Figure 3.3: The East-West Economic Corridor route through three districts: Kayson Phomvihan, Phine and Dansavan (source: ADB 2012).
43
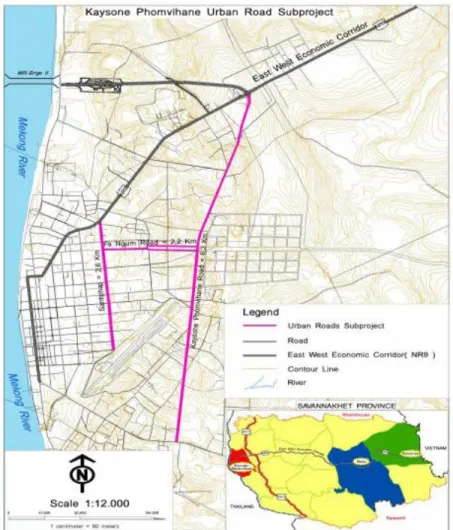
Figure 3.4: Road network in Kaysone Phomvihan district connects with East-West Economic Corridor and Lao-Thai Friendship Bridge (Source: ADB 2012).
3.3. Land use planning and urban development in Laos
Over the last two decades, considerable investments have been made in urban areas in Lao PDR by the government itself and through the assistance of development partners. These have resulted in significant improvements to urban environments and living conditions in many small, medium, and large urban centers (ADB, 2012).
According to ADB (2015), the National Urban Development agenda is contained in the draft of National Urban Sector Strategy (NUSS) that was prepared by the Department of Housing and Urban Planning (DHUP) of the Ministry of Public Works and Transport (MPWT). The NUSS sets out a range of objectives, policies and programs to develop all
44
urban areas from the provincial capital to village clusters. It intends to strengthen the capacity of urban management authorities and create favorable conditions for civil society and private sector to actively participate in urban planning, management and sustainable development.
The Provincial Government of Savannahket gives special emphasis on the provision of essential infrastructure in the urban center where the majority of the local population resides (PDPI, 2009). The provision of infrastructure gives priority for improving and upgrading of the urban roads and drainage systems, installation of wastewater treatment facilities and expansion of sewerage/sanitation systems, and riverside embankment works for both protection and provision of tourism facilities.
Kaysone Phomvihave Urban Master Plan was approved in 2001. The Master Plan included the land use plan, road network planning, facility system and building regulation. Most of the current urban development activities such as road network improvements, land use management and city organization being undertaken in Kaysone Phomvihane district that is based on the Master Plan (ADB, 2015; Nolintha and Masami, 2011). The updated Kaysone Phomvihane socio-economic development plan (SEDP) identified key land management and infrastructure projects for the priority investments. These include the essential urban development projects such as residential areas, road network improvements, industry zone and natural protected areas. The plan also included the priority to support the development and environmental protection (ADB, 2015).
The Official Development Assistance (ODA) and foreign private investments were the main actors of the urban transformations through three important projects in Kaysone Phomvihan district. Before these transformations, the district was organized on the north-south axis, along the Mekong River and parallel streets that gathered administrative buildings, equipment, residential areas, main market and temples (Nolintha and Masami, 2011). Three main construction projects had later an impact on city organization and functional zone (see Figure 3.5). The first project is the displacement of the fresh products market from the city center to the north of the urban perimeter in 1998. The second project that changed the city organization under the Secondary Towns Project in 1998. Since, most of the administrative buildings that spread along the Mekong River have been relocated to a new-built neighbourhood on the east side of the city. The last project also has a specific
45
function; it is the construction of the stadium in 2005 in the northern city to host the 7th National Games. These three projects aim to establish new functional centers in the district that is outside the perimeter of the historical city center (Nolintha and Masami, 2011; ADB, 2015). These new city centers have been designated along the East-West Economic Corridor, which is envisioned to be the future centers of economic activities for the district (see Figure 3.5). These locations are considered for the expanding commercial and business establishments such as supermarkets and shopping malls, restaurants and hotels. These will serve as the tourist destination in the district and province.
Figure 3.5: Kaysone Phomvyhan urban zone, three main construction projects and Special Specific Economic Zone sites (A, B, C) are in Kaysone Phomvyhan district except site C is in Seno district (S) (source:ADB: 2015).