Beatriz Jorge Coelho
Licenciatura em Ciências de Engenharia de Micro e Nanotecnologias
A Digital Microfluidics Platform for Loop-Mediated
Isothermal Amplification of DNA
Dissertação para obtenção do Grau de Mestre em Engenharia de Micro e Nanotecnologias
Orientador: Professor Doutor Rui Alberto Garção Barreira do Nascimento Igreja, Departamento de Ciências dos Materiais, Faculdade de Ciências e Tecnologia –
Universidade Nova de Lisboa
Co-orientador: Professor Doutor Pedro Viana Baptista, Departamento de Ciências da Vida, Faculdade de Ciências e Tecnologia – Universidade Nova de Lisboa
Júri
Presidente: Professor Doutor Rodrigo Ferrão de Paiva Martins Arguente: Professor Doutor José Ricardo Ramos Franco Tavares Vogal: Professor Doutor Rui Alberto Garção Barreira do Nascimento Igreja
Isothermal Amplification of DNA
© Beatriz Jorge Coelho
Faculdade de Ciências e Tecnologia
Universidade Nova de Lisboa
A Faculdade de Ciências e Tecnologia e a Universidade Nova de Lisboa têm o
direito, perpétuo e sem limites geográficos, de arquivar e publicar esta dissertação
através de exemplares impressos reproduzidos em papel ou de forma digital, ou
por qualquer outro meio conhecido ou que venha a ser inventado, e de a divulgar
através de repositórios científicos e de admitir a sua cópia e distribuição com
objetivos educacionais ou de investigação, não comerciais, desde que seja dado
crédito ao autor e editor.
i
Acknowledgements
This thesis marks the end of one of the most important steps in my life: university. However, it also marks the beginning of my future as a professional worker. As Lucius Annaeus Seneca would say, somewhere around the first Christian decades, every new beginning comes from
other beginning’s end. This new beginning would have never been possible without the
precious assistance of many people, which is why the first page of this thesis is entirely dedicated to them.
First of all, I would like to thank Professor Rodrigo Martins and Professor Elvira Fortunato, for bringing my course to life and for taking Portuguese Nanotechnology to the highest level in the world. The work you have developed over the past years, as well as the worldwide acknowledgement that you have achieved, were two of the reasons that motivated me to choose Micro and Nanotechnology Engineering.
Secondly, to my parents, who are truly responsible for who I am and what I have achieved. Their endless patience and willingness to help in everything they could was a key factor to the completion of this manuscript. Thank you for always being there, in all the happy and sad moments, whether I was gleefully cheerful or with an unprecedented bad mood. Thirdly, I would like to thank those who are carelessly and repeatedly forgotten, even though they are the most loyal and faithful of friends. To my dogs, Aquiles and Bianca, thank you for always receiving me with so much joy whenever I get home, whether rain is pouring or the sun is shining.
Then, to my closest friends, Eunice Beijinho, Cláudio Brito, Priscila Deister and Helena Gaspar thank you so much for always being around for the past 17, or even 23 (!) years. You may be short in numbers, but believe me when I tell you that you are truly 4 in 7.4 billion people. And, of course, there is also a very long list of people to thank in the four institutions that were my home for the past months: CENIMAT, CEMOP, Department of Life Sciences (DCV) and Department of Materials Science (DCM).
Beginning with the physics/materials half of my academic life, special thanks are in order to Inês Cunha, for all her advice and support, to Andreia Santos, for being my ever patient official care-taker and also to Tiago Carvalho, the first adviser I ever had. I would also like to thank Paul Grey, Raquel Barras, and Pedro Freitas for their eternal good mood and for waiting for me at lunch time. I mustn’t forget thanking the “background people”, who are not directly involved with my work and yet are fundamental to its success: Lídia Ricardo, Ana Santa, Carolina Marques, Alexandra Gonçalves and Sónia Pereira.
As for the biology part of my work, I would like to thank Fábio Carlos, Pedro Pedrosa, Mílton Cordeiro and Raquel Vinhas for being always available to enlighten me about anything, and for maintaining their poise even while being fiercely attacked by thousands of questions. You’re all absolutely brilliant. I would also like to thank my colleagues and friends from the 315 laboratory: Ana Sofia Matias, Cindy Oliveira and Ana Rita Mendes. To Sofia, thank you so much for teaching me how to spell my first biological procedures and how to count with pipette tips and microtubes. To Cindy, thank you for being my wingman(woman) when I was busy dividing myself between both edges of the campus, and thank you for your great sense of humor and terrible taste in music. To Rita, thank you for brightening my day with your contagious wit, and for our great, smiley chats about the not-so-great parts of our work. Also, thank you, António Lopez, for helping me catch the train more often, and for all your optimistic kindness. And, of course, last but not least, I would like to thank the hybrid (or should I say, high breed?) Bruno Veigas for all the Snape-like harangues and preposition-ending sentences which taught me how to think, criticize and act (almost) like a full-fledged researcher.
ii Moreover, I would like to thank both my supervisors, Professor Rui Igreja and Professor Pedro Baptista, for their precious guidance throughout my work, and for bearing with my stubbornness.
I would also like to thank Professor Hugo Águas, for his precious tips on photolithography, and for allowing me to work at the DCM clean room.
Also, to my colleagues from the best course in the entire world, thank you so much for making the last 5 years the most memorable years of my life. Thank you for teaching me how to work as a team and for showing me the importance of helping others, both inside and outside our work group. In particular, I would like to thank Joana Cerdeira, for her optimism, and for having the highest percentage of strength per kg. To Mónica Machado, thank you for bringing such high doses of laughter to my life. I will always remember your funniest moments! Trust yourself a bit harder, and you will go far. Thank you both for endless chit-chats during lunch time! I would also like to thank Miguel Franco for your brilliant, wonderful dark humour. Your gloomful, black star always shines over my pink world. Bring the hammer, Miguel!
iii
Abstract
Digital Microfluidics (DMF) is an innovative technology for liquid manipulation at microliter- to picoliter-scale, with tremendous potential of application in biosensing. DMF allows maneuvering single droplets over an electrode array, by means of electrowetting-on-dielectric (EWOD), that allows changing the contact angle of a droplet over a dielectric. Each droplet is thus considered a microreactor, with an unparalleled potential to perform chemical and biological reactions. Several aspects inherent to DMF platforms, such as multiplex assay capability and integration capability, make them promising for lab-on-chip and point-of-care (PoC) applications, e.g. DNA amplification assays or disease detection. DNA detection strategies for PoC have been profiting from recent development of isothermal amplification schemes, of which Loop-mediated Isothermal Amplification (LAMP) is a major methodology, allowing a 109-fold amplification efficiency in one hour.
Here, I demonstrate for the first time the effective coupling of DMF and LAMP, resulting in a DMF device capable of performing LAMP reactions.
This novel DMF platform has been developed and characterised, which allows successful amplification of a c-Myc gene fragment by LAMP. Precise temperature control is achieved by using a transparent heating element, connected to a looping feedback control system. This platform is able to amplify just 0.5 ng/µL of the target DNA, in only 45 minutes, for a device temperature of 65 °C and a reaction volume of 1.62 µL, one of the lowest volumes ever reported. Moreover, the electrophoretic analysis indicates that the amplification efficiency of the on-chip LAMP is considerably higher than that from the bench-top reaction.
Keywords: Digital Microfluidics, Loop-mediated Isothermal Amplification, c-Myc, lab-on-chip, point-of-care diagnostics.
v
Resumo
A Microfluídica Digital (MFD) é uma tecnologia inovadora que permite manipular líquidos à escala dos microlitros a picolitros, apresentando um tremendo potencial de aplicação em biossensores. A MFD permite manobrar gotas individuais sobre uma matriz de elétrodos, através do fenómeno electrowetting-on-dielectric (EWOD), que por sua vez permite a alteração do ângulo de contacto de uma gota sobre um material dielétrico. Cada gota pode então ser considerada um microreator, com um potencial extraordinário para realizar reações químicas e biológicas. Vários aspetos inerentes a plataformas de MFD, tais como a sua capacidade para ensaios multiplex ou a sua capacidade de integração, tornam-nas bastante promissoras para aplicações lab-on-chip e point-of-care (PoC), p.e. ensaios de amplificação de DNA e deteção de doenças. As estratégias de deteção de DNA para PoC têm beneficiado do desenvolvimento recente de técnicas de amplificação isotérmica, das quais a Loop-mediated Isothermal
Amplification (LAMP) é uma das principais metodologias, permitindo uma eficiência de
amplificação de 109 vezes em apenas uma hora.
Aqui, demonstro pela primeira vez a integração/acoplamento de MFD e LAMP, o que resultou num dispositivo de MFD capaz de realizar reações de LAMP.
Esta nova plataforma de MFD foi desenvolvida e caracterizada neste trabalho, e permite a amplificação de um fragmento do gene c-Myc por LAMP, com sucesso. É possível garantir um controlo de temperatura bastante preciso, através de um elemento de aquecimento transparente ligado a um sistema de controlo com retroalimentação. Esta plataforma permite amplificar apenas 0.5 ng/µL do DNA alvo, em 45 minutos, para uma temperatura do dispositivo de 65 °C e um volume de reação de 1.62 µL, um dos volumes mais baixos alguma vez descritos. Para além do mais, a análise eletroforética indica que a eficiência de amplificação de LAMP no dispositivo é consideravelmente superior àquela de uma reação de bancada.
Termos chave: Microfluídica Digital, Loop-mediated Isothermal Amplification, c-Myc,
vii
Contents
... i Acknowledgements ... i Abstract ... iii Resumo... v Contents ...viiList of figures ...ix
List of tables ... xiii
List of abbreviations ... xv
List of symbols ... xvii
Motivation and Objectives ... xix
1. Introduction ... 1
1.1. Digital Microfluidics ... 1
1.1.1. Digital Microfluidics configurations ... 1
1.1.2. Electrowetting-on-dielectric ... 2
1.1.3. Digital Microfluidics for nucleic acid amplification ... 3
1.2. Loop-Mediated Isothermal Amplification ... 4
2. Materials and Methods ... 7
2.1. DNA extraction ... 7
2.2. Previous study of the LAMP technique ... 7
2.3. Device design and fabrication ... 7
2.4. Device characterisation ... 8
2.5. LAMP on device ... 8
3. Results and Discussion ... 11
3.1. DNA extraction ... 11
3.2. Study of the LAMP reaction for DMF ... 11
3.2.1. Reaction time analysis... 11
3.2.2. Determination of the reaction limit of detection ... 12
3.2.3. Analysis of the reaction volume ... 13
3.2.4. Reaction temperature analysis ... 15
3.2.5. Summary of LAMP parameters for on-chip reactions ... 16
3.2.6. Real-time LAMP analysis ... 16
3.3. Platform design and operation ... 18
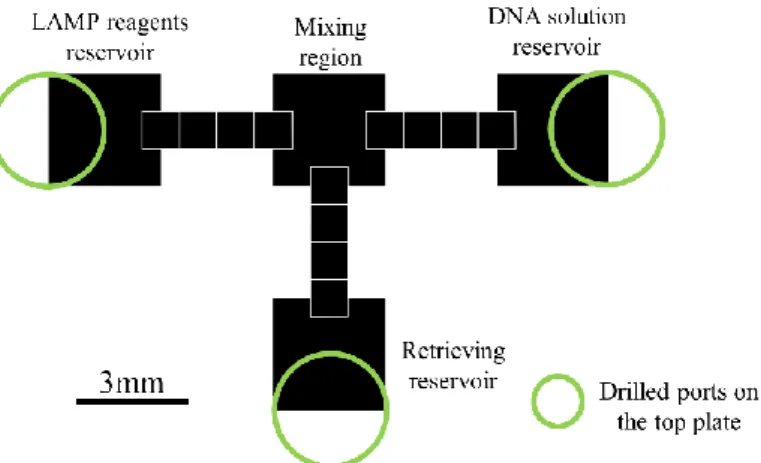
3.3.1. Device layout ... 18
3.3.2. Digital Microfluidics platform operation: required external hardware and droplet manoeuvring on-chip ... 20
3.4. Platform characterisation ... 22
Contents
viii
3.4.1. Parylene C characterisation as a dielectric ... 22
3.4.2. Temperature control evaluation on the Digital Microfluidics platform ... 23
3.4.2.1. Dynamic characterisation ... 24
3.4.2.2. Static characterisation ... 25
3.4.3. Evaluation of platform performance ... 26
3.4.3.1. Novel droplet input/output method ... 26
3.4.3.2. Fluidic operations ... 26
3.4.3.3. Droplet velocity... 27
3.4.4. LAMP on-chip ... 28
4. Conclusions and Future Perspectives ... 33
References ... 35
Annex 1 – Comparison between DMF platforms for nucleic acid amplification ... 39
Annex 2 – Comparison between PCR and LAMP ... 40
Annex 3 – Plasmid DNA extraction by alkaline lysis protocol ... 41
Annex 4 – Loop-mediated Isothermal Amplification reagents and target DNA ... 42
Annex 5 – Additional device electrode/reservoir configurations ... 43
Annex 6 – Heating system... 44
Annex 7 – ITO thin film resistor characterisation ... 45
Annex 8 – Modeling of Parylene C capacitors, with chromium contacts ... 47
Annex 9 – Error determination for material thicknesses ... 49
ix
List of figures
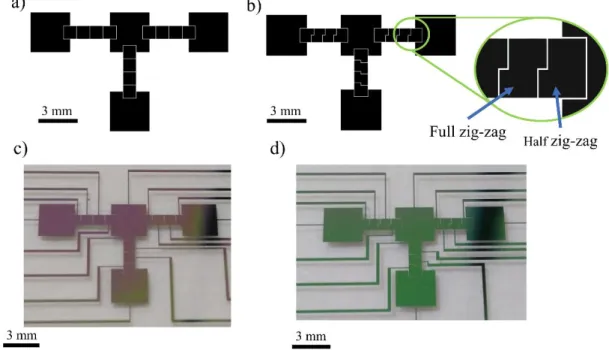
Figure 1.1: a) One-plate (left) and two-plate (right) configurations for DMF devices (not to scale); b) fluidic operations for a two-plate configuration: splitting, merging, mixing and dispensing (the latter was adapted from reference 1). ... 2 Figure 1.2: Schematic representation of a LAMP process. ... 5 Figure 3.1: Electrophoretic analysis of the PCR-amplified extraction product, including positive and negative controls, in comparison with a DNA ladder. ... 11 Figure 3.2: Electrophoretic analysis of the LAMP products obtained for the reaction time analysis (30 min., 45 min. and 60 min.), in comparison with a DNA ladder. ... 12 Figure 3.3: Electrophoretic analysis of the LAMP products for reaction detection capabilities, with 60 min. and 90 min. reaction time, in comparison with a DNA ladder. 10-fold dilutions were performed for initial DNA concentrations ranging from 0.5 ng/µL to 0.05 pg/µL. ... 13 Figure 3.4: Electrophoretic analysis of LAMP products obtained for the study of reaction volume reduction, with 60 min. or 90 min. reactions, in comparison with a DNA ladder. ... 14 Figure 3.5: Electrophoretic analysis for the LAMP temperature study, in comparison with a DNA ladder. LAMP reactions were performed with the following conditions: 60 °C, with 5 pg/µL and 0.5 pg/µL initial DNA concentrations and 55 °C, with 5 pg/µL and 0.5 pg/µL initial DNA concentrations. ... 16 Figure 3.6: a) Real-time LAMP analysis for several initial DNA concentrations, at 65 °C. The horizontal green dashed line indicates the fluorescence level chosen to determine the threshold cycles. b) Threshold cycle variation with initial DNA concentration. Each cycle corresponds to 1 min. ... 17 Figure 3.7: Digital microfluidics device layout, evidencing the various regions that comprise the chip, as well as the location of the inlet/outlet ports, drilled on the top plate... 18 Figure 3.8: Proposed device configurations: a) configuration A; b) configuration B, with emphasis on the full zig-zag and half zig-zag electrodes; c) photograph of a configuration A device; d) photograph of a configuration B device. ... 19 Figure 3.9: Overview of the DMF platform, as well as the associated hardware. ... 20 Figure 3.10: Generic steps required to perform a LAMP reaction on the proposed DMF device. ... 21 Figure 3.11: Schematic model for the Parylene C dielectric and the series contact resistance, as measured by the impedance analyser. ... 22 Figure 3.12: Behaviour of the Parylene C capacitor with frequency, in terms of relative permittivity (a) and loss tangent (b). The green dashed line indicates the approximate division between the regime where dielectric properties are dominant, and the regime where contact resistance properties are dominant. ... 23
x Figure 3.13: Schematic representation of the DMF platform, evidencing all the interfaces between different materials, to which correspond different temperatures, as well as the central device temperature (T1 to T5). This schema is not to scale. ... 24
Figure 3.14: Evolution of temperature on the chip with time, namely T1 (bottom plate), T3
(centre of the chip) and T5 (top plate). ... 24
Figure 3.15: Sequential video frames, evidencing the sample input process. ... 26 Figure 3.16: Video frames showing all the possible fluidic operations: dispensing (a), splitting (b), merging (c) and mixing (d). ... 27 Figure 3.17: Droplet average velocity at several operating voltages and constant frequency (5 kHz), for both square and zig-zag electrodes. ... 28 Figure 3.18: Electrophoretic analysis for LAMP on-chip products and reagents, in comparison with a DNA ladder: a) electrophoretic analysis for LAMP on-chip products, performed for 1.62 µL reaction volume, with 63 °C as bottom plate temperature and an initial DNA amount of 10 ng, for 60 min. b) Electrophoretic analysis for the LAMP master mix. ... 29 Figure 3.19: Electrophoretic analysis for LAMP on-chip products and reagents, in comparison with a DNA ladder: a) electrophoretic analysis for LAMP on-chip, performed with 65 °C as bottom plate temperature and an initial DNA amount of 10 ng (trial 1) or initial DNA concentration of 0.5 ng/µL (trial 2), for 60 min. and 1.62 µL. b) Electrophoretic analysis for the LAMP master mix. ... 30 Figure 3.20: Electrophoretic analysis for LAMP on-chip products and reagents, in comparison with a DNA ladder. a) Electrophoretic analysis for LAMP products resulting from an on-device amplification reaction with initial DNA concentration of 0.5 ng/µL and bottom plate temperature of 65 °C. Several reaction times were tested: 15 min., 30 min. and 45 min. b) Electrophoretic analysis for the LAMP master mix. ... 31 Figure A5.1: Additional device configurations: configuration C (a), configuration D (b) and configuration E (c). ... 43 Figure A6.1: Schematic representation of the temperature control system. ... 44 Figure A6.2: Block diagram of the temperature control system, evidencing the continuous loop used to compare the thin film resistor temperature with the setpoint temperature. ... 44 Figure A7.1: Photograph of the ITO thin film resistor used to provide heat for the LAMP reactions, evidencing all the connections to the remaining heating system. ... 45 Figure A7.2: a) Voltage supplied to the thermoresistor, as a function of current. The linear fit corresponds to the first data points, represented in red, where linearity between voltage and current is maintained. b) Required power dissipation at the thermoresistor to generate the intended temperatures. ... 45 Figure A8.1: Cross-configuration of Parylene C capacitors, evidencing one of the individualised capacitors used to analyse the behaviour of the dielectric material with frequency. ... 47 Figure A8.2: Cole-Cole representation of the Parylene C capacitor impedance. ... 48
xi Figure A10.1: Computer-user interface for electrode/reservoir driving. ... 50
xiii
List of tables
Table 3.1: Summary of the results obtained for the study of the LAMP reaction time. “Y” indicates that there was DNA amplification and “N” indicates that there was no amplification.. ... 12 Table 3.2: Summary of the results obtained for the study of the limit of detection in the LAMP reaction. “Y” indicates that there was DNA amplification and “N” indicates that there was no amplification. ... 13 Table 3.3: Summary of the results obtained for the analysis of the reaction volume in the LAMP reaction. “Y” indicates that there was DNA amplification and “N” indicates that there was no amplification. ... 15 Table 3.4: Summary of the results obtained for the analysis of the reaction temperature in the LAMP reaction. “Y” indicates that there was DNA amplification and “N” indicates that there was no amplification. ... 16 Table 3.5: Device specifications for each configuration. ... 19 Table 3.6: Material parameters required for determination of the heat flow across a DMF device. ... 25 Table 3.7: Temperature gradient across a DMF device, for average (200 measurements) bottom plate temperatures of 60 °C and 65 °C. ... 25 Table A1.1: A comparative study of the existing DMF platforms for nucleic acid amplification to date. ... 39 Table A2.1: Main characteristics of PCR and LAMP amplification methods... 40 Table A4.1: LAMP reagents and respective concentrations on LAMP reactions. ... 42 Table A9.1: Thickness measurements for several materials, as well as the respective errors. .... 49
xv
List of abbreviations
µLAMP Micro-Loop-mediated isothermal amplification AC Alternating current
BIP Backward inner primer
Bp Base pair
CEMOP Centro de Excelência de Optoeletrónica e Microeletrónica de Processos CENIMAT Centro de Investigação de Materiais
CT Threshold cycle
CVD Chemical vapour deposition
DC Direct current
DCM Departamento de Ciências dos Materiais DCV Departamento de Ciências da Vida DMF Digital Microfluidics
DNA Deoxyribonucleic acid E-coli Escherichia coli
EDL Electric double layer EWOD Electrowetting-on-dielectric FIP Forward inner primer
GPIB General purpose interface bus
ITO Indium-Tin-Oxide
LAMP Loop-mediated isothermal amplification LB medium Luria-Bertani medium
LOD Limit of detection
MRSA Methicillin-resistant Staphylococcus aureus NASBA Nucleic acid sequence-based amplification PCB Printed circuit boards
PCR Polymerase Chain Reaction PDMS Polydimethylsiloxane
PID Proportional-integral-derivative PoC Point-of-care
PWM Pulse width modulation
RMS Root mean square
RNA Ribonucleic acid SAW Surface acoustic waves
SDA Strand displacement amplification
SMART Signal mediated amplification of RNA technology USD United States Dollar
xvii
List of symbols
C Capacitance
C* Complex capacitance
C’ Real part of the capacitance
C’’ Imaginary part of the capacitance
d Distance between capacitor plates
R Resistance
Rs Series resistance
T Temperature
tan(δ) Loss tangent
V Voltage
Z Impedance
γ Surface tension
γLG Liquid-gas surface tension
ε0 Permittivity in vacuum (8.85×10⁻¹² Fm-1)
εr Relative permittivity, dielectric constant
θ Contact angle
xix
Motivation and Objectives
Digital Microfluidics (DMF) is a versatile and innovative technique for fluid manipulation, which relies on an electrode array to produce electric fields capable of moving picoliter to microliter droplets. Since 2000, this liquid-handling approach has gathered increasing interest from the scientific community, resulting in a wide range of applications, mostly directed to the fields of chemistry, medicine and biotechnology. Immunoassays, chemical synthesis or proteomic procedures performed in droplet microreactors are just some of the possibilities enabled by DMF devices1,2. As a matter of fact, due to their ease of operation, flexibility, multiplex assay capability, as well as growing portability and integration capability, DMF platforms are considered promising candidates for lab-on-chip or even point-of-care applications1,3,4.
Particularly, point-of-care diagnostics have met an enormous increase in demand over the past years, due to a series of factors which include prevalence of diseases in developing countries, rising incidence of lifestyle diseases such as diabetes or a significant trend towards healthcare decentralisation5. It is estimated that the point-of-care diagnostics market will reach a value of
approximately 37 billion USD in 20216. Part of point-of-care diagnostics include genetic testing,
which is particularly relevant in oncology, pharmacogenomics and genetic diseases, three major health areas. As would be expected, this is a high value market, estimated to be worth 7.4 billion USD in 20207.
One of the most important tools in genetic testing is nucleic acid amplification, which relies greatly in Polymerase Chain Reaction (PCR) that is today the gold standard for DNA analysis. However, PCR requires thermal cycling with 3 different temperatures that add complexity to the technique. As such, isothermal nucleic acid amplification methods have been developed in the last decade, with emphasis to Loop-mediated Isothermal Amplification (LAMP).
Having in mind the current need for genetic testing, and considering that there are no publications describing a digital microfluidics platform for nucleic acid amplification based on LAMP, the main purpose of this work is to successfully implement this technique in such a device. This novel chip consists of a two-plate configuration on glass substrate, where the bottom plate includes: 1) a Parylene C dielectric layer; 2) a Teflon® hydrophobic layer and 3) chromium electrodes/reservoirs. The top plate consists of an Indium-Tin-Oxide (ITO) coated glass substrate, which also includes a hydrophobic Teflon® layer and drilled ports partially overlapping the reservoirs for sample/reagent inlet/outlet, by means of a pipette. These ports are also key features of the device, assuring a simpler, easier way to insert and withdraw samples. The gap between bottom and top plates is assured by Kapton® tape. Under the bottom plate, there is an ITO thin film thermoresistor, deposited on a glass substrate, which will provide the required temperature for LAMP reactions. More specifically, this DMF device is divided into four key regions: two main reservoirs to accommodate the target DNA and LAMP reagents, a mixing region where both sample and reagents are mixed and the reaction occurs, and finally another reservoir for product collection, all linked together by 4-electrode paths. The electrodes were produced in two configurations: a standard square electrode configuration, and a novel zig-zag electrode configuration.
Both reservoirs and electrodes are patterned by conventional photolithography, Parylene C is deposited by a specific Chemical Vapour Deposition (CVD) process and Teflon® is deposited by spin-coating. As for the target DNA sequence, a fraction of the c-Myc proto-oncogene was chosen, since the overexpression of this particular gene is associated with a large portion of all human cancers8,9.
In order to achieve the main objective, the following tasks were performed: ♦ Extraction of target DNA;
xx ♦ LAMP optimisation, for further integration in the DMF platform;
♦ Mask design for photolithography;
♦ Optimisation of the photolithographic process, namely Ultraviolet (UV)-light exposure, revelation process and lift-off;
♦ Device fabrication;
♦ Preliminary device testing;
1
1. Introduction
1.1. Digital Microfluidics
Digital Microfluidics is a relatively recent process for microflow control, based on microfluidics. In conventional microfluidics, fluids are constrained to micro-volume spaces and can therefore be controlled and manipulated with very high precision. The use of microfluidic devices versus macrofluidics allows several improvements: both sample and reagent volumes are significantly reduced, the final results or products are obtained in a shorter time, the sensitivity of the processes is increased and the risks associated with toxic reagents or products are decreased10,11. Additionally, portability and process automation due to miniaturisation are also key advantages for the processes’ industrialisation10.
Particularly, DMF is a relatively recent technology for liquid manipulation, which allows the control of discrete picoliter to microliter droplets in integrated systems, by means of electric potentials1,12, magnetic13, thermocapillary14 or optic15,16 forces, and even surface acoustic waves17 (SAW). In addition to the above-mentioned advantages of microfluidic systems, DMF systems eliminate the need for using propulsion devices, such as valves or pumps and allow the precise control of individual unit-sized droplets via pre-established digital control commands1. As a direct consequence of individual droplet control, each droplet may be considered as a microreactor, which in turn allows the mixing of several reagents. Moreover, this technique is perfectly compatible with solid/liquid samples, allowing clogging-free separation of both phases12. There is also no need to change the platform design for different reactions, since DMF devices are often generic and any desired sequence of fluidic operations is possible.
The first literature reference to this type of process dates back to 1986, when Jean Pesant, Michael Hareng, Bruno Mourey and Jean Perbet submitted a patent describing a device by
means of which it is possible to cause fluid globules to circulate within a capillary space by means of pairs of electrodes establishing capture sites18. Later, in the 2000s, DMF studies were continued by two American groups, namely the Fair19 group at Duke University and the Kim20 group at University of California, Los Angeles, which disseminated the technique.
1.1.1. Digital Microfluidics configurations
DMF devices are composed of four elements: substrate, electrodes, a dielectric layer and a hydrophobic layer. Additionally, the droplets may be surrounded by air, or by a filler, to improve actuation. These elements may be arranged in two main configurations: 1) the closed format (or two-plate format), in which droplets are sandwiched between two substrates and 2) the open format (or one-plate format), in which droplets move on a single substrate12. For the first configuration, the top plate is usually a ground electrode made of a transparent, conductive material, thus allowing the user to observe the movement of the droplets and even confirm that certain reactions have occurred (e.g, via colour change). The bottom plate allocates the actuation electrodes, which will allow the user to control the droplet path. As for the second configuration, the bottom plate includes the ground electrode, as well as the actuation electrodes12. In any case, the bottom plate is generally covered by an insulating dielectric. Finally, in order to enhance the electrowetting effect, a hydrophobic layer is applied to their surfaces. Both formats permit the moving and merging of droplets, but only the two-plate format enables splitting and dispensing operations1,21. Figure 1.1 shows the two structures available (a), as well as the various fluidic operations possible on DMF (b).
2 Figure 1.1: a) One-plate (left) and two-plate (right) configurations for DMF devices (not to scale); b) fluidic operations for a two-plate configuration: splitting, merging, mixing and dispensing (the latter was
adapted from reference 1).
The proper choice of component materials is of key relevance in DMF, since it determines the fabrication process, as well as the possible geometries. Substrates are generally made of glass or silicon, due to their chemical inertness. Nonetheless, flexible printed circuit boards (PCB) based on polyimide and copper films have been recently used as substrates by some groups, due to the fact that they allow flexible device fabrication, and also due to their low cost22,23. The contact electrodes are either metallic (e.g. gold, copper, aluminium, chromium) or other conductive materials (e.g. Indium-Tin-Oxide, doped silicon). Furthermore, the dielectric layer may be composed of Parylene, SU-8 or polydimethylsiloxane (PDMS). The hydrophobic layer is typically made of Teflon® or Cytop®1,24. Finally, the filler is generally oil, which allows for lower actuation voltages and prevents droplet evaporation2.
1.1.2. Electrowetting-on-dielectric
The most common approach to DMF relies on the electrowetting-on-dielectric (EWOD) effect. To explain this effect, let us consider a conductive liquid droplet (e.g. water) standing on a non-conductive solid material (e.g. dielectric). In this configuration, several interfaces are present, namely the solid-liquid interface, the liquid-gas interface and the solid-gas interface. The triple contact line is defined as the line along which all 3 phases are in contact. By applying voltage between the droplet and the bottom of the dielectric layer, charge redistribution will be induced along the interface between both materials (liquid droplet and dielectric surface), creating an electric double layer (EDL)25. These charges will then exert lateral pressure at the vicinity of the contact line, due to charge repulsion, and if the interface is deformable, as is the case in study, spreading of the liquid will occur, thus inducing a change in the contact angle10,25. This change in contact angle with the applied voltage (V) may be described by the Lippmann-Young equation26:
3 cos 𝜃 = cos 𝜃0+
𝐶 2𝑑𝛾LG
𝑉2 (1.1)
Where 𝜃0 is the initial contact angle, 𝜃 is the contact angle after voltage application, 𝛾𝐿𝐺 is the
liquid-gas surface tension, 𝑑 is the dielectric thickness and 𝐶 is the dielectric capacitance. It is also noteworthy that, if alternating voltage is applied, the voltage V in equation 1.1 should be replaced by its root mean square value (VRMS).
1.1.3. Digital Microfluidics for nucleic acid amplification
DMF has several interesting applications, namely in the fields of medicine and biotechnology, with microfluidic immunoassays, chemical microreactors, proteomics, diagnostics and also DNA manipulation (e.g. extraction, purification, hybridisation, amplification)1. DNA
amplification is particularly relevant for the present work, which is why this type of DNA manipulation will be emphasized, while other DMF applications to DNA control may be consulted in the above-mentioned bibliography.
DMF has been widely used for a variety of nucleic acid-related applications, such as extraction and purification of RNA27 and DNA23, nucleic acid sequencing28 or real-time hybridisation
monitoring29. However, due to the nature of this work, DMF devices for nucleic acid
amplification will be focused.
Nucleic acid amplification is one of the most relevant tools in molecular biology, allowing the monitoring of gene expression, quantification of food-borne pathogens, diagnostic of hereditary and infectious diseases, as well as numerous forensic analysis processes30. The first theoretical
description of a nucleic acid amplification technique dates back from 1971, when Kleppe et al.31
worked on developing methods for the synthesis of high molecular weight bihelical DNA with
specific nucleotide sequences. However, it was not until 1985 that Mullis et al.32 successfully achieved the first technique for nucleic acid amplification: the polymerase chain reaction. Since then, other amplification techniques have been developed, namely nucleic acid sequence-based amplification (NASBA), signal mediated amplification of RNA technology (SMART), strand displacement amplification (SDA), loop-mediated isothermal amplification (LAMP) and others33.
Particularly, DMF devices have been proved to bring several advantages over standard DNA amplification, namely reagent volume reduction, minimisation of the analysis time and the possibility of process automation1. The first group to achieve DNA amplification with DMF platforms was the Chang group34, by amplifying a detection gene for the Dengue II virus via PCR. With this DMF platform, Chang et al. were able to successfully amplify a sequence of the Dengue-II virus (511 base pairs) in 55 minutes, with a total sample volume of 15 µL. Finally, it should be noted that the droplet actuation voltage and frequency were relatively low: 12 VRMS at
3 kHz.
Another example of DNA amplification using digital microfluidics was developed by Hua et
al.35 that established a DMF platform for real-time multiplexed PCR, fabricated by low-cost microfabrication processes. This group developed a fully integrated system, comprised of a control/detection section and a disposable sample processing section. With this DMF platform, the Hua group performed real-time PCR detection of methicillin-resistant Staphylococcus
aureus (MRSA), Mycoplasma pneumoniae and Candida albicans. MRSA was used to test the
system sensitivity, and it was verified that amplification was possible using just one copy of MRSA genomic DNA. This same DNA was used to optimise the speed of the PCR process, and it was found that variable cycle dwell times (10 s for cycles 1 to 25, 30 s for cycles 25 to 35 and 20 s for cycles 36 to 40) yielded a faster process – 18 minutes in total – with no significant changes in performance (threshold cycle and final reaction product) from the standard 30 s cycle time. Finally, since there are four distinct regions for amplification, multiple PCR processes
4 were performed simultaneously, and successful detection of MRSA and M. pneumoniae was possible.
Several other examples of DMF platforms for nucleic acid amplification may be found in the literature36–42, however, the majority of the platforms rely on PCR, which requires thermal cycling at 3 different temperatures and therefore makes the platform design excessively complex. In annex 1, a comparison between these platforms is available.
In light of the aforementioned facts, it is easily uncovered the lack of a novel DMF device for simple nucleic acid amplification via loop-mediated isothermal amplification, which would have an enormous potential for point-of-care genetic diagnostics.
1.2. Loop-Mediated Isothermal Amplification
Loop-mediated isothermal amplification (LAMP) is an isothermal nucleic acid amplification technique developed by the Notomi group43 in 2000, which allows up to a 109-fold amplification
of a target DNA sequence in just 1 hour, at a relatively low temperature (60 °C to 65 °C). A typical LAMP assay involves 5 main elements: two inner primers, two outer primes and a DNA polymerase with considerably high strand displacement activity. In order to explain the working principle of the technique, let us consider one strand of a target double stranded DNA sequence which comprises the following regions: 1) B3, B2 and B1 near the 5’ end and 2) F3c, F2c and F1c on the opposite end. The outer primer F3 is complementary to F3c, whereas the outer primer B3 is identical to the B3 region of the target DNA. The inner primers (FIP – forward inner primer, and BIP – backward inner primer) consist of two joint sequences each, one of which is complementary to the target DNA sequence (F2, B1c) and the other is identical to the target sequence (F1c, B2). Firstly, following a denaturation step, FIP, which is in higher concentration than F3, hybridises to F2c and primary DNA synthesis is carried out in the 5’-3’direction. F3 then hybridises to F3c in the target DNA and a secondary DNA synthesis process is initiated. Since the DNA polymerase has strand displacement ability, the primarily synthesised DNA strand (p-DNA) is separated from the target sequence, thus allowing the secondary synthesis to be completed. The p-DNA strand contains two complementary regions on the 5’ end, which hybridise to one another, forming a loop. Secondly, a similar DNA synthesis process occurs on the p-DNA strand, with B3 and BIP primers, resulting in the formation of a dumb-bell structure. The fore-mentioned reaction stages represent the first step in LAMP, the starting material production step.
The cycling amplification step begins with the elongation of the 3’ end of the dumb-bell structure, since this region is perceived as a primer by the DNA polymerase, a phenomenon known as self-priming. Furthermore, FIP and BIP continue to hybridise to their complement regions throughout amplification and elongation steps, producing a concatenated DNA string with several loops, containing repeats of the target sequence, and also other by-products43–45. Figure 1.2 illustrates the various steps in a LAMP reaction.
5 Figure 1.2: Schematic representation of a LAMP process: a) FIP bonding to the 3´DNA end; b) complementary strand synthesis by DNA polymerase; c) single-stranded DNA, complementary to the template DNA strand (p-DNA); d) formation of a loop structure at the 5’ end and beginning of a new DNA strand synthesis on the opposite end; e) formation of a new DNA strand, equal to target DNA; f) looping of both DNA strand ends, due to base complementarity, generating a dumb-bell-like structure and g) to i) new DNA synthesis from the looped 3’ and 5’ structures, leading to DNA amplification.
Adapted from reference 46.46
This innovative method offers many advantages over the preferential DNA amplification technique, PCR, such as an exceptionally high amplification efficiency, overall simplicity and lower energy requirements (a single temperature is required), and also high sensitivity43. In annex 2, a comparative table between both techniques may be found.
Recently, several groups have developed conventional microfluidic platforms which aim to produce micro LAMP (µLAMP) reactions47–49. µLAMP offers several advantages over bench-top reactions, such as specific and faster reactions, requiring lower sample/reagent volumes. Moreover, due to the possibility of fully automatic reactions, with no human intervention, µLAMP has the potential of reducing the number of false-positive assays and its sensitivity has been reported to be similar to that obtained in bench-top reactions44.
Having this in mind, the main purpose of this thesis is to join both DMF and µLAMP techniques in a novel and innovative device. This device will be the first to perform DNA amplification by the LAMP method via a DMF chip with an original design, and it will also include a novel and exceptionally straightforward method of inserting and extracting samples in/from the chip: entry ports will be drilled on the top plate, partially overlapping the sample reservoirs.
7
2. Materials and Methods
2.1. DNA extraction
The first step required for nucleic acid amplification is the production of the target DNA sequence (c-Myc, in this case). As such, Escherichia coli (E-coli) bacteria containing a plasmid harbouring a fragment of the human c-Myc gene were inoculated in 100 mL of Luria-Bertani (LB) medium, to which 200 µL of ampicillin (Sigma Aldrich) was added, and incubated under constant agitation, at 37 °C, for 14 hours. Following incubation, alkaline lysis was performed (see annex 3 for details), in order to extract DNA from the bacteria. A PCR reaction was later performed, as to determine if the extracted DNA indeed corresponded to c-Myc. PCR was performed for 20 µL, with 0.4 mM dNTPs each (Fermentas), 1 µM F3 and B3 (StabVida), 0.04 U/µL Taq Polymerase, 1x DreamTaqTM buffer (both from ThermoFisher Scientific) and 10 ng/µL of extracted DNA. For the PCR reaction, an initial denaturation was performed, at 95 °C for 5 min., followed by 20 amplification cycles, each comprising: 1) 30 s denaturation at 95 °C, 2) 30 s annealing at 62 °C and 3) 30 s elongation at 72 °C. A final elongation step was performed, at 72 °C for 5 min.
2.2. Previous study of the LAMP technique
To the best of my knowledge, DNA amplification by the LAMP technique has never been achieved on a digital microfluidics platform. As such, it is of utmost importance to thoroughly study this process before applying it to a DMF device, namely to assess its limits and capabilities. For all the tests mentioned below, the LAMP reaction was performed according to the procedure described by Notomi
et al.43 (for precise reagent description, see annex 4), in a total reaction volume of 20 µL, with the
exception of the volume limit study. Briefly, each LAMP master mix contained 400 µM each dNTPs, 0.8 µM of FIP and BIP, 0.2 µM of F3 and B3, 1 M betaine, 4 mM MgCl2, 1x enzyme buffer and
0.32 U/µL Bst. Prior to each assay, the master mix was prepared, containing all the reagents required for the LAMP reactions, except for the target DNA. For the positive control assays, 19 µL of the reaction mix were added to 1 µL of target DNA, whereas for the negative control, 19 µL of the reaction mix were added to 1 µL of pure water.
Firstly, in order to determine the optimal LAMP reaction time, 20 µL reactions were performed in a thermal cycler (DNA Engine Peltier Thermal Cycler - Bio-Rad) for 30 min., 45 min. and 60 min., at 65 °C, with both positive and negative controls per reaction time. All positive controls contained 0.5 ng/µL DNA concentration. Secondly, as to understand how sensitive the LAMP technique is, 20 µL reactions were performed in the same thermocycler for 60 min. and 90 min., at 65 °C, where positive controls include sequential 10-fold dilutions ranging from a 0.5 ng/µL initial DNA concentration until a 0.05 pg/µL initial DNA concentration. Furthermore, to study the effect of volume reduction, LAMP reactions were implemented in different reaction volumes, namely 20 µL, 15 µL, 10 µL, 5 µL, 2.5 µL, 2 µL and 1.25 µL, for 60 min. and 90 min. reaction time each, at 65 °C. For this study, all reaction volumes were withdrawn from an initial mix containing LAMP reagents at appropriate concentrations (see annex 4) and 0.5 ng/µL DNA concentration. For reaction volumes equal to, or inferior to 5 µL, 5 µL of mineral oil (Sigma-Aldrich) were added. A temperature study was also performed, as to identify the optimal reaction temperature, for 55 °C and 60 °C, during 60 minutes and 90 minutes, for 20 µL as reaction volume and DNA concentrations of 5 pg/µL and 0.5 pg/µL. Finally, the LAMP reaction kinetics was studied in real time by adding 1 µL of EvaGreen (Biotium) fluorophore to the LAMP master mix (the total volume was maintained with water volume reduction) and analysing the fluorescence of the samples with a real-time detection system (Rotor-Gene 6000 - Corbett) for the same DNA concentrations as for the limit of detection study, at 65 °C.
2.3. Device design and fabrication
For the bottom-plate, first of all, two different mask configurations were designed using CorelDRAW X7® software and printed on high-resolution emulsion film photomasks (the latter was performed by
8 and pads, which were printed to glass substrates by photolithography. Before proceeding to the photolithographic process itself, the glass substrates were thoroughly cleaned by immersing the substrates in acetone, isopropyl alcohol and pure water containers, which were placed in an ultrasound bath, for 15 minutes each. As for the lithography process, the glass substrates were initially covered with AZ6632 1.2 µm grade photoresist (MicroChemicals), by spin-coating (Model WS-650MZ-23NPP – Laurell) at 2000 rpm for 10 s, followed by 4000 rpm for 20 s. The substrates were then placed on a hot plate (Isotemp – Fisher Scientific) at 115 °C, for 75 seconds. Following the prebake process, the substrates were roughly aligned in a mask aligner (Karl Suss), since only one step of photolithography was required, and exposed to UV light in the same apparel for an optimised time of 5 s. Finally, the photoresist was revealed using AZ726 MIF developer (MicroChemicals), for an optimised time of 35 s, and the substrates were then immersed in pure water to stop the developing process and dried by a nitrogen jet. After patterning, a 200 nm chromium layer was deposited on the substrates, at 100 °C, by means of a home-made electron-beam (e-beam) evaporation system. Following chromium deposition, lift-off was performed. The substrates were first placed in an acetone bath and were carefully agitated, to facilitate chromium removal. This step was repeated for another two acetone baths, until full dissolution of the photoresist, and samples were then cleaned with isopropyl alcohol and pure water. The lift-off process was controlled visually with the aid of a magnifier (Leica M80), and whenever necessary, a fine brush was used to help remove photoresist (and chromium). A 2 µm**
layer of the dielectric, Parylene C (CAS 28804-46-8), was then deposited on the substrates, by means of a chemical vapour deposition system (SCS Labcoater® - PDS 2010). Finally, a 50 nm* hydrophobic layer of Teflon® AF 1600 (DuPont) was deposited over the dielectric layer. For this purpose, a solution
containing 0.6% wt/wt of Teflon® AF 1600 in Fluorinert FC-40 (DuPont) was spin-coated at 1000 rpm
for 30 s, with a coating acceleration of 100 rpm/s, followed by baking at 160 °C for 10 minutes. The top plate consisted of a glass substrate coated with a 100 nm layer of Indium-Tin-Oxide (ITO), in which holes were mechanically drilled with a diamond tip, partially overlapping the reservoir areas. This plate was further coated with Teflon®, following the procedure described above. The gap between
plates was maintained at approximately 180 µm, by using 3 layers of Kapton® tape (PPC216 - Farnell).
This thickness was confirmed by using a digital micrometer (IP65 - Mitutoyo). Finally, silicone oil (Baysilone® M350 – Siff Chemicals) was used as a filler medium between plates.
2.4. Device characterisation
In order to study the dielectric behaviour of Parylene C, several capacitors were fabricated, by depositing a layer of Parylene C between two crossed layers of chromium, which in turn were deposited by physical evaporation with a home-made e-beam, thus forming a metal-insulator-metal (MIM) structure. The dielectric behaviour (dielectric constant and loss tangent) was analysed over frequency, by means of an impedance analyser (4294A Precision Impedance Analyser – Agilent). Furthermore, an electrode control system, as well as a temperature control system (thin film ITO thermoresistor plus control hardware and software) were adapted to the DMF platform and the latter was further tested, to evaluate its performance and determine the temperature gradient along the chip thickness and the vertical axis of a reaction droplet. In order to do so, real time temperature measurements were performed for 3 bottom plate temperature levels (50 °C, 60 °C and 65 °C). Temperature was measured on both bottom and top plates, by using a thermocouple directly connected to the temperature control system and another thermocouple connected to an AD595 amplifier and a multimeter (Fluke 45 dual display), respectively. Both thermocouple signals were recorded on a computer using a Matlab® script. Finally, a brief evaluation of the DMF platform was performed, where the novel input/output method was analysed, as well as all the fluidic operations and the average droplet velocity. Droplet velocity was determined for both device configurations, by averaging droplet head and tail velocities during the droplet transition from one electrode to the following.
2.5. LAMP on device
LAMP on-chip was performed by adding 8 droplets of LAMP mix reagents to 1 droplet of DNA solution, at either 4.4 ng/µL or 56.5 ng/µL, guaranteeing an initial DNA concentration of 0.5 ng/µL or
9 an initial DNA amount of 10 ng, respectively (trials 1 and 2). Each droplet presented a volume of 0.18 µL (see section 3.3.1), yielding a final reaction volume of 1.62 µL. Trial 1 was initially tested for a 60 min. reaction time and bottom plate temperature of 63 °C. Trial 1 was further tested for 65 °C as bottom plate temperature, with a total 60 min. reaction time. Trial 2 was also tested with the latter conditions. Furthermore, the on-chip LAMP reaction time was studied, where LAMP reactions were performed for 15 min., 30 min. and 45 min., with a bottom plate temperature of 65 °C and initial DNA concentration of 0.5 ng/µL.
11
3. Results and Discussion
3.1. DNA extraction
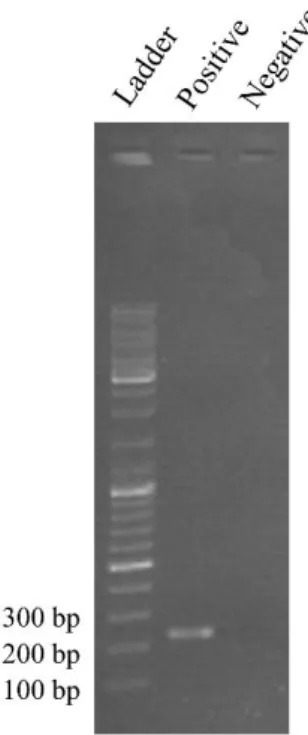
In order to understand whether the DNA extraction had been successful, that is, if the extracted DNA indeed corresponded to c-Myc, a PCR reaction was performed, by resorting to the LAMP outer primers (F3 and B3). Each reaction tube had a final volume of 20 µL and contained 0.4 mM dNTPs (each), 1 µM F3/B3, 0.04 U/µL Taq Polymerase and 1x DreamTaqTM buffer. The positive control also contained 0.5 ng/µL of extracted DNA. 20 cycles were completed, with 95 °C for denaturation, 66 °C for annealing and 72 °C for polymerisation. Figure 3.1 depicts the electrophoretic analysis performed to the final PCR products, resorting to 1% (m/v) agarose gel.
Figure 3.1: Electrophoretic analysis of the PCR-amplified extraction product, including positive and negative controls, in comparison with a DNA ladder.
Resorting to the outer primers, an amplicon size of 229 base-pairs (bp) was expected (see annex 4) from a PCR reaction. As can be seen on figure 3.1, the band on the positive control is located between the 200 bp and 300 bp bands, and it is slightly closer to the 200 bp band, which indicates that the amplicon size is a match to the c-Myc fragment delimited by the outer primers.
Having the correct target DNA, the following step of my work was the study and comprehension of the LAMP reaction.
3.2. Study of the LAMP reaction for DMF
In this section, the LAMP reaction will be thoroughly studied, as to determine the best reaction parameters for further adaptation of the technique to the DMF chip. In particular, LAMP reaction time, limit of detection, volume and temperature will be evaluated, and finally, a real-time analysis of the reaction will be performed.
3.2.1. Reaction time analysis
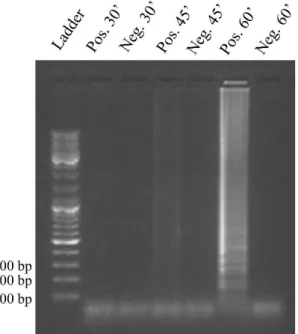
It is of utter importance understanding exactly how much reaction time is required to obtain a reliable, detectable result. As such, 3 reaction times were initially studied (30 min., 45 min. and 60 min.), with a constant initial DNA concentration of 0.5 ng/µL, a constant temperature of 65 °C and a volume of 20 µL. Figure 3.2 depicts the results of the electrophoretic analysis.
12 Figure 3.2: Electrophoretic analysis of the LAMP products obtained for the reaction time analysis (30 min.,
45 min. and 60 min.), in comparison with a DNA ladder.
Briefly, there was successful amplification for 45 min. and 60 min. reaction time, but not for 30 min. reaction time. Comparing the positive controls for 45 min. and 60 min., it is clear that the band for 60 min. reaction time is brighter than the band for 45 min. reaction time, suggesting that DNA amplification was more efficient for 60 minutes, producing a higher amount of DNA. On this first LAMP reaction analysis, it is also noteworthy that LAMP products diffuse along the full extent of the lanes, which indicates the presence of several amplification products with various sizes, called concatemers (see section 1.2). A summary of the LAMP reaction time study may be consulted on table 3.1.
Table 3.1: Summary of the results obtained for the study of the LAMP reaction time. “Y” indicates that there was DNA amplification and “N” indicates that there was no amplification.
Temperature Time Volume Initial DNA concentration Result 65 °C 30 min. 20 µL 0.5 ng/µL N 45 min. Y 60 min. Y
3.2.2. Determination of the reaction limit of detection
Determining the limit of detection (LOD) in a LAMP reaction allows us to identify the minimum target DNA concentration required for the LAMP reaction to occur. If the amount of initial DNA is too small, the probability of LAMP primers colliding with target DNA and triggering the reaction is also small. However, if the initial DNA concentration is too high, the LAMP reaction can be inhibited. In order to determine the LOD for this particular reaction, LAMP was performed for 20 µL, with successive 10-fold dilutions of target DNA, ranging from 0.5 ng/µL to 0.05 pg/µL, constant temperature (65 °C) and variable reaction times (60 min. and 90 min.).
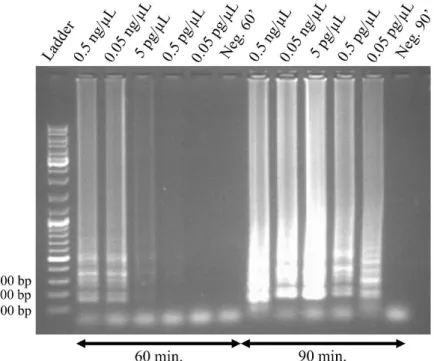
From the electrophoretic analysis (figure 3.3), it is possible to conclude that, for 60 min. reaction time, DNA amplification is possible for all initial DNA concentrations, except for 0.05 pg/µL. Even so, amplification for an initial DNA concentration of 0.5 pg/µL had a low efficiency, judging from the very faint vertical band in figure 3.3. Nevertheless, for 90 min. reaction time, even 0.05 pg/µL of initial DNA concentration yielded successful amplification. This was an expected result, since even if we have a small initial DNA concentration, which results in a lower probability of gathering the
13 required conditions for amplification to occur (primer hybridising to the target sequence, DNA polymerase binding to this sequence and beginning of polymerisation), with longer reaction times, at some point, these conditions will be respected. LAMP reactions with further decrease in initial DNA concentration were not performed, since it would result in unnecessary DNA detection. That is, even if the reaction allows detection of lower DNA concentrations, it would be irrelevant to detect a single
c-Myc strand, for example, since such a low DNA quantity would not be indicative of cancer (the c-c-Myc
gene exists in healthy humans, it is its overexpression that is related to cancer). It is also visible that, for 60 min. reaction time, the vertical bands tend to become dimmer as initial DNA concentration decreases, indicating a lower final DNA concentration. This is also expectable, since higher initial DNA concentration leads to an earlier start of the LAMP reaction. As such, the effective LAMP reaction is actually longer for higher DNA concentrations. However, this does not happen for 90 min. reaction time, as the vertical band for 5 pg/µL is considerably brighter than all others. A possible explanation for this phenomenon is that a LAMP reaction, as any other reaction, has optimal conditions, which result in an output maximisation and therefore, 5 pg/µL as initial DNA concentration may lead to an optimal LAMP output in the test conditions (65 °C and 90 min.).
Figure 3.3: Electrophoretic analysis of the LAMP products for reaction detection capabilities, with 60 min. and 90 min. reaction times, in comparison with a DNA ladder. 10-fold dilutions were performed for initial DNA
concentrations ranging from 0.5 ng/µL to 0.05 pg/µL. Table 3.2 summarises the results obtained for this particular study.
Table 3.2: Summary of the results obtained for the study of the limit of detection in the LAMP reaction. “Y” indicates that there was DNA amplification and “N” indicates that there was no amplification.
Temperature Time Volume Initial DNA concentration
0.5 ng/µL 0.05 ng/µL 5pg/µL 0.5 pg/µL 0.05 pg/µL
65 °C 60 min. 20 µL Y Y Y Y N
90 min. Y Y Y Y Y
3.2.3. Analysis of the reaction volume
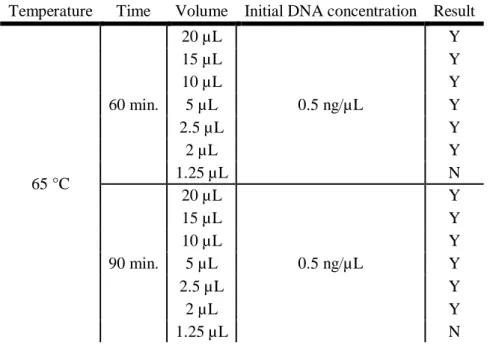
One of the major concerns about performing a LAMP reaction on a DMF platform is the effect that a significant volume reduction would have on the amplification process. To the best of my knowledge, most µLAMP devices resort to 20 µL - 30 µL reaction volumes44, whereas only a few47,49 work with a
14 reaction volume inferior to 5 µL. The DMF platform proposed in this work is designed to work with low reaction volumes (see section 3.3.1), therefore an initial reaction volume study was performed, as to understand if DNA amplification would still be possible with significant volume reduction. Moreover, 5 µL of mineral oil was added to reaction volumes of 5 µL or inferior, in order to prevent evaporation, which becomes a crucial issue for smaller volumes. Preventing evaporation will also be essential for any reaction performed on the DMF platform proposed, therefore silicone oil will be used as a filler medium. As such, for a preliminary study, it will also be relevant to analyse the effectiveness of adding oil to the bench-top LAMP reaction in terms of liquid evaporation.
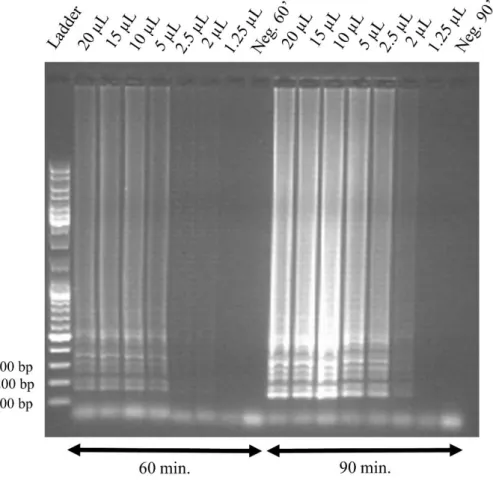
All reactions were performed at 65 °C, for 60 min. and 90 min., with an initial DNA concentration of 0.5 ng/µL and volumes ranging from 20 µL down to 1.25 µL. Figure 3.4 shows the electrophoretic analysis of all the LAMP products obtained.
Figure 3.4: Electrophoretic analysis of LAMP products obtained for the study of reaction volume reduction, with 60 min. or 90 min. reactions, in comparison with a DNA ladder.
For both reaction times, DNA amplification was possible until a minimum volume of 2 µL. For 60 min. reaction time, there is a significant reduction in band brightness from 5 µL to 2.5 µL reaction volume, which indicates a decrease in amplification efficiency. Since all reagents were withdrawn from the same master mix, it is likely that the decrease in amplification efficiency is a direct consequence of volume reduction. Reducing the volume even further (1.25 µL) resulted in no amplification at all. There are several possible justifications for this issue: 1) there could be a possible mix between the liquid fraction and the oil, considering that the reaction volume is extremely low, which interfered with the enzyme activity and 2) using such a low reaction volume could have resulted in a decrease of the reagents’ diffusion effect, which would hinder the LAMP reaction.
For 90 min. reaction time, there is a reduction in band brightness from 2.5 µL to 2 µL. Again, longer reaction time leads to a higher amplification efficiency, which is why higher final concentrations are attained, even with volume reduction. Furthermore, it is important to state that there were no visible
15 signs of evaporation (air bubbles or reduction of the intended volume), which indicates that using oil to cover the aqueous solution is an effective way to reduce volume loss.
Table 3.3 presents a summary of the results obtained for the study of the LAMP reaction volume. Table 3.3: Summary of the results obtained for the analysis of the reaction volume in the LAMP reaction. “Y”
indicates that there was DNA amplification and “N” indicates that there was no amplification. Temperature Time Volume Initial DNA concentration Result
65 °C 60 min. 20 µL 0.5 ng/µL Y 15 µL Y 10 µL Y 5 µL Y 2.5 µL Y 2 µL Y 1.25 µL N 90 min. 20 µL 0.5 ng/µL Y 15 µL Y 10 µL Y 5 µL Y 2.5 µL Y 2 µL Y 1.25 µL N
3.2.4. Reaction temperature analysis
Temperature is a key factor in a LAMP reaction, and typically, DNA amplification using this method occurs within the range of 60 °C to 65 °C. This narrow temperature range is directly related to the enzyme used in LAMP, Bst polymerase, which presents low thermostability. As such, the temperature used for LAMP must fall into the Bst working temperature range, and even small temperature deviations may result in sub-optimal regimens of reaction, and ultimately no amplification43.
Temperature is also relevant from the DMF platform point of view. Preliminary studies performed on other DMF devices at CENIMAT indicate that deionized water droplets start to evaporate at temperatures just above 65 °C, even with the use of oil as a medium filler, producing micro-air bubbles which in turn are prejudicial to droplet movement. Moreover, higher temperatures require more power, and subsequently, more energy consumption. Therefore, an effort to reduce the LAMP reaction temperature as much as possible would be relevant, not only to prevent evaporation, but also to reduce the DMF platform energy requirements.
Since the previous LAMP reactions occurred at the optimal LAMP reaction temperature, 65 °C, the temperature analysis was performed for 60 °C and 55 °C, with two different initial DNA concentrations: 5 pg/µL and 0.5 pg/µL, for a volume of 20 µL and a reaction time of 90 min. The electrophoretic analysis of the LAMP products is shown on figure 3.5. Briefly, amplification occurred for both DNA concentrations at 60 °C, however, no amplification was possible at 55 °C. Since amplification is possible for 60 °C, it would be interesting to test this lower amplification temperature on-chip. However, considering that the purpose of this work is to present a proof-of-concept, the ideal temperature for LAMP on-chip reactions will be set as 65 °C, the optimal LAMP temperature.
16 Figure 3.5: Electrophoretic analysis for the LAMP temperature study, in comparison with a DNA ladder. LAMP
reactions were performed with the following conditions: 60 °C, with 5 pg/µL and 0.5 pg/µL initial DNA concentrations and 55 °C, with 5 pg/µL and 0.5 pg/µL initial DNA concentrations.
A summary containing all the results from the LAMP reaction temperature analysis may be found below, on table 3.4.
Table 3.4: Summary of the results obtained for the analysis of the LAMP reaction temperature. “Y” indicates that there was DNA amplification and “N” indicates that there was no amplification.
Temperature Time Volume Initial DNA concentration 5 pg/µL 0.5 pg/µL 60 °C
90 min. 20 µL Y Y
55 °C N N
3.2.5. Summary of LAMP parameters for on-chip reactions
In brief, it is possible to conclude that all the variables tested (temperature, volume, time and initial DNA concentration) influence the outcome of a LAMP reaction. Below 60 °C, there is no amplification, and initial DNA concentrations under 0.5 pg/µL only result in amplification for 90 min. reaction time. Moreover, reaction times under 45 min. yield no amplification, and it is possible that significant volume reduction yields reaction inhibition, since there is no amplification visible for a reaction volume of 1.25 µL, regardless of the tested reaction times. All the other conditions result in DNA amplification. An on-chip LAMP reaction obviously occurs in a different environment than that of a bench-top reaction, however, it was necessary to pre-establish a starting point for on-chip reactions, which would facilitate the on-chip reaction optimisation. As such, considering the previous LAMP study, primary on-chip LAMP conditions will be set as: 1) 0.5 ng/µL of initial DNA concentration; 2) a reaction volume close to 2 µL; 3) 65 °C as reaction temperature, with the possibility of experimenting slightly lower temperatures and 4) 60 min. reaction time.
3.2.6. Real-time LAMP analysis
Understanding the behaviour of a certain reaction with time is also important to understand the limits and capabilities of the considered reaction (LAMP in this case). Moreover, the real-time LAMP analysis is also of great relevance for future developments of this work: integrating impedance measurements on the DMF device and follow the LAMP reaction on-chip, in real time, by means of the impedance variation resulting from DNA amplification. As such, real-time LAMP was performed