Repositório ISCTE-IUL
Deposited in Repositório ISCTE-IUL:
2018-07-16Deposited version:
Publisher VersionPeer-review status of attached file:
Peer-reviewedCitation for published item:
Lopes-Teixeira, D., Batista, F. & Ribeiro, R. (2018). Spatio-temporal analysis of brand interest using social networks. In 13th Iberian Conference on Information Systems and Technologies (CISTI). Cáceres: IEEE.
Further information on publisher's website:
10.23919/CISTI.2018.8399241Publisher's copyright statement:
This is the peer reviewed version of the following article: Lopes-Teixeira, D., Batista, F. & Ribeiro, R. (2018). Spatio-temporal analysis of brand interest using social networks. In 13th Iberian Conference on Information Systems and Technologies (CISTI). Cáceres: IEEE., which has been published in final form at https://dx.doi.org/10.23919/CISTI.2018.8399241. This article may be used for
non-commercial purposes in accordance with the Publisher's Terms and Conditions for self-archiving.
Use policy
Creative Commons CC BY 4.0
The full-text may be used and/or reproduced, and given to third parties in any format or medium, without prior permission or charge, for personal research or study, educational, or not-for-profit purposes provided that:
• a full bibliographic reference is made to the original source • a link is made to the metadata record in the Repository • the full-text is not changed in any way
The full-text must not be sold in any format or medium without the formal permission of the copyright holders.
Serviços de Informação e Documentação, Instituto Universitário de Lisboa (ISCTE-IUL) Av. das Forças Armadas, Edifício II, 1649-026 Lisboa Portugal
Phone: +(351) 217 903 024 | e-mail: [email protected] https://repositorio.iscte-iul.pt
Spatio-Temporal Analysis of Brand Interest using
Social Networks
Diana Lopes-Teixeira
Instituto Universitário de Lisboa (ISCTE-IUL), Lisboa, Portugal
Fernando Batista, Ricardo Ribeiro
Instituto Universitário de Lisboa (ISCTE-IUL), Portugal L2F, INESC-ID Lisboa, Portugal
{fmmb, rdmr}@iscte-iul.pt
Abstract — Social Networks have become part of many people’s
lives, and applications like Facebook and Twitter are used on a daily basis by millions of users. In such applications, users share their feelings, opinions, and experiences. Twitter in particular, is used to talk about diverse topics, including brands and their products and services. In this paper, we analyze how brand interest is reflected on Twitter and how this platform can be used to monitor mentions of specific brands, as an indicator of brand interest. Our methodology is based on time, location, and the number of brand-related tweets to perform a spatio-temporal analysis. This type of analysis can provide relevant insights into how brand interest evolves over the time and how it might differ from one country to another. We have collected four years’ worth of data and report trends, differences, and similarities in terms of brand interest for each brand and for each country.
Keywords – Spatio-Temporal Analysis; Geographical Analysis; Temporal Analysis; Brand Interest; Social Networks; Twitter.
I. INTRODUCTION
The use of social media websites like Twitter, Facebook, or Tumblr has grown tremendously worldwide. The impact of such growth has expanded in many and unexpected ways. Twitter, in particular, has become one of the most popular microblogging platforms and in its 140 characters posts (now 280), called tweets, people share diverse aspects of their lives and talk about events happening that they are aware of or interested in. Twitter has been used as data source to track several relevant information about real-world events — from disease outbreaks like flu, to natural disasters like the recent earthquake in Japan, and political affairs such as Arab Spring. The real-time information dissemination is the reason why Twitter’s popularity amongst researchers has been constantly growing since its launch, in 2006. Previous research has demonstrated that Twitter data is correlated with real-world events [9] [2] [7], leading to the development of systems and applications aiming at exploiting such potential.
In this paper, we describe a system that uses Twitter as data source to perform a spatio-temporal analysis of brand interest, which is the level of interest one has in a brand and the level of curiosity one has to learn more about a brand [6], along with searching for relevant patterns. For this work, the volume of tweets is used as a measure of brand interest, as more interesting brands are more likely to be mentioned [1]. Our goal is to study variations on brand interest distribution on different countries and its evolution over time. Moreover, we aim to analyze how brand interest trends are reflected on Social Networks, using a large dataset from Twitter, and to evaluate whether the picked
brands present the similar interest/trend behavior. It is also our goal to analyze how brand interest sharing behavior changes from one country to another.
The remainder of this paper is organized as follows: Section 2 describes the related work; Sections 3 and 4 describe the dataset and the system architecture, respectively; Section 5 presents the geographical/spatial analysis and Section 6 presents a temporal analysis; Section 7 draws the major conclusions, presents the limitations of the current work, and proposes a set of tasks to perform as future work.
II. RELATED WORK
Previous studies have already analyzed how Twitter data can be used to track real-world events, both temporally and geographically, and to perform spatio-temporal analysis.
An active spatio-temporal methodology for Dengue surveillance based on volume, location, time, and content was introduced by [2]. The purpose of the study was to assess how
much, where, and when Dengue outbreaks happened, as well as
how the public faced it. The authors evaluated in what extent tweets supported spatio-temporal predictions, by analyzing how users referred to Dengue in their posts, considering time and location. Additionally, they also applied Sentiment Analysis techniques on Dengue-related data from Brazil. Their results demonstrated that Twitter data can be used to predict Dengue outbreaks as well as to study disease awareness and sentiment.
A more fine-grained analysis, using Twitter data to track and characterize people flows in Greater London was conducted by [5]. The authors modelled individual characteristics, as well as conventional measures of land use morphology and night-time residence. Their purpose consisted in characterizing the geography of information generation across the city to create geo-temporal demographical classification of users in London and using tweets to characterize the links between locations across the city. The researchers created a geodemographic classification based on variables such as residence, total number of tweets, number of countries visited, age, ethnicity, London land use category, tweets outside the United Kingdom, and temporal scales. Their study was conducted on three stages: first they evaluated the spatial evenness of Twitter usage at different times of day, with the purpose of get insights about the daily rhythm of activities in the city. The second stage focused on using onomatology and data linkage to infer age, ethnicity, residence, and socioeconomic characteristics of Twitter users, as well as the dominant economic land use at the tweet location. Finally, they measured the connectivity of different areas within
This work was supported by national funds through Fundação para a Ciência e a Tecnologia (FCT) with reference UID/CEC/50021/2013.
Greater London based on observed levels of social media activity amongst users. Their analysis revealed the areas which are highly connected together based on the interactions extracted from the Twitter data.
The problem of modeling geographical topical patterns was addressed by [3], with the purpose of uncovering language patterns and to extract users’ common interests from geo-tagged tweets. Their purpose was to shed light on questions such as how the information is created and shared in different geographic locations, how the content changes from location to location, the spatial and linguistic characteristics of Twitter users and its variations across regions, and whether it is possible to discover patterns in users’ usage of microblogging platforms.
A Text Mining system that works on Twitter’s stream, searching for relevant text patterns indicating traffic events and conditions in specific locations, was presented by [8]. The system inferred locations based on the places mentioned in Twitter posts. The process is performed in four phases: i) preprocessing of tweets content; ii) traffic event identification; iii) detection of locations; and, iv) enhancement of the location information. The researchers achieved promising results on the detection of traffic events and the locations where the events occur. Their method was able to detect neighborhoods and thoroughfares with a precision between 50% and 90%.
In [4], the researchers proposed a real-time disease surveillance system that automatically track flu and cancer activities. The system performs geographical/spatial, temporal, and text mining on Twitter data to uncover influenza and cancer activities as well as disease-related terms, such as disease types, symptoms, and treatments. The results indicated that their disease detection system is able to effectively track flu/cancer activities on a daily basis and changes in the volume of tweets mentioning disease related terms over time.
A framework for discovering health-related topics was presented by [7]. They demonstrated that their approach is effective in discovering coherent clusters of tweets, and some of the clusters were correlated to temporal and geographical surveillance data. The researchers identified, through the presented approach, seasonal temporal patterns and geographical trends. They found, for instance, that exercise and obesity were significantly correlated to survey data in the USA.
III. DATASET
This study uses about 364,636 geo-located tweets, written in Portuguese, posted by 162,244 users from 206 countries across the world (as indicated by Twitter) that were collected between May 2014 and November 2017, corresponding to approximately four years’ time span. Apart from its content, each tweet includes the following metadata information: user id, username, user description, country and city from which the post was uploaded, post date and time, and the tweet unique identifier.
A brand selection filtering process was previously applied, in order to retain only tweets mentioning at least one of the 16 brands selected for this study, namely: Nike, Adidas, Vans, Puma, Victoria's Secret, Gucci, Valentino, Versace Converse All Star, Michael Kors, Burberry, Marc Jacobs, Armani, Tommy Hilfiger, Christian Louboutin, and Dolce & Gabanna. These brands were chosen based on the number of followers on
Twitter, and on the number of tweets mentioning the brand. Results described in this paper are restricted to the top 10 brands for which we have more tweets. In some cases, additional processing steps were applied to remove irrelevant previously selected tweets. For example, concerning the “Valentino” brand, posts mentioning “Bobby Valentino” and “Valentino Rossi”, were removed from the database, as well as all the tweets mentioning “Valentino” posted by users from Argentina. The last step was needed because the word “Valentino” is commonly mentioned in posts from Argentina, but they were most likely not referring to the brand with the same name. Tweets having the words “Valentino” and “Humoro” and were also removed, as in these cases the users were not talking about the homonymous brand. For tweets mentioning “Gucci”, three situations invalidating them were identified: i) “Gucci Mane”, which is an American singer; ii) “Gucci gang”, which is a song; and, iii) “Gucci fica bem com ela” (“Gucci looks good on her”), which is part of a song lyrics. Thus, tweets matching one of these conditions were removed. As Versace and Valentino are ice-cream shops names, tweets containing ice-ice-cream related words were also removed. As long as they did not mention any other brand. Similarly, all the tweets posted by a specific user from Indonesia were removed, as such user represented an outlier regarding the number of posts, and we have found out that the corresponding account was used for advertising purposes. There were also several accounts for advertising purposes among United States users. Tweets posted by these users were discarded as well.
The country field appears written in different languages and required normalization in order to perform the country-based analysis. We have defined a translation table where all the values were translated into English, except in cases such as “Cabo Verde” (Cape Verde), “Côte d’Ivoire” (Ivory Coast), and “Costa Rica”.Although Hong Kong and Macao are currently provinces of China (officially the People's Republic of China), both were treated separately, as they are special administrative regions. Taiwan was also treated separately, even though this country is still considered, in some cases, a province of China. Finally, a total of 86 tweets had the location filled with the hyphen mark. To some of them, the location of another tweet posted by the same user was assigned to the tweet with no location. The ones that no other tweets with location (posted by the same user) were found, were removed, as they were not valid for this analysis.
The resultant sample of users in this dataset represents a small fraction of all Twitter active users that freely share their location, and tweet in Portuguese. Therefore, it cannot be considered as a representative sample of any broader population. Nevertheless, this study is motivated by the potential of large datasets extracted from Social Networks to track brand interest distribution in a spatio-temporal basis.
Table I reveals that most users are located in Brazil and Portugal, as expected. However, a large community of Portuguese speaking people can also be found in many other places worldwide.
Table II shows the selected brands, revealing that Nike and Adidas, two of the most well-known brands, are being mentioned by the majority of the users in our database, as we could expect.
TABLE I. TOP 10CONTRIES WITH MORE USERS
Country Users Tweets Tweets/User
Brazil 136753 311277 2,28 Portugal 10645 28691 2,70 United States 3912 5642 1,44 Argentina 1254 1374 1,10 Spain 1052 1292 1,23 France 973 1309 1,35 United Kingdom 827 1240 1,50 Mexico 740 921 1,24 Italy 654 990 1,51 Indonesia 444 701 1,58
TABLE II. BRAND-RELATED TWEETS
Brand Users Tweets Tweets/User
Nike 68098 126427 1,86 Adidas 65870 120784 1,83 Vans 41071 70091 1,71 Puma 12763 18710 1,47 Victoria’s Secret 9574 12642 1,32 Gucci 5312 7988 1,50 Versace 4989 7312 1,47 Valentino 3924 6083 1,55
Converse All Star 4893 5975 1,22
Michael Kors 1075 1558 1,45
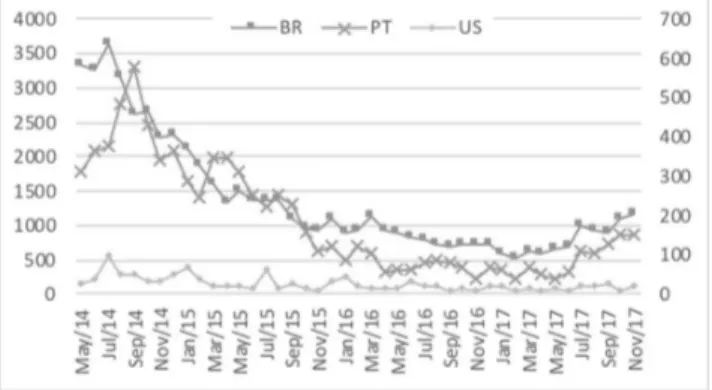
Fig. 1 depicts the number of tweets per year of the top-3 countries concerning Portuguese-written tweets. As can be seen, users from Brazil shared more tweets than users from Portugal and from the United States. Concerning users from Portugal, this might be so because Twitter is way more popular in Brazil than it is in Portugal and, naturally, because of the size of the population. In fact, Twitter occupies the 6th position in the ranking of Social Networks with more visitors1, while Brazil is the country with more users outside United States2.
Figure 1. Tweets posted by users from the three countries per year.
IV. SYSTEM ARCHITECTURE
Figure 2. Fig. 2 shows the architecture of the adopted system. The data was extracted using the Twitter Real-time filter API3, where a filter was firstly applied to restrict the tweets to
geo-located tweets, written in Portuguese (as classified by Twitter). Next, a brand-related tweets selection process takes place. The tweets kept were those that mention at least one of the 16 brands. The brands, in turn, were selected based on the number of followers and the number of posts mentioning the brand. After the brand filtering phase, a preprocessing step was conducted, to prevent invalid tweets from being stored in the database. The data, stored in a MySQL database, can be accessed through a web-based platform, now under development, that enables to perform detailed analysis of the data through space and time.
Figure 2. System Architecture.
V. GEOGRAPHICAL ANALYSIS
The purpose of geographical analysis is to analyze the spatial distribution of brand interest by measuring the volume of brand-related tweets generated in specific locations. For our experiments, we use the tweet location on country level. Fig. 3 shows the distribution of tweets worldwide, revealing that more tweets were posted by users from America and Western Europe. The distribution of users follows a similar pattern.
Figure 3. Tweets distribution map.
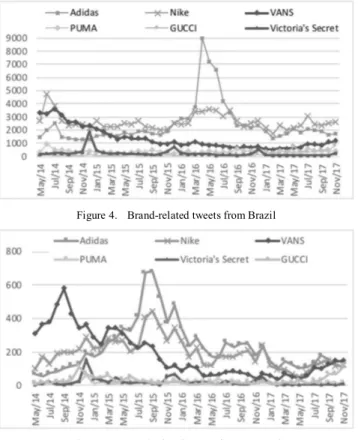
Fig. 4 shows that some brands share the same trend. For instance, Nike and Adidas seem to follow a similar trend, despite the fact that Adidas reached almost 9000 posts on April 2016. Victoria’s Secret differs from the rest of the brands, as its trend clearly presents a seasonal behavior, with peaks every
1
tek.sapo.pt/noticias/internet/artigos/portugueses-continuam-a-gostar-do-facebook-e-a-ligar-pouco-ao-twitter
2 https://www.omnicoreagency.com/twitter-statistics/
December. Vans started with a high number of tweets, but the interest decreased over the time.
In Fig. 5 we can see that, concerning users from Portugal, the interest on Adidas, Nike, Vans, and Victoria’s Secret presents a similar trend comparing to the trend of users from Brazil. Adidas and Nike follow similar trends, and the tweets about Vans decreased over the time. Victoria’s Secret interest trend has also a seasonal behavior. Because the number of posts decreases as the brands list reaches the end, only the first six of the Top 10 brands are displayed, so one can have a clear visualization of brand interest trends.
Figure 4. Brand-related tweets from Brazil
Figure 5. Brand-related tweets from Portugal
Fig. 6 reveals that, for United States users, Adidas interest trend presents the same behavior of Brazil and Portugal trends. Vans presents ups and downs, but its decreasing trend remains.
Figure 6. Brand-related tweets from United States
VI. TEMPORAL ANALYSIS
The goal of temporal analysis is to monitor brand interest over the time, by measuring the volume of brand-related tweets posted from May 2014 to November 2017. Although Fig. 4 to 6 already present some temporal information, in this section we deepen our analysis and include some brand-related real-life events that will be presented as possible reasons for brand interest increase. Our analysis is restricted to the “Top 3” countries according to the number of published tweets, which are Brazil, Portugal, and United States, representing together 93.68% of the total number of users (151,994).
Victoria’s Secret presents a seasonal trend, as the number of tweets mentioning this brand starts to rise in November, achieving its highest point in December, decreasing in January. This trend can be verified in Fig. 7. Although the data from December 2017 is absent in this study, an increase on the number of tweets can be observed in November 2017, which is in line with the behavior verified in the previous years. This trend might be due to the brand’s annual fashion show, which is run in this time of the year since 2001. Last year show was broadcasted to more than 190 countries. This behavior can also be verified on users from Portugal and United States, as shown in the following two tweets:
¾ “O que os outros vêem em dezembro: ferias O que eu vejo:
Natal, férias e Victoria’s Secret Fashion Show!” / What other people see in December: Vacations. What I see: Christmas, vacations and Victoria’s Secret fashion show
¾ “Adorava estar no Victoria’s Secret Show” / I’d love to be
on Victoria’s Secret Show.
Figure 7. Victoria’s Secret tweets evolution (PT and US in secondary axis)
Fig. 8 reports the evolution of Adidas. In January 2016, Adidas launched a new campaign for its line of Adidas Originals4. This might explain the increasing interest registered then, which achieved its highest point on April 2016, regarding the users from Brazil. Also, the brand announced its new product on March 29th, which was then launched on April. The 2016 UEFA European Championship, held in France from June to July, might also be the reason for the increase on tweets from April to June. The number of posts decreased considerably from June to July, which might be related to the EURO 2016 end.
4
The tweet bellow shows a user comparing Adidas and Nike uniforms during EURO 2016 Championship:
¾ “Esses novos uniformes dos clubes europeus estão muito
bonitos Adidas mandando ver e deixando a Nike pra trás”/ These new European team uniforms are very beautiful, Adidas is leaving Nike behind
Figure 8. Adidas tweets evolution (PT and US in secondary axis)
According to Fig. 9 Nike registered a noticeable increase on brand interest in June 2014. This might be due to the brand’s World Cup campaign for 20145. The fact that the World Cup 2014 occurred in Brazil might also have influenced, as Football is very a popular sport in Brazil. In 2015, the number of posts increased from March to June. This is in line with the Spring/Summer collections launch, in March6. It might also be the reason why, for users in Portugal, the posts increased during the same time. The Christmas season, along with the Nike’s Women’s Campaign, launched in January 2016 might have contributed to the increase of posts from December 2015 to February 2016. “Unlimited” campaign for Rio 2016, launched in July, along with its follow-up ad called “Unlimited You”, released in August, might explain the increase on brand interest from on August 2016.
Figure 9. Nike tweets evolution (PT and US in secondary axis)
In July 2017, Nike launched Signature Neymar (a well-known football player) football boots. This launch might be the reason why the interest increased in the same period. December 2016 also had an increase, which might be due to the Christmas season. Tweets below show what users were saying about Nike during Euro 2016:
¾ “Adoro mt o trailer a publicidade da Nike para o mundial”. / I love very much Nike ad trailer for World Cup. ¾ “Uniformes da Nike nessa #EURO2016 são todos iguais.
Alguns são horríveis”. / Nike uniforms for #EURO2016 are all the same. Some of them are awful.
Vans announced the official re-launch of the Vans Women’s Apparel and Accessories Collection, along the spring 2014 campaign video. Vans also partnered with Captain Fin to launch their Fall 2014 Collection and launched a clothing line in August 2014. In May 2015, Vans launched their first-ever Skateboarding Video. As the number of tweets was decreasing month after month, this event might explain why it stop dropping, and even increased in Brazil and Portugal (Fig. 10). The brand 50th anniversary in March 2016 is a possible reason for the increasing in brand interest at the same period.
Figure 10. Vans tweets evolution (PT and US in secondary axis)
Fig. 11 shows the number of Gucci’s posts. The first rise, in June 2016, is likely to be related with the Gucci’s fashion show, at Westminster Abbey (London), on June 2nd. The second peak, on May 2017, is in line with the Gucci’s Pre-Fall 2017 Campaign, which got a lot of attention for featuring exclusively Black Models and for having several 1960s influences. The Gucci designer Alessandro Michele’s first women’s fragrance launch might have helped to maintain the brand interest8. Regarding users in Portugal, an increase on tweets occurred on November 2014, which might be due to the holidays. The increase on the number of posts in 2017, might also be due to the holidays season and with the Gucci’s fragrance launch.
Figure 11. Gucci tweets evolution (PT and US in secondary axis)
5 https://news.nike.com/news/nike-launches-winner-stays-second-film-in-the-risk-everything-football-campaign 6 https://news.nike.com/news/nike-unveils-new-spring-collections-connects-with-65-million-women-across-global-digital-community 7 https://www.vans.com/history#1966 8 https://www.vogue.com/article/gucci-bloom-fragrance-perfume-launch-alessandro-michele
A possible reason to explain the peak on Versace tweets (Fig. 12), in November 2014, might be Donatella Versace’s presence, for the first time, at the Versace for Riachuelo fashion show during São Paulo Fashion Week Winter 2015, on November 6th, in Brazil9. The absence of changes elsewhere might be due to the brand Riachuelo not being popular outside Brazil.
¾ “Hoje eu vi as pecas da Versace pra Riachuelo e meu
Deus, que colecção linda”. “Just saw Versace for Riachuelo clothes and God, what a beautiful collection!”
Figure 12. Versace tweets evolution
In March 2014, Converse launched Spring Chuck Taylor All Star Collection. In 2015, the brand unveiled a new version of the shoes launched b10. Both launches might explain the increase on interest in Brazil and Portugal from 2014 to 2016. The Valentine’s Day Collection launch might explain the increase on posts from Brazil (Fig. 13), in February 2016.
Figure 13. Converse All Star tweets evolution
Fig. 14 shows that the three countries have different brand interest periods. United States, for instance, have more tweets in January, May, July, and December. The increase on tweets in July might be related to the Independence Day. In December and January, might be related to the Christmas. The Mother’s Day and The Memorial Day, both in May, might explain the increase on tweets. Portugal interest rises in August and September, which is the summer/vacations season. December also registered an increase on posts, which might be related to the Christmas. Brazil has more tweets from April (likely due to
Easter) to July, then it rises in December, most likely due to the Christmas.
Figure 14. Average tweets posted monthly (PT and US in secondary axis)
VII. CONCLUSIONS
The present study proposes a system for analyzing brand interest, geographically and temporally, using Twitter as data source. The experiments demonstrated that the system is able to detect variations in brand interest, and these variations are likely to be related to real-world events, which is in line with previous studies. This study regarding Social Networks penetration and interest trends, performed based on four-year Twitter data, showed that some brands differ from each other, while others share a similar pattern/behavior. Also, the sharing behavior is quite different from one country to another.
Future work includes performing Topic Modeling tasks in order to uncover what brand aspects the users talked about, i.e., what caught users’ interest. Also, we aim to discover community patterns, i.e., how communities differ from each other.
REFERENCES
[1] J. Berger and K. L. Milkman, “What Makes Online Content Viral?,” J.
Mark. Res., vol. 49, no. 2, pp. 192–205, 2012.
[2] J. Gomide, A. Veloso, W. Meira, V. Almeida, F. Benevenuto, F. Ferraz, and M. Teixeira, “Dengue surveillance based on a computational model of spatio-temporal locality of Twitter,” Proc. 3rd Int. Web Sci. Conf. -
WebSci ’11, pp. 1–8, 2011.
[3] L. Hong, A. Ahmed, S. Gurumurthy, A. J. Smola, and K. Tsioutsiouliklis, “Discovering geographical topics in the twitter stream,” Proc. 21st Int.
Conf. World Wide Web - WWW ’12, p. 769, 2012.
[4] K. Lee, “Real-Time Disease Surveillance Using Twitter Data : Demonstration on Flu and Cancer,” Kdd’13, no. Ili, pp. 1474–1477, 2013. [5] P. A. Longley and M. Adnan, “Geo-temporal Twitter demographics,” Int.
J. Geogr. Inf. Sci., vol. 30, no. 2, pp. 369–389, 2016.
[6] K. A. Machleit, T. J. Madden, and C. T. Allen, “Measuring and Modeling Brand Interest As an Alternative Ad Effect With Familiar Brands,” Adv.
Consum. Res., vol. 17, pp. 223–230, 1990.
[7] M. J. Paul and M. Dredze, “Discovering health topics in social media using topic models,” PLoS One, vol. 9, no. 8, 2014.
[8] S. S. Ribeiro Jr., C. A. Davis Jr., D. R. R. Oliveira, W. Meira Jr., T. S. Gonçalves, and G. L. Pappa, “Traffic observatory: A system to detect and locate traffic events and conditions using Twitter,” Proc. 5th ACM
SIGSPATIAL Int. Work. Locat. Soc. Networks, LBSN 2012 – Held Conjunction with ACM SIGSPATIAL GIS 2012, pp. 5–11, 2012.
[9] A. Tumasjan, T. Sprenger, P. Sandner, and I. Welpe, “Predicting elections with Twitter: What 140 characters reveal about political sentiment,” Proc.
Fourth Int. AAAI Conf. Weblogs Soc. Media, pp. 178–185, 2010.
9
https://exame.abril.com.br/estilo-de-vida/donatella-versace-apresenta-sua-colecao-para-a-riachuelo/