João Miguel Barge Cunha
Study of the fungal endophytic community
in L. populations
Universidade do Minho
Escola de Ciências
Outubro de 2016
João Miguel Bar
ge Cunha Minho | 20 1 6 U
Quercus suber
Study of t he fungal endophytic community in L. populations
Universidade do Minho
Escola de CiênciasJoão Miguel Barge Cunha
Study of the fungal endophytic
community in Quercus suber L.
populations
Tese de Mestrado
Mestrado em Biologia Molecular, Biotecnologia e Bioempreendedorismo em Plantas
Trabalho efectuado sob a orientação do
Professora Doutora Maria Teresa Correia Guedes Lino Neto
Professora Doutora Paula Cristina dos Santos Baptista
iii
Acknowledgments
Gostaria de agradecer à Professora Teresa Lino Neto por ter aceite ser minha orientadora e por me dar a oportunidade de trabalhar no seu grupo. Pela sua compreensão e conforto nos momentos mais difíceis desta jornada, obrigado.
À Professora Paula Baptista pela sua disponibilidade e ajuda sempre que precisei. Ao Professor Rui Tavares pelo seu apoio no decorrer deste trabalho.
À Francisca por todo o apoio que me deu dentro e fora do laboratório. E claro, na recolha do material e ajuda de campo.
E claro aos meus pais, irmão e avó que sempre me apoiaram em todos os contratempos que surgiram ao longo desta caminhada.
iv
Abstract
Cork oak (Quercus suber) is a species of high importance in the Mediterranean. Besides its ecological importance, the cork oak also has a high relevance for the Portuguese economy. This importance is due to the production and processing of cork. However, the sustainability of the cork oak is being threatened due to climate change, which will reduce the availability of water in the Mediterranean, and the occurrence of diseases that increasingly affect their normal development. The charcoal disease, caused by the fungus Biscogniauxia mediterranea, leads to decline, and eventually, death of the tree.
Diplodia corticola is another pathogen of the cork oak and is involved in various
diseases considered responsible for the decline of the cork oak in the Mediterranean Basin. Currently, the use of fungicides is the main technique used to combat these problems. However the environmental hazard and toxicity of this process leads to the necessity of finding a more effective method. Biological control is an appropriate strategy as an alternative to this problem. Endophytes have the potential to be used as biological agents to control diseases. In addition to being described as potentiators of plant responses to stressful situations, endophytes have the potential for use as biological control agents. To identify endophytic fungi in cork oak, four sites of continental Portugal (Bragança, Gerês, Alcobaça and Grândola), which had differences in water availability, were selected to carry out the collection of biological material. Subsequently, the community of fungal endophytes of three organs (leaves, stems, roots) was evaluated. The trees analysed were largely colonized by fungi of the phylum Ascomycota. In general, Grândola had the highest colonization frequency and diversity of endophytes, while Alcobaça had the lowest. Of all study sites, the cork oaks from Gerês showed a more distinct community, differentiating from all other locations. The roots have a more diverse fungal community than the leaves and stems. It was found that the pathogenic fungi tested (B. mediterranea and D. corticola), essentially affect the aboveground organs of the tree, however no disease symptoms were detected. Furthermore, Gerês was the only study site that did not show any signs of infection by these pathogenic fungi. D. corticola only infected the southern regions (Alcobaça and Grândola), where as B. mediterranea also infected the trees in Bragança. Taking this into account, many fungi were selected for antagonism assays of biological control. Three species (belonging to two genera) may potentially act as biocontrol agents against diseases in Q. suber.
v
Key-words: Quercus suber; Biscogniauxia mediterranea; Diplodia corticola; ecology;
vi
Resumo
O sobreiro (Quercus suber) é uma espécie de elevada importância na região do Mediterrâneo. Para além da sua importância ecológica, o sobreiro também apresenta uma elevada relevância para a economia Portuguesa. Esta relevância provém da indústria de produção e transformação da cortiça. No entanto, a sustentabilidade do sobreiro poderá estar ameaçada devido às previstas alterações climáticas, que diminuirão a disponibilidade de água na região do Mediterrâneo, e à ocorrência de doenças que afetam cada vez mais o seu normal desenvolvimento. A doença do carvão do entrecasco, causada pelo fungo Biscogniauxia mediterranea, origina um acentuado declínio na árvore, podendo levar à sua morte. Diplodia corticola é um outro fungo patogénico do sobreiro, que está envolvido em várias doenças consideradas responsáveis pelo declínio do sobreiro na Bacia do Mediterrâneo. Atualmente, a utilização de fungicidas é a técnica mais usada para o combate destes problemas. Contudo, o risco ambiental e a toxicidade deste processo levam à necessidade da utilização de outros métodos eficazes. A luta biológica é uma estratégia adequada como alternativa a este problema. Além de se encontrarem descritos como potenciadores das respostas das plantas a situações de stresse, os organismos endófitos têm potencial para serem utilizados como agentes na luta biológica. Para identificar fungos endófitos em sobreiro, quatro locais de Portugal continental (Bragança, Gerês, Alcobaça e Grândola), que apresentavam diferenças na disponibilidade de água, foram selecionados para realizar a recolha de material biológico. A comunidade de fungos endófiticos foi avaliada em três órgãos (folhas, caules, raiz). Os sobreiros testados encontram-se maioritariamente colonizados por fungos do filo Ascomycota. Os sobreiros de Grândola apresentaram uma maior frequência de colonização e diversidade de endófitos, enquanto que os de Alcobaça apresentaram a menor. De todos os locais, os sobreiros do Gerês foram os que apresentaram uma comunidade mais distinta, diferenciando-se de todos os outros locais. As raízes apresentaram uma comunidade de fungos mais diversa do que as folhas e caules. Verificou-se ainda que os fungos patogénicos testados (B.
mediterranea e D. corticola), infetaram essencialmente a parte aérea da árvore, apesar
de não terem sido verificados sintomas nas mesmas. O Gerês foi o único local de estudo que não apresentou nenhum sinal de infeção por parte destes fungos. O fungo D.
corticola infetou exclusivamente as regiões mais a sul (Alcobaça e Grândola), enquanto
vii consideração, diversos fungos foram selecionados para estudos de antagonismo e luta biológica, tendo sido encontradas três espécies (pertencentes a dois géneros) que poderão potencialmente atuar como agentes de biocontrolo contra as doenças de
Q. suber.
Palavras-chave: Quercus suber; Biscogniauxia mediterranea; Diplodia corticola;
viii
Table of contents
List of Abbreviations ... ix
1. Introduction ... 1
1.1. Environmental relevance of endophytic microorganisms... 3
1.2. Diversity and classification of endophytic fungi ... 4
1.3. Transmission and colonization strategies of endophytic fungi ... 6
1.4. Ecologic roles of endophytic fungi ... 8
1.5. Studying endophytic communities in oak species ... 11
1.6. Aims of the present work ... 12
2. Material and methods ... 13
2.1. Selection of sampling sites ... 13
2.2. Cork oak organs collection ... 16
2.3. Sterilization and isolation of endophytic fungi ... 16
2.4. Identification of fungal isolates and DNA extraction ... 17
2.5. Endophytic occurrence, diversity and statistical analysis ... 19
2.6. Antagonistic activity assays ... 21
3. Results and discussion ... 24
3.1. Structural analysis of fungal frequency and diversity ... 24
3.2. Fungal morphotype diversity analysis ... 32
3.3. Endophyte species identification ... 38
3.4. Antagonism assays ... 44
3.4.1. Interactions with Biscogniauxia mediterranea ... 46
3.4.2. Interaction between Diplodia corticola... 53
4. Conclusions ... 62
5. References... 64
ix
List of Abbreviations
µL Microliter
bp Base pair
DNA Deoxyribonucleic acid
rDNA ribosomal deoxyribonucleic acid
dNTPs Deoxynuoside triphosphates
h Hour
s Seconds
min Minute
ITS Internal transcribed spacer
MgCl2 Magnesium chloride
NaCl Sodium chloride
ºC Degree Celsius
OTU Operational taxonomic unit
PCR Polymerase chain reaction
Spp. Species (plural)
ha Hectare
mm Millimetre
IAA Auxin indole-3-acetic acid
ISR Induced systemic resistance
CF Colonization frequency
1
1. Introduction
Cork oak (Quercus suber L.) is a sclerophyllous evergreen tree species from the Fagaceae family, which includes other important genera, such as Fagus or Castanea. The Quercus genus is one of the most important woody genera in temperate ecosystems of North America, Europe and Mediterranean Basin, where more than 300 species are currently present (Toumi and Lumaret, 2001).
The healthy development of cork oak trees requires an annual mean temperature of 13 to 18°C. Cork oak growing areas are characterized by warm to hot dry summers and cool wet winters with unpredictable amount of rainfall (Cowling et al., 2005). As a result, the most extensive forest areas of Q. suber are found on the Atlantic coast of the
Iberian Peninsula (Figure 1; Gil and Varela, 2008). The highest levels of genetic
diversity have been found in Spain (Center and South), also suggesting that the Iberian Peninsula is a genetic refuge for this species (Gil and Varela, 2008). All continental Portugal has climatic conditions that allow the adaptability of the cork oak and Alentejo region has the largest sites of distribution (Natividade, 1990). The current cork oak distribution mainly results from various circumstances, like fires, excessive grazing, forestation of fast growing species, such as eucalyptus, the development of urban areas and the intensive exploration of cork (Bellarosa, 2003).
Figure 1. Global distribution of Q. suber. Cork oak is mainly found in the coastal regions of the western Mediterranean Basin, as well as in several islands of the Mediterranean sea and the north of Africa (Gil and Varela, 2008).
2
Q. suber is a strictly Mediterranean evergreen oak species with a genome
comprising 24 chromosomes. The cork oak is a medium-size tree, ranging from 10 to 20 meters height (Figure 2A), able to survive to an age of 250 years (Torres, 1979).
Q. suber has several drought avoidance adaptations, such as deep-reaching root systems
(Kurz-Besson et al., 2006), relatively long leaf longevity (Oliveira et al., 1996) and a thick bark, the cork, which controls water loss from the trunk and branches (Oliveira and Costa, 2012). Cork is a highly valuable product, resulting from the activity of a secondary meristem called cork cambium (Pintus, 1996). Every seven to nine years, cork is removed from the branches and trunk throughout the tree’s lifetime (Figure 2B) (Oliveira et al., 2002).
Cork oak has a high social and economic importance in Portugal (Costa and Oliveira, 2015). Cork products (wine bottling, fashion products, construction, etc.) represent approximately 2.3% of the total annual export of the country (Pereira et al., 2008). Portugal leads the global cork production sector with an average share of over
65%.In addition to being the largest producer, Portugal is also the main importer of raw
cork, as well as the main country to transform cork(APCOR, 2016).
Figure 2. Adult cork oak trees (Q. suber). A. Healthy cork oak tree with an approximate height of 15 meters. B. Cork oak tree after the cork harvest, showing a red trunk, typical from a recently cork stripped tree.
3 In Portugal, cork oak trees can grow in an agroforestry system known as
montado. This system, similar to dehesas in Spain, presents a low tree density (usually
between 30-60 trees/ha) thus comprising open forest areas (Carreiras et al., 2006; Correia et al., 2011). Alongside cork oak trees, plants from Fabaceae and Poaceae families are commonly observed, forming agro-silvopastoral systems (Gil and Varela, 2008). Sobreiral is another cork oak forestry system, characterized by a higher tree density (more than 150-200 trees/ha) and does not allow intercropping with agriculture crops (Correia and Oliveira, 1999; Carreiras et al., 2006; Correia et al., 2011). The main cork oak forestry system found in Portugal, mainly in the southern region, is the
montado, which is primarily used for cork production (Josep et al., 2014). Currently,
much of the center and southern coast of Portugal is dominated by semi-natural or discontinuous cork oak stands, cultivated in the montado system. Moreover, in areas where cork oaks are abundant, usually there is low anthropogenic pressure (Varela and Eriksson, 1995). Most, if not all, plants in natural ecosystems are able to form interactions with fungal endophytes and mycorrhizal fungi (Petrini, 1986). These fungi have an enormous influence on plant fitness, ecology and evolution (Rodriguez et al., 2009).
1.1. Environmental relevance of endophytic microorganisms
Endophytes can be described as any microbe that can be isolated from the inside of asymptomatic plant tissue. These microorganisms, bacteria and fungi, associate with their plant host, establishing a microbial community in the plant endosphere, providing benefits like growth promotion and stress tolerance (Hardoim et al., 2015). Fossilized tissue of different plant organs revealed that plant-endophyte interactions may have evolved from the period where higher plants colonized the planet (Redecker et al., 2000), thus playing an important role in the evolution of life on land. The fungal group
Glomeromycota has for a long time been the prime candidate for interaction with the
first terrestrial plants, in the Ordovician era (Bidartondo et al., 2011). Recently, members of the Mucoromycotina were also speculated to have had symbiotic interactions with the first terrestrial plants (Hardoim et al., 2015). Endophytes live asymptomatically inside the plant host (Freeman et al., 2001). This interaction is based on a balance between the demands of the endophyte and plant response. If the interaction is disturbed, disease symptoms could appear and the endophyte could be excluded by induced host defense reactions (Kogel et al., 2006).
4 Recent studies have been providing techniques that significantly improved the isolation of fungal endophytes, turning their study easier (e.g. Greenfield et al., 2015). Thanks to these advances, gaps in the knowledge of this important interaction (plant-fungal endophyte) can finally be studied.
1.2. Diversity and classification of endophytic fungi
Fungal endophytes belong to the Glomeromycota (40%), Ascomycota (31%),
Basidiomycota (20%), Zigomycota (0.1%) and other unknown phyla (8%) (Hardoim et
al., 2015). The Glomeromycota phylum merely comprises arbuscular mycorrhizal
endophytes, 39% of which belong to the class Glomeromycetes (Schubler et al., 2001; Hardoim et al., 2015). Every member of this class forms ubiquitous endosymbioses with most land plants and have an enormous economic and ecological meaning (Jeffries
et al., 2003).
A large number of Ascomycota endophytes belongs to the class
Dothideomycetes (15%) (Hardoim et al., 2015). This class contains necrotrophic
plant-pathogenic fungi capable of producing host-specific toxins (phytotoxic metabolites and peptides) that are required for pathogenicity and are only active against particular plant species in certain conditions (Horbach et al., 2011). Secreted toxins contribute to virulence or pathogenicity by disrupting host cells, facilitating the colonization process (Stergiopoulos et al., 2013). Epicoccum and Alternaria are two important genera of this class. Some Alternaria species can be considered pathogens, but can be detected in high abundance in healthy plants (Jumpponen and Jones, 2009). Another important class of this phylum is Sordariomycetes (9%), comprising the well-known Fusarium,
Verticillium, Rosellinia and Balansia genera (Hardoim et al., 2015). Also, in this class,
the Clavicipitaceae includes many symbiotic species associated with grasses, sedges and rushes (Rodriguez et al., 2009).
Among Basidiomycota, the Agaricomycetes class comprises the largest number of endophytes, mostly mushroom-forming fungi that cause wood decay (Hardoim et al., 2015). Endophytes from the order Sebacinales (Agaricomycetes that usually do not produce mushrooms) tend to form mycorrhizal symbioses with a wide range of plants, such as members of Ericaceae and Orchidaceae families (Weiß et al., 2011). Other Basidiomycota classes that contain endophytes are Microbotryomycetes,
5 taxa comprising strains with and without pathogenic effects indicates that the endophytic functions cannot necessarily be associated with taxonomy (Hardoim et al., 2015).
Besides their phylogeny, the life history traits of endophytes have been used to distinguish two major groups of endophytic fungi: the clavicipitaceous endophytes (C-endophytes) and the nonclavicipitaceous endophytes (NC-(C-endophytes), which are subdivided into three classes. These classes have different taxonomy, evolutionary
relatedness, ecological functions and plant hosts (Table 1;Rodriguez et al., 2009).
Table 1: Criteria used to characterize fungal endophytic classes. (Rodriguez et al., 2009).
Clavicipitaceous Nonclavicipitaceous
Criteria Class 1 Class 2 Class 3 Class 4 Host range Narrow Broad Broad Broad Tissue(s) colonized Shoot and rhizome Shoot, root and
rhizome Shoot Root
In planta colonization Extensive Extensive Limited Extensive
In planta biodiversity Low Low High Unknown
Transmission Vertical and horizontal
Vertical and
horizontal Horizontal Horizontal Fitness benefits* NHA NHA and HA NHA NHA
*The benefits of habitat-adapted (HA) result from habitat-specific selective pressures such as salinity, temperature and pH. Nonhabitat-adapted (NHA) benefits are common among endophytes, despite their habitat of origin, and range from drought tolerance to growth enhancement.
C-endophytes (class 1 endophytes) are represented by a small percentage of phylogenetically related Clavicipitaceae (Ascomycota) species that are restricted to some cool/warm season grasses, such as sledge and rush hosts. These endophytes mainly colonize the plant shoots, but their presence in the rhizome has also been detected (Bischoff and White, 2005). Three types of class 1 endophytes have been reported. Type I comprises symptomatic and pathogenic species, whereas Type II and Type III represent asymptomatic endophytes (Clay and Schardl, 2002). These fungi are usually recognized by providing benefits to the plant host, such as increasing drought tolerance, plant biomass, and through the production of toxic metabolites able to decrease herbivory (Clay, 1988).
6 Ecological interactions, life history and other traits allow NC-endophytes to be subdivided into three different classes (Table 1). Despite the lack of functional studies, NC-endophytes have been shown to confer fitness benefits, such as increased growth and yields, biotic and abiotic tolerance and nutrient acquisition improvement (Rodriguez et al., 2009). Differences between endophyte classes reside on their transmission patterns and colonization strategies (Rodriguez et al., 2008).
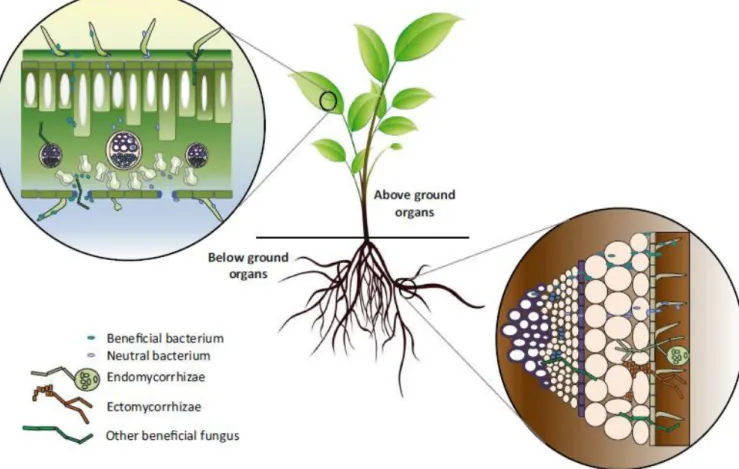
1.3. Transmission and colonization strategies of endophytic fungi
Endophytes can be transmitted either vertically or horizontally. When transmitted vertically, the endophyte never leaves its host, being transferred from parent to offspring via seeds. Fungal reproduction through asexual or sexual spores leads to horizontal transmission, where endophytes may spread between plants in a population or community (Tadych et al., 2014). In this case, endophytes can enter the plant endosphere compartment through the caulosphere (bark), rhizosphere (root), laimosphere (belowground tissues), anthosphere (flower), spermosphere (germinating seed), phyllosphere (leaf), or carposphere (fruits) environments (Compant et al., 2016). Many variables influence the colonization capability of endophytic fungi (Figure 3), such as plant tissue and type, biotic and abiotic environmental conditions, strain type and plant genotype (Hardoim et al., 2015). C-endophytes and NC-endophytes have different colonization strategies. The transmission of C-endophytes (class 1) is essentially vertical, passing on to the offspring by seed infection (Saikkonen et al., 2002). These endophytes colonize intercellular spaces of newly forming shoots and proliferate in the shoot meristem, systemically colonizing the plant host (Saikkonen et
al., 2002; Hardoim et al., 2015). Despite the fact that the transmission of C-endophytes
is essentially vertical, some species of Neotyphodium and Epichloe may also be transmitted horizontally via leafs falling on the soil (Tadych et al., 2007; Hardoim et al., 2015). A study performed on Lolium perenne showed that Neotyphodium can colonize ovules and appear during infructescense development (Philipson and Christey, 1986).
Among NC-endophytes, those belonging to class 2 have a broad range of hosts and are able to colonize above and below ground plant tissues. In addition, they can be transmitted either vertically or horizontally, as those members from class 1. In contrast, class 3 endophytes are only horizontally transmitted, being restricted to above ground tissues where they form highly localized infections (Rodriguez et al., 2008). This class
7 comprise the majority of the well-studied endophytes from several tree species, which mainly belong to the subkingdom Dikaryomycota (Basidiomycota or Ascomycota) (Davis and Shaw, 2008; Hardoim et al., 2015). Although being also transmitted horizontally, class 4 endophytes are restricted to below ground tissues, where they reside inter- and/or intracellularly in the cortical cell layers (O´Dell et al., 1993; Hardoim et al., 2015). These fungi include dark septate endophytes, similar to mycorrhizal fungi. Both classes 2 and 4 are capable of extensive tissue colonization forming systemic infections (Rodriguez et al., 2009).
Figure 3. Niches where endophytes can reside inside plants and ways of colonization by endophytes (adapted from Compant et al., 2016).
Microorganisms that need plant tissues to complete their life cycle are described as obligate. Many mycorrhizal fungi and members of the fungal genera Epichloë,
Neotyphodium and Balansia (class 1 endophytes) are well-known examples of obligate
microorganisms. Opportunistic endophytes could be found on the surface of plant tissues (epiphytes) and only sporadically enter the plant endosphere. Among these are fungi of the genera Hypocrea and Trichoderma (Hardoim et al., 2015).
8
1.4. Ecologic roles of endophytic fungi
The complex interaction between endophyte and host can be described as mutualism, commensalism, saprophytism, parasitism or exploitation, and can change towards a more specialized or different interaction (Zuccaro et al., 2011). Commensal endophytes live on the metabolites produced by the host and have no apparent effect on plant performance. On the other hand, many endophytes can confer positive effects on their hosts performance, such as plant growth promotion, stress tolerance, secondary metabolite production and defense against pathogens and herbivores, either via antibiosis or via induced systemic resistance (ISR) (Scortichini and Loreti, 2007; Hardoim et al., 2015).
Endophytes are able to promote plant growth through the production of phytohormones, resulting in architectural and morphological changes in plant hosts (Khan et al., 2012, 2015). Cytokinins are frequently observed in endophytes and play an important role in the promotion of plant growth. A fungal strain of the root-colonizing endophyte Piriformospora indica, presenting deletions in the cytokinin biosynthesis genes, prevented the plant growth promoting effect (Vadassery et al., 2008). Root endophytes are also known for the production of auxins and gibberellins (Khan et al., 2012). The auxin indole-3-acetic acid (IAA) is known to improve plant growth and increase colonization efficiency, interfering with the host defense system (Navarro et
al., 2006). Besides the production of plant growth hormones, there are additional
compounds produced by fungi that are able to promote plant growth. Adenine and adenine ribosides have been identified as growth promoting compounds in Scots pine endophytes (Vadassery et al., 2008).
Making nutrients available to plants is another mechanism behind plant growth promotion. Some fungal endophytes produce siderophores, which are important for iron acquisition by soil microorganisms (Powell et al., 1980) and are also reported to play a role in the induction of ISR (van Loon et al., 2008). Moreover, the interruption of the siderophore biosynthesis gene cluster in Epichloë festucae compromised the symbiotic association between E. festucae and ryegrass (Lolium perenne) (Johnson et al., 2013).
Endophyte infected plants can also present higher plant growth due to enhanced
nitrogen (N2) fixation, which is significantly higher when endophytes are present in the
9
plants against N2 starvation (Ravel et al., 1997). However, this process revealed to be
more effective in the presence of bacterial endophytes than of fungal endophytes. Root nodules of leguminous plants are a well-known case study of this effect (Pirttilä et al., 2004). Other benefits, such as protection against pests and herbivores, disease suppression (through the production of secondary metabolites) and stress tolerance, can indirectly arise as a result of plant growth promotion (Compant et al., 2016).
Another well-known effect of endophytes is the plant host protection against different stresses. A recent study showed that tomato plants, colonized with systemic fungal endophytes (class 2) isolated on salinized soil, when exposed to NaCl or drought conditions, present higher root and shoot biomass, better water-use efficiency and higher photosynthetic activity than non-colonized plants (Azad and Kaminskyj, 2016). The root fungal endophyte Piriformospora indica was also shown to induce salt tolerance in barley (Baltruschat et al., 2008) and drought tolerance in Chinese cabbage plants (Sun et al., 2010). In all these cases, increases in antioxidant levels were the proposed mechanisms behind plant hosts tolerance to salt/drought stresses. In addition, endophytic association of Paecilomyces formosus LWL1 with Oryza sativa cv. Dongjin (Japonica rice) significantly improved plant growth attributes (such as dry and fresh plant weight or chlorophyll content) under prolonged heat stress conditions (Waqas et
al., 2015). Such fungal endophytes were then suggested to be helpful for sustainable
crop production under high environmental temperatures. Furthermore, fungal endophytes have been shown to interfere with cold tolerance of rice plants (Redman et
al., 2011).
The biological control of parasites and predators of grasses, through the use of selected endophyte strains, has been considered increasingly important because chemical control of diseases and pests is becoming more restricted. Endophyte colonized plants are better protected against insects (Arthropoda), pathogenic fungi, bacteria and nematodes, and are less attractive to grazing animals due to the toxic compounds (secondary metabolites) released to the surrounding environment (Latch, 1993). Effective biocontrol strains of Trichoderma virens can induce the production of defense-related compounds against a number of different fungi on various hosts (Hanson and Howell, 2004). The endophyte, Penicillium canescens, was able to produce growth inhibitors against bacteria and yeasts (Peláez et al., 1998). Many secondary metabolites produced by endophytes are indeed an important source of
10 antioxidant, immunosuppressive, antifungal, antibacterial, anti-oomycete, insecticidal, nematicidal, and antiviral agents (Hardoim et al., 2015). On the other hand, the plant phytohormone ethylene is a key regulator of pant tissue colonization by some beneficial bacterial endophytes, also promoting root elongation and protection against potential pathogens (Iniguez et al., 2005).
Taking into account the conditions under which the host grows, endophytes can change their effects. For example, the fungus Fusarium verticillioides has a dual role in maize, both as a beneficial endophyte and as a pathogen (Bacon et al., 2008). Host genotype and abiotic stress factors may change the delicate balance in endophyte-host interaction, leading to disease symptoms and fungal production of mycotoxins (Bacon
et al., 2008; Hardoim et al., 2015). Host-fungus interaction studies have improved the
understanding of what determines whether a fungus behaves as a parasite or as an endophyte. Colonization in different hosts can cause a fungus to switch lifestyles. For example, Colletotrichum magna grows asymptomatically on various species, but is a fungal pathogen in cucurbit plants, causing anthracnose (Freeman et al., 2001). In addition, mutated C. magna strains can colonize a broader range of hosts and are able to colonize cucurbit asymptomatically (Redman et al., 1999). This interaction switch and expansion of host range were thus suggested to be due to mutations in the endophyte genome. Nevertheless, loss of fungal pathogenicity does not necessarily result in asymptomatic endophyte development. Endophyte mutations could also lead to higher plant defense efficiency that would restrict fungal growth (Jansen et al., 2005). There are now studies showing that most switches from mutualism to parasitism are due to mutations in a single gene. Molecular analysis of endophyte mutants have revealed a single-copy plasmid insertion into the NoxA gene, which encodes an NADPH oxidase. Plants inoculated with these noxA mutant became, severely stunted, lost their apical dominance, showed precocious senescence, and eventually died. In planta ROS production by E. festucae NoxA negatively regulates hyphal tip growth and fungal development, thereby preventing excessive colonization of the plant tissue (Tanaka et
11
1.5. Studying endophytic communities in oak species
The endophytic mycota of broad-leaved trees of temperate regions has only recently started being studied (Gonthier et al., 2006). However, there are already relevant studies on the different relationships between endophytes and their host trees (Kwaśna et al., 2016; Busby et al., 2015). In Northern Spain, there is an intensive monitoring of fungal populations in pine plantations, which shows that over time there are changes in the endophytic community (Martinez-Alvarez et al., 2012). Studies describing the endophytic mycota of several Quercus spp. in healthy and declining trees have also been documented. Declining trees of Q. robur and Quercus cerris showed a lower population of fungal endophytes than healthy trees (Gennaro et al., 2003). In contrast, in
Quercus robur roots subjected to flooding, the number of fungal root endophyte species
was higher than standard roots (Kwaśna et al., 2016). In this later work, the majority of
these species belong to class 2 endophytes. Due to the role that endophytes play on drought stress tolerance and their role on the biocontrol of one of the major causal agents of cork oak decline (Phytophthora spp.), the knowledge of endophyte communities that reside within cork oak trees could be a fundamental tool for the future of oak stands sustainability (Arnold et al., 2003; Bae et al., 2011; Linaldeddu et al., 2013; Scanu et al., 2013). Furthermore, because cork oak has an important economic relevance, more studies about its endophytic community and their relation with plant health and resistance to stress, are being described (Linaldeddu et al., 2011).
Now more than ever, it is important to understand all relations between endophyte-host and endophyte-endophyte. To achieve this later goal, fungal antagonism assays are an essential tool to provide information about the biocontrol potential of certain endophytes. The endophyte antagonistic interactions can be mediated after fungal contact or at a distance (Woodward and Boddy, 2008). Several morphological, physiological, and biochemical changes happen during interactions, which are mainly influenced by the fungal species present and other conditions. These alterations could include hyphal aggregation, rapid cell division, hyphal branching, aerial growth, autolysis, pigment production, release of volatile organic compounds (which also act as info-chemicals), production of diffusible enzymes, toxins, and antifungal metabolites (Woodward and Boddy, 2008; Hiscox et al., 2015).
12
1.6. Aims of the present work
The main goal of this study was to analyze, in quantitative and diversity terms, the fungal endophytic community of various cork oak populations with different water availability (correlation with the precipitation levels). Several cultures for the growth of endophytic fungi, from four different study sites, were establish, including one from a
montado in Alentejo (Grândola) which comprises cork oaks with different degrees of
decline. Other important step was, through the use of antagonism assays, to understand the relations between fungal endophytes and pathogens (association with decline).
13
2. Material and methods
2.1. Selection of sampling sites
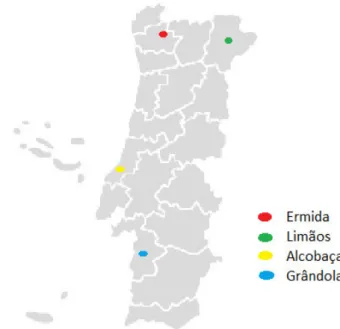
The study was conducted between October 2015 and April 2016 in four different regions of continental Portugal, ranging from north to south of the country (Figure 4; Table 2). The selected areas include both sobreirais and montados, two types of Q. suber forest ecosystems. Each site had different geographical and ecological
characteristics, thus allowing a better
differentiation of the sampling sites.
Table 2: Geographic and climatic conditions of the sampling sites.
Bragança (Limãos) Gerês (Ermida) Alcobaça (Casal do Rio) Alentejo (Grândola)
GPS location 41°31´51.5412”N 6°49´56.5642”W 41°42´39.7630”N 8°6´14.8649”W 39°27´41.1281”N 9°2´42.5169”W 38°11´32.3699”N 8°37´11.4058”W Elevation (m) 600 627 78 150 Precipitation (average past 30 years) mm 64.4 120.7 54.3 61.3 Temperature (average past 30 years) ºC 15 12.7 17.0 16.6 Vegetation cover Cistus sp.; Cytisus sp. Genista tridentata; Cistus sp.; Ulex sp. Pistacia lenticus ; Ulex sp.; Rubus fruticosus; Rosa canina. Cistus ladanifer; Cistus salvifolius.
Figure 4. Geographic location of the sampling sites
on continental Portugal. The exact locations and climatic conditions are listed in Table 2.
14
Bragança (Limãos) (Bra)
This sobreiral, located at 600 m altitude, is mainly composed by Q. suber in the dominant and co-dominant crown classes. Alongside the cork oak trees, plants from the genera Cytisus and Cistus are commonly observed, and nearby meadow areas are primarily used for farming and grazing (Figure 5A). This site was previously used for studying the soil microbiome and the ectomycorrhizal community, which have used the same cork oak trees (Francisca Reis, ongoing PhD project). Limãos site has a temperate climate with cold long winters and short hot summers.
Gerês (Ermida) (Ger)
The main feature about this sobreiral is the low anthropogenic influence, being a remote place in the Peneda-Gerês National Park (PNPG) in northwestern Portugal (Figure 5B). Cohabitating with the Q. suber community, there were other members of the Fagaceae family, like Quercus robur. Pine trees also took part in the composition of the landscape. This sobreiral was the highest sampled site (627 m), displaying also the highest mean annual precipitation (120.7 mm, as the average precipitation for the past 30 years) and the lowest mean annual temperature (12.7ºC, as the average temperature for the past 30 years).
Alcobaça (Casal do Rio) (Alc)
This sampled sobreiral (Figure 5C) is located at just 78 m, displays an average temperature for the past 30 years of 17ºC and a mean annual precipitation of 54.3 mm. Although these meteorological data pointed to the driest sampled site, the nearby Atlantic coast and the proximity of water courses turned this site one of the wettest sampling site. Accordingly, this site has the most diverse vegetation cover, causing the
Q. suber to cohabitate with a high range of plant species, like Pinus pinaster. Alentejo (Grândola) (Gra)
Grândola is the most southern sampling site, comprising a montado (Figure 5D). This site is situated at 150 m and displays a mean annual precipitation of 61.3 mm. Alongside the Q. suber trees, plants from the genus Cistus are frequently observed. This site comprises several cork oaks displaying decline disease symptoms.
15
Figure 5. Satellite images of the four sampling sites, displaying the five Q. suber trees sampled. Panel A: Limãos (sampled 7th October 2015). Panel B:
16
2.2. Cork oak organs collection
From each sampling site, five trees were selected separated at least 30 m away from another Q. suber tree or other Fagaceae or Pinaceae plants. The selected plants did not exhibited apparent disease symptoms, although in Grândola, some trees with different decline levels (tree 1: 100%; tree 2: 20%; tree3: 60%; tree 4: 10%; tree 5: 90%) were selected. From each tree, seven branches and seven root samples, without any visible lesions, were harvested. The plant material was stored in plastic bags at 4ºC and processed within two days.
2.3. Sterilization and isolation of endophytic fungi
From each branch or root, five leaves, five twigs and five root segments were randomly selected. The plant material was washed under running water (15-20 s, for leaves and stems; 30 s, for roots), and then surface-sterilised in 70% (v/v) ethanol for two minutes, followed by immersion in commercial bleach (4 min, for leaves and stems; 6 min, for roots) with agitation. Finally, the material was immersed again in 70% (v/v) ethanol for one minute. The surface sterilisation was completed by three rinsings in sterile water. This method was shown to be sensitive enough to allow the growth of endophytic fungi and to be effective in eliminating epiphytes from the plant surface.
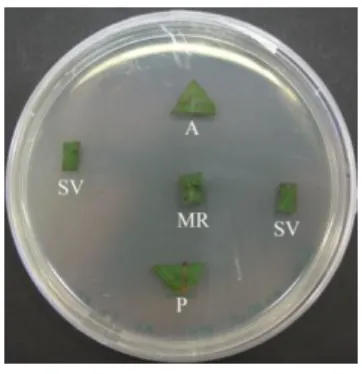
Leaves were cut into five fragments (5 mm2/each), distinguishing the petiole, the
midrib blade, the secondary veins blade and the apex, thus allowing the study of endophytes in different leaf parts. The stems and roots were cut into five fragments and placed on the surface of potato-dextrose agar (PDA) medium. Fungal growth was promoted at room temperature in the dark. A total of 630 PDA plates [five trees x three organs x seven samples x five replicas (and one control per sample)] were prepared for each location. Fungi that outgrowth from the plant segments were recorded as endophytes and sub-cultured in fresh PDA medium for subsequent identification. Fungal colonies were grouped by their cultural characteristics, further designated as cultural morphotypes. Water from the final rinsing (150 µL) was placed in PDA medium and used as control to ascertain the efficiency of the sterilization procedure (Rubini et al., 2005; Banhos et al., 2014).
17
2.4. Identification of fungal isolates and DNA extraction
Fungal isolates were grouped according to their cultural feature, which were used for defining different morphotypes. In the present work, the morphotype separation was performed based on similarity in colony color (surface and underneath), margin shapes, texture, elevation, exudates and sporulating structures (if present). A total of 24 different morphotypes were identified (Table 3).
Isolates of each cultural morphotype, obtained from each sampling site, were selected for molecular identification using the sequence of the internal transcribed spacer (ITS) region of the nuclear ribosomal DNA (rDNA). Morphotypes with higher number of isolates had more fungi selected for identification. For this purpose, fungal
DNA was extracted using the REDExtract-N-AmpTM
Plant PCR kit (Sigma-Aldrich,
USA). About 10 mg of mycelia was placed in 25 µL of extraction solution and heated for 10 min at 95ºC. The extraction was completed by adding 50 µL of dilution solution provided by the kit. Due to the high levels of polyphenols and polysaccharides of some fungal DNA, three samples were further purified using the ZR Fungal/Bacterial DNA
MiniPrepTMkit (Zymo Research, USA).
After DNA extraction, a PCR amplification was performed using ITS1F (CTTGGTCATTTAGAGGAAGTAA) and ITS2 (GCTGCGTTCTTCATCGATGC) as primers for the ITS regions (White et al., 1990; Gardes and Bruns, 1993) and a Taq
DNA polymerase created in our laboratory with the PCR conditions described in Table
4. The amplification was confirmed by agarose gel (1%) electrophoresis. PCR products were sequenced using Macrogen services (Amsterdam, Netherlands). Primary sequencing analysis was performed using Sequence Scanner v.2.0 software. Fungal identification was performed using the BLAST algorithm in both NCBI database (http://www.ncbi.nlm.nih.gov) and UNITE database (http://unite.ut.ee). Only the identifications corresponding to blasts with the lowest E-value (nearly 0.0) and high identity score (>97%) were accepted. The identified operational taxonomic units (OTUs) were taxonomically classified according to the Index Fungorum Database (http://www.indexfungorum.org). The OTUs that showed similar results were grouped
and aligned using DNASTAR’s Megalign 7.0.0. to see if differences in same species
18
Table 3: Description of the 24 different fungal morphotypes, distinguished by their colony
features and sporulating structures (described in the text).
Fungal
morphotype Description
A Opaque; Filamentous margin; Powdered texture; Flat elevation; Sprinkled/Hairy Surface; Whitish color. B Opaque; Filamentous margin and texture; Flat elevation; White surface with green splashes. C Opaque; Undulate margin; Filamentous texture; Flat elevation; Smooth surface; Greenish color. D Transparent; Filamentous margin, texture and form; Flat elevation; Bright.
E Transparent; Undulate margin; Filamentous texture; Flat elevation; Rhizoid form; Bright. F Opaque; Undulate margin; Filamentous texture; Flat elevation; Rhizoid form; Hairy surface; Whitish color. G Opaque; Undulate margin; Consistent texture; Flat elevation; Rhizoid form; Hairy surface; Orange pink color. X Transparent; Undulate margin; Filamentous texture and form.
I Opaque; Undulate margin; Filamentous texture; Flat elevation; Rhizoid form; Hairy surface; Yellow color. J Opaque; Creamy texture; Smooth margin; Convex elevation; Circular form; Rough surface; Whitish color. K Opaque; Filamentous margin and texture; Flat elevation; White surface with a brown center. H Opaque; Filamentous margin; Consistent texture; Flat elevation; Rhizoid form; Brown center. O Opaque; Filamentous margin; Hairy texture; Flat elevation; Orange tonality, with dark orange punctuation. R Opaque; Circular transparent margin; Hairy texture; Dark green in the center with black disperse punctuation (exudates). Y Opaque; Smooth margin; Hairy texture; White color, more concentrated in the center.
Z Opaque; Bright; Creamy texture; Smooth margin; Whitish color. T Opaque; Bright; Creamy texture; Undulate margin; Dark red color.
U Opaque; Smooth margin; Consistent texture; Convex elevation; Circular form; Yellow surface with white margins.
N Opaque; Smooth margin; Consistent texture; Convex elevation; Circular form; Brown surface. V Transparent; Undulate margin; Filamentous texture and form; Blue green center; Signs of sporulation in the surface. Q Opaque; Smooth margin; Consistent texture; Convex elevation; Circular form; Dark red surface; White bottom. Fx Opaque; Filamentous margin; Fluffy texture; Convex elevation; White color.
L Opaque; Filamentous margin (Ellipses) and texture; Hairy surface; Whitish color.
19
Table 4: PCR conditions used for amplification of the ITS region.
Temperature (ºC) Time Cycles
Initial denaturation 94 3 min 1
Denaturation 94 30 s 35
Annealing ---- 30 s 35
Extension 72 30 s 35
Final extension 72 10 min 1
Hold 4 Forever ----
2.5. Endophytic occurrence, diversity and statistical analysis
Fungal occurrence was measured by calculating the frequency of endophytic colonization and relative abundance found in each organ sample/tree. The endophytic colonization frequency (CF, %) was measured as the number of segments colonized by each fungal morphotype divided by the total number of plant segments examined. The relative abundance (RA, %) of each fungal morphotype was calculated by the total number of isolates of a specific morphotype divided by the total number of all isolates.
Species Diversity and Richness 4.1.2. (SDR) (Seaby and Henderson, 2007) and EstimateS 9.1.0. (Colwell, 2013) softwares were used to investigate species diversity
and richness estimators. The number of morphotypes shared between samples was obtained by SDR software. Alpha diversity indices determine the diversity of a specific community considering both the number of species and the proportion in which each species is represented. Simpson diversity index (D), Shannon-Wiener diversity index (H’), Fisher’s alpha as well as the species richness estimators, Chao1 and Jackknife 1, were calculated.
Simpson’s index (Simpson, 1949) (equation 1.) measures the probability
of any two randomly chosen individuals taken from an infinitely large community belong to the same species. This index is more focused on the abundance of species in
the sample than the species richness itself. Shannon index (H’) (Shannon, 1948)
(equation 2.) characterizes the species diversity in a community. This index computes the uncertainty associated with identifying species in a community. The other alpha
diversity index considered was Fisher’s alpha (Fisher et al., 1943) (equation 3.) that
20
where:
S, number of species
pi, proportion of the species i pi=ni/N
ni, number of individuals of specie i
N, total number of individuals ln pi, base 2 logarithm of pi
where:
S, number of taxa
N, number of individuals α – Fisher’s alpha; N(1-x)/x
Regarding the richness estimators, Chao 1 (Chao, 1984) (equation 4.) uses the number of species represented by one and two individuals in the samples. Jackknife 1 (Burnham and Overton, 1978, 1979) (equation 5.) estimates the total richness using the number of species present in only one sample.
where:
SJ, estimated richness s, observed richness
QJ, number of species that occur in j samples n, number of samples
21 The coefficient of similarity (Bray-Curtis coefficient) between soils samples was calculated using the Community Analysis Package 4.0 software (Henderson and Seaby, 2007). The Bray-Curtis coefficient (Bray and Curtis, 1957) (equation 6.) is a coefficient of beta diversity that is calculated considering the differences in abundance of each species between sites. This index was used over the Jaccard and Sorensen indexes because it considers the abundance.
where:
Yij and Yik, measure of species i in samples j and k,
Min (Yij , Yik), minimum of Yij and Yik p, number of species
The similarity between samples was performed by a non-metric multidimensional scaling (NMDS) performed in the Community Analysis Package 4.0 software (Henderson and Seaby, 2007). Other graphics and ANOVA statistical analysis between diversity parameters was determined by GraphPad Prism 5.0 software (San Diego, CA).
2.6. Antagonistic activity assays
Biscogniauxia mediterranea and Diplodia corticola fungi, the causal agents of two
major cork oak diseases - inner bark coal disease (Vannini et al., 2009) and oaks decline disease (Linaldeddu et al., 2014), respectively - were detected in cork oak stands, although sampled trees did not display disease symptoms. All the fungi used in antagonistic assays were isolated from apparently healthy leaves, stems and roots of cork oaks (Table 5 and Table 6). The endophytic fungal isolates obtained from Bragança were used to assess potential antagonistic activities against Biscogniauxia
mediterranea, whereas those isolated from Alcobaça were used to assess the potential
antagonistic activities against Diplodia corticola. These sites were chosen because they had both the pathogenic fungi and fungi with high antagonistic potential.
22
Table 5: Endophytic fungi used in the co-culture with Biscogniauxia mediterranea.
Fungi Classe Isolated from
Gelasinospora tetrasperma Sordariomycetes Leaves Trichoderma virens Sordariomycetes Roots Alternaria photistica Dothideomycetes Leaves Alternaria alternata Sordariomycetes Leaves and Stems Giberella pulicaris Dothideomycetes Roots Leptosphaeria maculans Sordariomycetes Leaves Fimetariela rabenhorstii Sordariomycetes Stems Dactylonectria estremocensis Dothideomycetes Roots Aspergillus niger Eurotiomycetes Roots Cladosporium cladosporoides Dothideomycetes Leaves and Stems
Table 6: Endophytic fungi used in the co-culture with Diplodia corticola.
Fungi Classe Isolated from
Gelasinospora tetrasperma Sordariomycetes Leaves Gelasinospora seminuda Sordariomycetes Stems Trichoderma virens Sordariomycetes Roots Neofusicoccum luteum Dothideomycetes Stems Fusarium acutatum Sordariomycetes Roots Saccharicola bicolor Dothideomycetes Roots Rosellinia corticium Sordariomycetes Leaves Diaporthe viticola Sordariomycetes Stems Ilyonectria spp. Sordariomycetes Roots Gnomoniopsis spp. Sordariomycetes Leaves
All isolates were isolated and sub-cultured onto PDA medium. Peripheral portions of each species mycelium were transferred to MMN (pH 6.6), a less nutritional medium than PDA, and incubated in the dark, at room temperature (c.25ºC). Small portions of peripheral mycelium of growing colonies were stamped out using an inverted sterile Pasteur pipette and were inoculated onto a fresh MMN medium (pH 6.6), at a distance of 3 cm from a B. mediterranea or D. corticola inoculum, prepared in a similar way. Antagonist assays using high-sporulating isolates were performed using spore suspensions prepared in sterile water. Spore suspensions (10 uL) were placed over
23 sterile filter paper discs (Ø 6 mm), introduced directly above MMN medium, at the same distances as previously referred. Co-cultures were incubated in the dark, at room temperature. For each assay, four co-culture replicas, four control B. mediterranea - B.
mediterranea (or D. corticola – D. corticola) and four control replicas for the
interacting fungus were established, for a total of 12 plates per assay.
The internal radius (inter-inoculants region) and external radius (diametrically opposed region) of the interacting fungal colonies were daily measured, until fungal contact occurs. Morphological changes, color of the colony on top and underside, margin, mycelium texture and halo formation were registered in both co-cultures and controls. GraphPad Prism 5 software was used to make the graphics as well as the statics analysis with ANOVA.
24
3. Results and discussion
The fungal isolates were obtained from a total of 20 cork oak trees in four different sites of continental Portugal (five trees per site). These spots were chosen because they present differences in water availability, due to the climatic parameters and agroforestry conditions, and had been previously studied for the presence of mycorrhizal root tips (Francisca Reis, ongoing PhD project). Fungal endophyte isolates were obtained from three different organs (leaves, stems and roots). A similar approach has been performed for obtaining fungal endophytes from olive trees (Olea europaeae) in the northeastern region of Portugal (Martins et al., 2016).
3.1. Structural analysis of fungal frequency and diversity
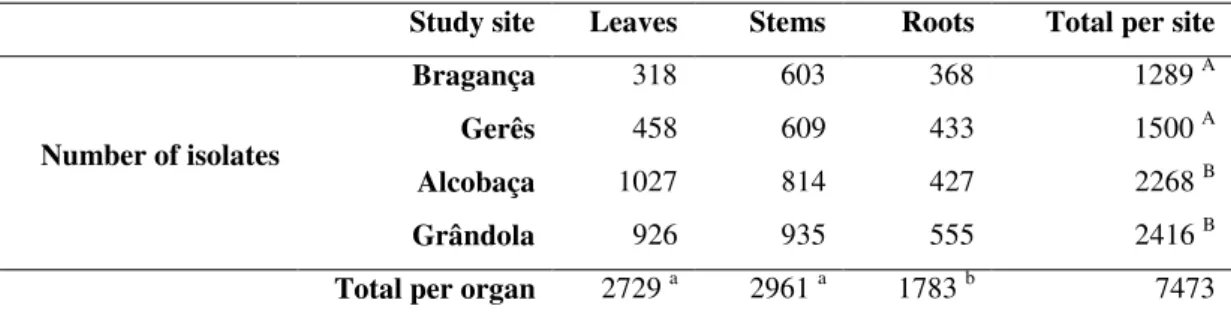
The total number of isolates obtained from all four sites was 7473 (Table 7). The isolates are mainly fast growing fungi due to the nature of the method used.
Table 7: Number of isolates of fungal endophytes by study site and by organ. Letters in
lowercase represent statistic differences (at P≤0.05) between the number of isolates present in the organs. Letters in uppercase represent statistic differences (at P≤0.05) between the number of isolates present in the study sites.
Study site Leaves Stems Roots Total per site
Number of isolates
Bragança 318 603 368 1289 A
Gerês 458 609 433 1500 A
Alcobaça 1027 814 427 2268 B
Grândola 926 935 555 2416 B
Total per organ 2729 a 2961 a 1783 b 7473
Alcobaça and Grândola showed significant higher infection levels than Bragança and Gerês, clearly distinguishing northern and southern sites. Indeed, all the explants removed from Alcobaça cork oaks presented fungal growth, corresponding to a fungal colonization frequency (CF) of 100%. Grândola explants also display a high frequency of colonization (91%), while Gerês and Bragança have only displayed 57% and 49% infection frequencies, respectively. Besides the geographic conditions, also the climatic conditions at sampling sites could have affected the endophyte occurrence. Both Alcobaça and Grândola were sampled in the spring (March and April, respectively) opposed to Bragança and Gerês that were sampled in autumn (October) and winter
25 (January), respectively. In a previous study on the influence of geographical and seasonal factors in endophyte occurrence on Quercus ilex, the degree of endophytic infection was also significantly higher in the spring when compared to autumn (Collado
et al., 1999). The authors suggested that the humidity and warm temperatures of the
spring season may have contributed for a higher fungal infection, resulting in a higher number of fungal isolates (Collado et al., 1999). The isolation frequency has also been suggested to be significantly dependent on season and geographical characteristics of the sampling sites when studying olive tree endophytes (Martins et al., 2016). Furthermore, the colonization frequency was already reported to be higher for trees growing at sea level (as Alcobaça and Grândola sites) when compared with those growing at higher elevations (higher than 350-400 m, like Bragança or Gerês) (Ragazzi
et al., 2003). Moreover, trees with a higher decline degree (like those in Grândola) have
presented a higher colonization frequency when compared with healthy trees (Ragazzi
et al., 2003). All these factors may be the cause for higher infection levels observed in
Alcobaça and Grândola, when compared to Bragança and Gerês.
When comparing the cork oak organs, the roots showed significant lower degree of infection (CF of 50%) from all three organs. In contrast, the above ground organs (leaves and stems) presented higher infection levels, with the stems (84%) just above the leaves (78%). The root endophytic fungi were isolated from the fine roots, which have recently been formed and therefore would have less endophytes than the structural roots (Kwaśna et al., 2016). In addition, some root endophytic fungi should be mycorrhizal and are difficult to cultivate or take months to grow ( e et al., 2000). Studies performed on several Quercus species have showed that stems usually have a higher colonization frequency than leaves (Kehr and Wulf, 1993; Ragazzi et al., 2003).
Due to the large number of fungal isolates, the isolated endophytes were grouped together considering their morphological characteristics. The concept of morphological species (delimited based on morphological characteristics) has been used since 1996, in studies regarding fungal endophytes (Bill et al., 1996). Schulthess and Faeth (1998) used the term “morphotype” to describe different morphological species of fungal endophytes found in Festuca arizonica leaves. A study evaluating the biodiversity and tissue occurrence of endophytic fungi in Tripterygium wilfordii has also separated the isolated fungi into different morphotypes (Kumar and Hyde, 2004). The major problem in sorting fungal isolates into morphotypes is that one cannot be
26 sure that these morphotypes truly reflect taxonomic units (Lacap et al., 2003). However, this method allows an overview of the diversity and, in some cases, be sufficient to distinguish species (Mayr, 1970).
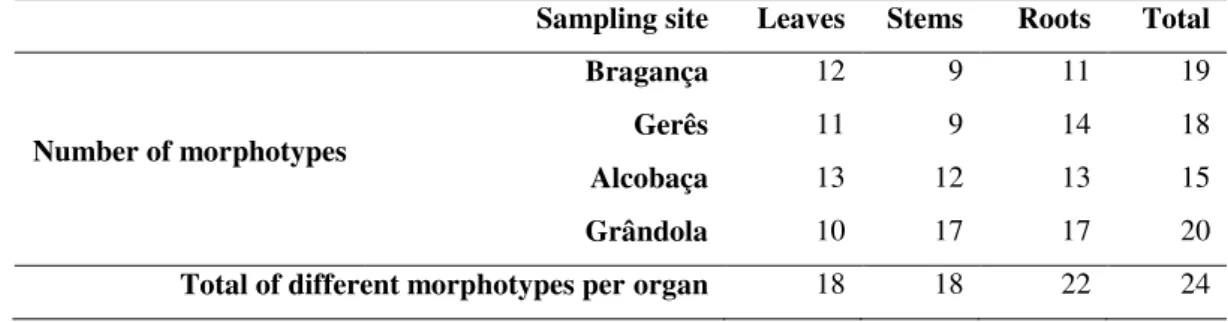
A total of 24 fungal morphotypes were distinguished in different cork oak samples from different sites (Table 8), based on their cultural features (described in detailed in Material and Methods section). The lowest number of fungal morphotypes was found in Alcobaça (15), whereas Grândola samples presented the highest number of morphotypes (20). Stems were the organs from which the lowest number of morphotypes were obtained, especially for Bragança and Gerês samples (9 in each, corresponding to 47.4% and 50% of the total morphotypes found in the respective sites). Although Alcobaça samples also revealed the lowest number of morphotypes found in stems (12), they correspond to 80% of the morphotypes found in that site. In contrast, the highest number of morphotypes was obtained from Grândola samples in stems and roots (17 each that corresponds to 85% of the morphotypes found in that site) than from leaves (10, corresponding to 50%). These results suggest a clear difference of morphotype distribution among organs and sampling sites.
Table 8: Number of fungal morphotypes found in each cork oak organ and sampling sites.
Sampling site Leaves Stems Roots Total
Number of morphotypes
Bragança 12 9 11 19 Gerês 11 9 14 18 Alcobaça 13 12 13 15 Grândola 10 17 17 20 Total of different morphotypes per organ 18 18 22 24
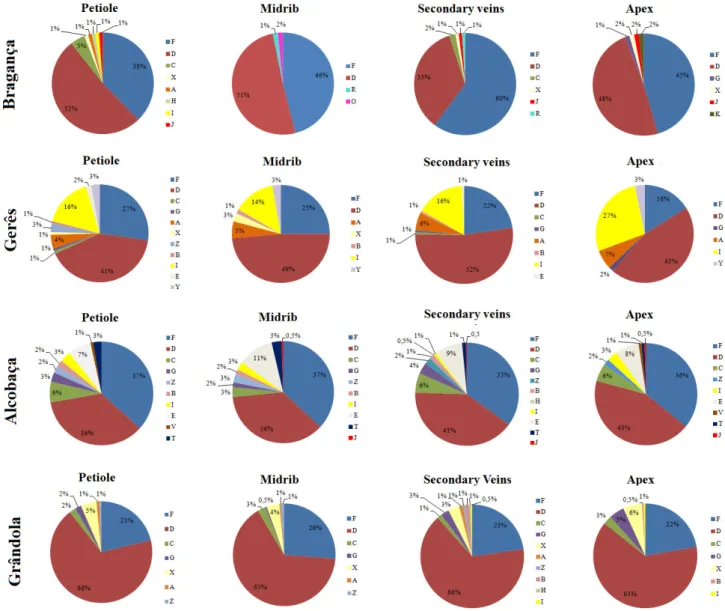
A color code chart representing the total number of isolates per morphotype in all studied sites was also created (Figure 7). From this color chart, the uniformization among replicas from each tree, and among trees from the same organ/sampling site becomes obvious. Differences between organs and sampling sites are also apparent. Such differences can be detailed when considering the colonization frequency (CF) and relative abundance (RA) of each morphotype in each organ (Table 9) and sampling site (Table 9). From all identified morphotypes, the morphotype D shows the highest colonization frequency and relative abundance (Table 9). This morphotype was present in all studied sites and organs, but its higher abundance (27.9%) in whole study is
27 mainly due to its high abundance in leaves (48.6%) from all sampling sites (Table 9). This morphotype was indeed the most abundant in all sampling sites, except in Alcobaça sampling site that revealed only 21.5% of morphotype D relative abundance, in contrast with morphotype F that presented 34.1% of relative abundance in this site (Table 9). The Morphotype F is also the most abundant morphotype in the stems (25.5%). In contrast, the morphotypes X and Z have the highest CF in the roots (10%), presenting very similar relative abundances (19.2% and 20.3%, respectively). In general, there is a clear dominance of morphotypes D and F in leaves and stems (that together account for more than 51.7% and 43.4% of relative abundance, respectively), whereas roots show more diversity in morphotypes. This result is corroborated by other studies that revealed that the endophytic mycota tends to be different when comparing roots with the above ground organs (Martins et al., 2016).
Endophytes has been described to be organ or location specific (Gange et al., 2007; Moricca et al., 2012). Accordingly, morphotypes L, Q, U and ÇÇ revealed to be root specific, whereas morphotypes O and K were leaf specific (Figure 7). In this study, no stem specific morphotypes were found. Furthermore, some morphotypes were only found in certain sampling sites, such as morphotypes L, K and O that were specific to Bragança, morphotype Q specific to Gerês, and morphotype ÇÇ specific to Grândola. In such cases, the morphotypes that are specific to one region are also specific for the organ (Table 9).
28
Figure 7. Color code chart of the different morphotypes (A to ÇÇ) found in all five trees of the studied sites. The color gradient indicates the number of isolates
29
Table 9: Colonization frequency (CF) and relative abundance (Ra, %) of each fungal morphotype in relation with all organs and study sites. The value of RA is shown in
brackets. Bold values represent the highest CF and RA values found in each organ or in the total.
Bragança CF (RA%) Gerês CF (RA%) Alcobaça CF (RA%) Grândola CF (RA%)
Leaves Stems Roots Total Leaves Stems Roots Total Leaves Stems Roots Total Leaves Stems Roots Total
A 0 (0.94) 0.08 (11.97) 0 (1.09) 0.03 (6.10) 0.11 (21.18) 0.11 (16.09) 0.02 (3.46) 0.08 (14.00) 0 (0.34) 0.06 (6.02) 0.02 (4.92) 0.03 (3.22) 0.01 (1.32) 0.09 (8.99) 0.03 (5.05) 0.04 (4.76) B 0 (0) 0.02 (2.87) 0 (0) 0.01 (1.33) 0 (0.66) 0.01 (1.15) 0 (0) 0 (0.67) 0.02 (1.72) 0.01 (0.61) 0.01 (2.11) 0.01 (1.28) 0.01 (0.72) 0.04 (4.62) 0 (0.56) 0.02 (2.00) C 0.01 (1.88) 0.05 (6.75) 0 (0) 0.02 (3.60 0 (0.87) 0 (0) 0 (0) 0 (0.27) 0.06 (6.19) 0.01 (0.86) 0.01 (1.41) 0.03 (3.04) 0.02 (2.27) 0.15 (15.15) 0 (0.75) 0.07 (7.55) D 0.17 (45.45) 0.22 (32.88) 0.06 (13.62) 0.15 (30.49) 0.20 (38.65) 0.10 (14.78) 0.10 (21.02) 0.14 (23.87) 0.38 (38.03) 0.06 (6.51) 0.04 (8.20) 0.21 (21.47) 0.59 (61.48) 0.20 (20.24) 0.05 (8.41) 0.32 (35.06) E 0 (0) 0.02 (2.87) 0 (0) 0.01 (1.33) 0 (0.66) 0 (0) 0 (0) 0 (0.20) 0.09 (9.28) 0.16 (17.20) 0 (0) 0.10 (10.10) 0 (0) 0.16 (16.80) 0 (0.37) 0.06 (6.84) F 0.17 (47.34) 0.16 (23.61) 0.05 (12.81) 0.13 (26.43) 0.11 (20.31) 0.12 (16.75) 0 (0) 0.07 (13.00) 0.33 (33.22) 0.38 (40.79) 0.09 (17.56) 0.34 (34.13) 0.24 (25.48) 0.18 (18.58) 0.18 (28.97) 0.21 (22.75) G 0 (0.31) 0.03 (3.88) 0 (0.27) 0.01 (1.95) 0 (0.66) 0 (0.33) 0 (0.46) 0 (0.47) 0.03 (2.63) 0.01 (0.61) 0.01 (2.11) 0.02 (1.68) 0.03 (2.75) 0.06 (6.04) 0.02 (3.55) 0.04 (3.88) X 0 (0.94) 0.10 (14.84) 0.13 (30.25) 0.08 (15.79) 0 (0.66) 0.05 (6.90) 0.04 (7.16) 0.03 (5.07) 0 (0) 0.04 (3.93) 0.07 (15.22) 0.04 (4.28) 0.05 (4.78) 0.01 (1.42) 0.15 (24.49) 0.07 (7.64) I 0 (0.31) 0 (0) 0 (0) 0 (0.08) 0.08 (14.63) 0.30 (43.19) 0.01 (1.15) 0.13 (22.33) 0.03 (2.63) 0.15 (16.34) 0.02 (4.22) 0.08 (7.67) 0 (0.24) 0.04 (4.62) 0.01 (2.24) 0.02 (2.21) J 0 (0.94) 0 (0) 0 (0) 0 (0.23) 0 (0) 0 (0) 0 (0) 0 (0) 0 (0.34) 0 (0) 0.02 (3.51) 0.01 (0.79) 0 (0) 0 (0.24) 0.01 (1.12) 0 (0.33) K 0 (0.31) 0 (0) 0 (0) 0 (0.08) 0 (0) 0 (0) 0 (0) 0 (0) 0 (0) 0 (0) 0 (0) 0 (0) 0 (0) 0 (0) 0 (0) 0 (0) H 0 (0.31) 0 (0) 0 (0) 0 (0.08) 0 (0) 0 (0) 0.01 (1.15) 0 (0.33) 0 (0.11) 0 (0) 0.01 (2.11) 0 (0.44) 0 (0.24) 0.01 (0.59) 0 (0.56) 0 (0.42) O 0 (0.31) 0 (0) 0 (0) 0 (0.08) 0 (0) 0 (0) 0 (0) 0 (0) 0 (0) 0 (0) 0 (0) 0 (0) 0 (0) 0 (0) 0 (0) 0 (0) R 0 (0.63) 0 (0.34) 0 (0.27) 0 (0.39) 0 (0) 0 (0) 0 (0) 0 (0) 0 (0) 0 (0) 0 (0) 0 (0) 0 (0) 0 (0.12) 0 (0) 0 (0.04) Y 0 (0) 0 (0) 0.01 (2.45) 0 (0.70) 0.01 (1.53) 0 (0.66) 0 (0) 0 (0.73) 0 (0) 0 (0) 0 (0) 0 (0) 0 (0) 0 (0.47) 0 (0) 0 (0.17) Z 0 (0) 0( 0) 0.13 (30.25) 0.04 (8.68) 0 (0.22) 0 (0) 0.05 (10.16) 0.02 (3.00) 0.03 (2.75) 0.02 (2.58) 0.13 (27.40) 0.07 (7.14) 0.01 (0.72) 0.01 (0.59) 0.10 (15.89) 0.04 (4.01) T 0 (0) 0( 0) 0.04 (8.72) 0.01 (2.50) 0 (0) 0 (0.16) 0 (0.92) 0 (0.33) 0.02 (2.18) 0 (0) 0.01 (3.04) 0.01 (1.41) 0 (0) 0 (0) 0.01 (1.68) 0 (0.38) U 0 (0) 0( 0) 0 (0) 0 (0) 0 (0) 0 (0) 0.08 (16.63) 0.03 (4.80) 0 (0) 0 (0) 0 (0) 0 (0) 0 (0) 0 (0) 0 (0.37) 0 (0.08) N 0 (0) 0( 0) 0 (0) 0 (0) 0 (0) 0 (0) 0 (0.46) 0 (0.13) 0 (0) 0 (0) 0 (0) 0 (0) 0 (0) 0 (0.12) 0 (0) 0 (0.04) V 0 (0) 0( 0) 0 (0.27) 0 (0.08) 0 (0) 0 (0) 0 (0.69) 0.01 (1.13) 0 (0.46) 0 (0.12) 0 (0) 0 (0.22) 0 (0) 0 (0.36) 0 (0.56) 0 (0.25) Q 0 (0) 0( 0) 0 (0) 0 (0) 0 (0) 0 (0) 0 (0.69) 0 (0.20) 0 (0) 0 (0) 0 (0) 0 (0) 0 (0) 0 (0) 0 (0) 0 (0) Fx 0 (0) 0( 0) 0 (0) 0 (0) 0 (0) 0 (0) 0.16 (32.79) 0.05 (9.47) 0 (0) 0.04 (4.42) 0.04 (8.20) 0.03 (3.13) 0 (0) 0.01 (1.07) 0.03 (5.23) 0.01 (1.54) L 0 (0.31) 0( 0) 0 (0) 0 (0.08) 0 (0) 0 (0) 0 (0) 0 (0) 0 (0) 0 (0) 0 (0) 0 (0) 0 (0) 0 (0) 0 (0) 0 (0) ÇÇ 0 (0) 0( 0) 0 (0) 0 (0) 0 (0) 0 (0) 0 (0) 0 (0) 0 (0) 0 (0) 0 (0) 0 (0) 0 (0) 0 (0) 0 (0.19) 0 (0.04) Total 0.36 (100) 0.68 (100) 0.42 (100) 0.49 (100) 0.52 (100) 0.70 (100) 0.49 (100) 0.57 (100) 1 (100) 0.93 (100) 0.49 (100) 1 (100) 0.96 (100) 0.97 (100) 0.61 (100) 0.91 (100)