Cármen Sofia Vieira de Sousa
June 2014
Analysis of gene expression variability in
Staphylococcus epidermidis biofilms
UMinho|20 14 Cármen Sof ia Vieir a de Sousa Anal ysis of gene e xpression v ariability in Staphylococcus epidermidis biofilms
Universidade do Minho
Escola de Ciências
Cármen Sofia Vieira de Sousa
June 2014
Master Thesis
Master in Molecular Genetics
Analysis of gene expression variability in
Staphylococcus epidermidis biofilms
Universidade do Minho
Escola de Ciências
Work performed by supervisor of
Doctor Nuno Cerca
Work performed by co-supervisor of
Doctor Björn Johansson
DECLARAÇÃO
NOME: Cármen Sofia Vieira de Sousa
ENDEREÇO ELECTRÓNICO: [email protected]
BILHETE DE IDENTIDADE: 13367698
TÍTULO DA TESE DE MESTRADO:
Analysis of gene expression variability in Staphylococcus epidermidis biofilms Análise da variabilidade da expressão genética em biofilmes de S. epidermidis
ORIENTADOR: Doutor Nuno Cerca
CO-ORIENTADOR: Doutor Björn Johansson
ANO DE CONCLUSÃO: 2014
MESTRADO EM:
Mestrado Genética Molecular
É AUTORIZADA A REPRODUÇÃO INTEGRAL DESTA DISSERTAÇÃO APENAS PARA EFEITOS DE INVESTIGAÇÃO, MEDIANTE DECLARAÇÃO ESCRITA DO INTERESSADO, QUE A TAL SE COMPROMETE;
Universidade do Minho, ___/___/______
iii
ACKNOWLEDGMENTS
The realization of this master thesis was possible due to the contribution of many people, which I´m very grateful.
It´s an honour for me that I acknowledge, with deep gratitude, my supervisor Professor Nuno Cerca, for receiving me at his laboratory and group, for the support and knowledge that made me overcome any difficulty along the way. His guidance was a good beggining to my scientific career and inspired me to working in research. I can´t forget some opportunities that he gave me along my degree.
To all Nuno Cerca group members, for all support and for providing and excellent and friendly atmosphere, specially to Ângela França by the support of procedures, methodologies and her knowledge in this research area, which were very important to me, for my improvement and growth.
To all colleagues of the laboratory and Master course.
Finally, the most important thanks goes to my parents because, what I am today I owe to them and without them none of this would be possible. So, the least I can do is dedicate this thesis to them.
This thesis was funded by European Union funds (FEDER/COMPETE) and by national funds (FCT)
under the projects with reference FCOMP-01-0124-FEDER-014309
v
Análise da variabilidade da expressão genética em biofilmes de
S. epidermidis
RESUMO
Staphylococcus epidermidis é um agente bacteriano comensal que coloniza, maioritariamente, o epitélio humano mas, mediante determinadas condições, pode tornar-se num agente patogénico oportunista. Atualmente, esta espécie é causadora da maior parte de infeções adquiridas em ambiente hospitalar, especificamente em dispositivos médicos. Os mecanismos de colonização e adaptação desta bactéria não estão totalmente estudados, no entanto é conhecido que esta bactéria torna-se patogénica quando o hospedeiro está imunodeprimido e o processo infecioso ocorre devido à inserção do dispositivo médico e, consequentemente, à formação de agregados tridimensionais denominados de biofilme. Os biofilmes fornecem inúmeras vantagens às bactérias nomeadamente, adaptação a novos ambientes, proteção física, resistência a antibióticos e mecanismos de defesa ao sistema imunitário do hospedeiro. Todas estas interações resultam de diferentes perfis de expressão genética e, desta forma, é extremamente importante o estudo das alterações na expressão dos genes, quando os biofilmes estão presentes. Para tal, são fundamentais três etapas experimentais: extração de RNA, síntese de cDNA e PCR quantitativo em tempo real. No entanto, sabe-se que há variabilidade inerente a cada uma das etapas, bem como relativo ao crescimento das estruturas heterogéneas dos próprios biofilmes. O principal objetivo deste trabalho foi estudar a influência das várias etapas experimentais na variabilidade na expressão genética no crescimento bacteriano. Ao longo deste trabalho, estudou-se a capacidade de formação de biofilme e a presença dos genes de interesse, entre diferentes estirpes de S. epidermidis. De seguida, selecionou-se as estirpes mais indicadas para a quantificação da expressão genética. Os nossos resultados demonstraram que a variabilidade biológica foi o principal causador da variabilidade na quantificação da expressão dos genes. Por conseguinte, propusemos a otimização de um simples protocolo experimental, de modo a minimizar esta variabilidade. Esta otimização baseou-se, na utilização de uma mistura de 20 biofilmes independentes, utilizados num único passo de extração de RNA. Foi observado, com sucesso, a redução da variabilidade biológica, utilizando duas estirpes independentes de S. epidermidis.
vii
Analysis of gene expression variability in
Staphylococcus epidermidis
biofilms
ABSTRACT
S. epidermidisis the most frequently bacteria isolated from human epithelia, and for a long time, it has been regarded as an innocuous commensal bacterium. However, currently, this bacteria persist as a major cause of hospital and community-acquired infections. It is primarily associated with infections of indwelling medical devices, by the formation of a structure called a biofilm. The biofilms can quickly adapt to new conditions and consequently, can result in the appearance of infections, that are resistance to many antibiotics and mechanisms of the host immune defense. So, it is crucial to study gene expression and their influence in biofilm formation. In gene expression studies, there are three fundamental experimental steps which have some variability: RNA extraction, reverse-transcriptase reaction and quantitative polymerase chain reaction (qPCR). However, since biofilms are very heterogeneous communities, often gene expression studies reveal a high variability. The objective of this work was to demonstrate and understand the influence in the variability of gene expression quantification, by the individual experimental steps required for gene expression quantification, namely bacterial growth, RNA extraction, reverse transcriptase and real-time quantitative PCR. We tested the biofilm formation and the presence of key genes in several strains of S. epidermidis in order to select the strains to be used in the gene expression studies. Our results demonstrated that biologic variability was the step which more influence gene expression quantification. Additionally, we proposed an optimized protocol to enhance gene expression reproducibility in S. epidermidis biofilms and our results were favorable since we reduced the biologic variability with a pool of 20 biofilms, as determined by the quantification of gene expression in two independent strains.
ix CONTENTS ACKNOWLEDGMENTS ... iii RESUMO ... v ABSTRACT ... vii NOMENCLATURE ... xi LIST OF PUBLICATIONS ... xv
LIST OF FIGURES ...xvii
LIST OF TABLES ... xix
CHAPTER 1 ... 1
1.1 Staphylococcus epidermidis ...3
1.2 Microbial biofilms ...4
1.2.1 General model of biofilm formation ...4
1.2.2 Biofilm matrix ...5
1.3 How S. epidermidis forms biofilms? ...6
1.3.1 Initial Adhesion ...7
1.3.2 Biofilm Maturation ...8
1.4 The impact of biofilms in health ... 12
1.4.1 Biofilm infections in indwelling medical devices ... 12
1.4.2 Immune response and resistance for antibiotics ... 13
1.5 Biofilm gene expression ... 15
1.5.1 Techniques used for gene expression determination ... 17
1.6 Study objective ... 18
CHAPTER 2 ... 19
2.1 Introduction ... 21
2.2 Materials and Methods... 22
2.2.1 Bacterial strain and growth conditions ... 22
2.2.2 Biofilm formation assays ... 22
2.2.3 Customized RNA extraction protocol ... 23
2.2.4 DNAse Treatment ... 24
2.2.5 RNA Quality Determination... 24
2.2.6 cDNA synthesis ... 24
2.2.7 Gene expression quantification ... 25
x
CHAPTER 3 ... 33
3.1 Introduction ... 35
3.2 Material and Methods ... 35
3.2.1 Bacterial strain and growth conditions ... 35
3.2.3 Genomic DNA Extraction and PCR ... 36
3.3 Optimized quantification of gene expression ... 36
3.4 Results and Discussion ... 37
CHAPTER 4 ... 43
xi
NOMENCLATURE
Abbreviations
A absorbance
Aap accumulation associated protein
Aap accumulation associated gene
ADI arginine deiminase operon
Agr accessory gene regulator
AHIs acylated homoserine lactones
AI autoinducers
AIP auto-inducing peptide
AMPs antimicrobial peptides
ATCC american type culture collection
AtlE autolysin E
ATP adenosine triphosphate
Aur gene that encodes metalloprotease
Bap biofilm associated protein
Bp base pairs
Cap complete capsule
cDNA complementary DNA
ClpP caseinolytic Clp protease
CoNS coagulase-negative staphylococci
CT cycle threshold
DEPC diethylpyrocarbonate
xii
dNTPs deoxynucleotide triphosphates
eDNA environmental DNA
EDTA ethylenediamine tetraacetic acid
Embp binding protein to the extracellular matrix of the host
EPS Extracellular polymeric substances
Fmtc multiple peptide resistance factor gene
GC guanidine-citosine
G5 short tandem repeat
GlcNAc N-acetilglucosamine monomers
Ica intercellular adhesion gene
IL interleukins
LrgB antiholin-like proteins gene
LuxS quorum-sensing system in Staphylococci
LuxS protein
MASCRAMM microbial surface components recognizing adhesive matrix molecules
µL microliter
mL milliliter
mM milimol
MGEs mobile genetic elements
MIQE minimum information for publication
mRNA messenger RNA
n number
NaCl sodium chloride
xiii
NRT reverse transcriptase minus negative control
NTC no-template control
O.D. optical density
P promoter
PBP2a penicillin-binding protein
PCR polymerase chain reaction
PGA poly-y-glutamic acid
Pgi glycolytic / gluconeogenic gene
PIA polysaccharide intercellular adhesion
PNAG poly-N-acetylglucosamine
PSM phenol soluble modulins
qPCR quantitative PCR
QS quorum-sensing
RNA ribonucleic acid
RPM rotation per minute
rRNA ribossomic RNA
RT room temperature
RT-PCR reverse transcriptase PCR
S. staphylococcus
SarA staphylococcus aureus protein A
SarZ staphylococcus aureus protein Z
SCCmec staphylococcal cassette chromosome mec
SdrF colagen-binding protein
xiv
SdrH elastin-binding protein
SigB sigma factor ∂B
Spl serine protease-like proteins
TCA tricarboxylic acid
TLR2 toll-like receptor 2
TSA tryptic soy agar
TSB tryptic soy broth
TSBG tryptic soy broth supplemented with glucose
xv
LIST OF PUBLICATIONS
Abstracts and Posters
Sousa, C.; França, A. and Cerca, N. (2013). Analysis of gene expression variability in Staphylococcus epidermidis biofilms. MICROBIOTEC´13, 6-8 December, Aveiro, Portugal.
xvii
LIST OF FIGURES
Figure 1.1 – Different stages of biofilm formation (Adapted from http://woundsinternational.wordpress.com)...5 Figure 1.2 - The S. epidermidis cell surface (Adapted from Otto, 2009)……….…8 Figure 1.3 - The exopolysaccharide poly-N.acetylglucosamine (Adapted fromOtto, 2009)……….10 Figure 1.4 - Schematic model of phases involved in S. epidermidis biofilm formation on medical devices (Adapted from Heilmann and Götz, 2013)………13 Figure 1. 5 - Innate and Adaptative immunity (Adapted from http://www.rikenresearch.riken.jp)...15 Figure 2.1 - Scheme representation of the experimental design aiming to determine the source of gene expression variability………22 Figure 2.2 – Example of integrity of RNA samples of RP62A: (A) DNA marker, (B to E) independent RNA samples…...27 Figure 2.3 - Coefficient of biological variability (in %) of gene expression of aap, lrgB, fmtC, icaA, pgi………..28 Figure 2.4 - Coefficient of RNA extraction variability (in %) of gene expression of aap, lrgB, fmtC, icaA, pgi………29 Figure 2.5 – Coefficient of reverse transcriptase variability (in %) of gene expression of aap, lrgB, fmtC, icaA,
pgi………31
Figure 2.6 - Coefficient of qPCR variability (in %) of gene expression of aap, lrgB, fmtC, icaA, pgi………..32 Figure 3.1 - Scheme representation of a proposed experimental protocol aiming to reduce the coefficient of gene expression variability………...35 Figure 3.2 - Biofilm formation, at 24 H, was quantified by a spectrophotometry (640 nm filter): ATCC strain at blue color, clinical strains at red color and commensal strains at green color………..37 Figure 3.3 - Comparison of biologic variability coefficient, in aap gene, without and with a pool of 20 biofilms (RP62A strain)……….39 Figure 3.4 - Comparison of biologic variability coefficient, in pgi gene, without and with a pool of 20 biofilms (RP62A strain)……….39 Figure 3.5 - Comparison of biologic variability coefficient, in aap gene, without and with a pool of 20 biofilms (9142 strain)……….40 Figure 3.6 - Comparison of biologic variability coefficient, in pgi gene, without and with a pool of 20 biofilms (9142 strain)……….40
xix
LIST OF TABLES
Table 1.1 Main recognized virulence factors of S. epidermidis (Adapted from Otto Nat. Rev. Microbiol., 2009, 7(8):
555-67)……….16
Table 2.1 - Primers, amplicons, functions and melting temperature for the primers used in this study………..…26
Table 2.2 - Efficiency of five genes studied………....27
Table 2.3 – Quantification of gene expression normalized to 16S, using four independent biofilms………....28
Table 2.4 – Quantification of gene expression normalized to 16S, using four different RNA extractions from the same biofilm………...29
Table 2.5 –Quantification of gene expression normalized to 16S, using four cDNA synthesis obtained from the same RNA sample……….30
Table 2.6 – Quantification of gene expression normalized to 16S, in four qPCR experiences from the same cDNA…..31
Table 3.1 - Origin of different S. epidermidis strains……..………37
xxi
“Remember that people can take everything from you, unless your knowledge”
CHAPTER 1
Introduction
Introduction
Chapter 1 • 3
1.1
Staphylococcus epidermidis
Staphylococci is a group of bacteria that are responsible for causing a variety of diseases, ranging from minor skin infections to life-threatening bacteremia and may cause a significant morbidity and/or mortality (Gill, 2005; CDC, 2012). Currently, they persist as a major cause of hospital and community-acquired infections worldwide which represents an increasing problem in modern medicine (O´Gara, 2001). Nevertheless, some species of Staphylococci have a good symbiotic relationship with their host (Azevedo, 2012; Li, 2000; Baldassarri, 1997).
A major nosocomial and opportunistic pathogen of this genus is Staphylococcus epidermidis that belongs to the genus Staphylococcus, family Staphylococcaceae. This genus has leastwise 30 species whereupon Staphylococcus aureus, Staphylococcus epidermidis and Staphylococcus saprophyticus which are commonly associated with human infections (Azevedo, 2012; Euzeby, 2014).
S. epidermidis is the most frequently isolated from human epithelia, and colonizes the axillae, head and nares (Kloos and Musselwhite, 1975) and for a long time, it has been regarded as an innocuous commensal bacterium (Vuong and Otto, 2002). Epidemiological studies have demonstrated that healthy people carry between 10 and 24 different strains of S. epidermidis at any one time (Kloos and Musselwhite, 1975). This specie is a gram-positive (like all Staphylococcus) which means that the cell hall is constituted by a thick layer of peptidoglycan and is known as coagulase-negative staphylococci (CoNS), since it does not produce the coagulase enzyme (Wang, 2003; Wisplinghoff, 2003). In clinical microbiology, CoNS are used to distinguish between S. aureus (produces coagulase enzyme) and other staphylococci. However, based in some studies that did a species identification, it his proposed that most of non-specified CoNS infections are due to S. epidermidis (CDC, 2004; Rogers et al., 2009).
The cells of S. epidermidis are spherical, encapsulated and frequently, in the form of irregular curls. The colonies are smooth, high, shiny and opaque, varying it´s color from white to golden yellow (Götz et al., 2006). From a biochemical point of view, S. epidermidis is facultative anaerobic, which means that they can grow in the absence of oxygen or having aerobic respiration; catalase positive responsible for catalyze the decomposition of hydrogen peroxide to water and oxygen and oxidase negative which means that not produce cytochrome c oxidase(Götz et al., 2006). This specie colonizes the skin of human population as previously mentioned (symbiotic relationship). Although the mechanisms of adaption and colonization are not fully understood,
Introduction
4 • Chapter 1
analysis of S. epidermidis genome revealed the carriage of genes with predicted function in the protection (Gill et al., 2005; Zhang et al., 2003). This bacterium is primarily associated with infections of indwelling medical devices (pathogen relationship), such as prosthetic heart valves, peripheral or central intravenous catheters and joint prostheses (Dai et al., 2012). These infections occur during device insertion and form multilayered agglomerations called biofilmsthat will be further discussed below (Chu et al., 2009).
1.2 Microbial biofilms
The majority of bacteria (around 99%) are normally found in biofilm (O´Gara and Humphreys, 2001). It has been suggested that biofilms can provide many advantages to bacteria: adaptation at new environments, such as mutations in genome (Percival et al., 2000); physic protection by tridimensional biofilm and their matrix (Donlan and Costerton, 2002); metabolic potential (heterogeneity and stratification) that indicates different genetic expressions of microorganisms and source of genetic information that can be an advantage to evolution of species (Costerton et al., 1999). For the same reason, several reports demonstrated that pathogenic bacteria form biofilms preferentially, which is recognized as the major of virulence factor (O´Gara and Humphreys, 2001). These biofilms are extremely difficult to threat and represents a serious burden to the public health system (Chu et al., 2009).
1.2.1 General model of biofilm formation
A biofilm is normally defined as a structured and three-dimensional community of bacteria attached to an abiotic or living surface and surrounded by a matrix of extracellular polymeric substances (EPS) (Percival et al., 2012) such as proteins, lipids, polysaccharides, nucleic acids (Donlan and Costerton, 2002).
Biofilm formation occurs in several stages: (1) contact of planktonic bacteria with a surface, mediated by non-specific interactions such as hydrophobic and electrostatic interactions; (2) growth in clusters with the presence of specific molecules, such as adhesins; (3) the matrix becomes to be formed; (4) biofilm maturation (more thicker) and the matrix more proeminent; (5) bacteria will then detach from the biofilm and (6) will colonize different surfaces or regions of a specific surface as can see in Figure 1.1 (Fey and Olson, 2010; Stoodley et al., 2002).
Introduction
Chapter 1 • 5
The first contact of planktonic bacteria may occur by a direct adhesion to the polymer surface or adhesion to host matrix proteins that cover the polymer surface, often associated with medical device-related infections. After this stage, structures, named microcolonies, are formed by the multiplication of bacteria and the production of extracellular matrix. These two stages constitute the initial adhesion. The biofilm maturation consists in the formation of channels of water, ion and nutrient exchange (three-dimensional appearance). Finally, the dispersal of single bacteria cells, or large cell clusters, may occur and consequently, initiate a new cycle of biofilm formation anywhere else in the host (Rohde et al., 2006; Schoenfelder et al., 2010).
Figure 1.1 –Different stages of biofilm formation(Adapted from http://woundsinternational.wordpress.com).
1.2.2 Biofilm matrix
The biofilm matrix, sometimes also referred as the biofilm EPS, is very important for the survival of bacteria inside the biofilm, against adverse conditions (Flemming et al., 2000). These conditions can be low nutrient availability (Cerca and Jefferson, 2012), high osmotic stress (Hamilton and Characklis, 1989) or susceptibility of antibiotics (Howden et al., 2010).
EPS varies in physical (such as diffusivity, thermal conductivity and rheological properties) and chemical properties and can account for 50 %-90 % of the total organic carbon of biofilms (Flemming et al., 2000; Sutherland et al., 2001). These substances are highly hydrated and may be hydrophilic and hydrophobic with different degrees of solubility (Sutherland et al., 2001). In
Introduction
6 • Chapter 1
Gram-positive bacteria, such as S. epidermidis, the EPS produced are primarily cationic which produces exopolymers such as poly-y-glutamic acid (PGA) and poly-N-acetylglucosamine (PNAG) (PNAG will be further discussed in the biofilm development of S. epidermidis) (Percival et al., 2000).
The main function of the matrix is to ensure cohesion of the biofilm structure since this structure is not rigid and the exposure to the mechanical stresses can lead a part of biofilm will break and release from the surface (Rohde et al., 2006; Schoenfelder et al., 2010). There are more functions, not least important, such as initial adhesion (polysaccharides, proteins, DNA, amphiphilic molecules) (Rhode et al., 2007); intercellular adhesion (polysaccharides, proteins and DNA); water retention (hydrophilic polysaccharides) (Heilmann et al., 2006); protective barrier (polysaccharides and proteins) (Gross et al., 2001); adsorption of compounds (polysaccharides with charge and proteins) (Cockayne et al., 1998); enzymatic activity (proteins); nutrients source (any components of the matrix) (Cerca and Jefferson, 2012); exchange of genetic information (DNA) (Molin et al., 2003) and storage energetic (polysaccharides) (Sadovskaya et al., 2005). Some reports have been shown to protect bacteria against antibiotics therapy and host immune attack that will be further discussed (Arciola et al., 2005; Beenken et al., 2004; Cerca et al., 2006; Nagarajan et al., 2009; Yao et al., 2005).
1.3 How S. epidermidis forms biofilms?
Many bacteria use signaling systems to adapt gene expression to environmental changes (Chen et al., 2002). Staphylococci group have two known quorum sensing (QS) systems (agr and luxS systems) which can be defined as bacterial intercommunication systems that control the expression of multiple genes, in response to cell density (Fuqua et al., 1994). These systems use autoinducers (AI), which are small signal molecules and when accumulated to a threshold concentration activates the system, directly or indirectly, controlling the transcription of specific genes (Yarwood and Schlievert, 2003). Gram-positive bacteria, such as S. epidermidis, use oligopeptide AIs that moves athwart two-component phosphorely cascades while gram-negative bacteria use acylated homoserine lactones (AHLs) (Carmody et al., 2004).
The importance of agr system in biofilm formation was first shown by the group of Otto (Otto et al., 2001). The QS is encoded by the accessory gene regulator (agr) locus and consists of
Introduction
Chapter 1 • 7
four genes (agrA, agrB, agrC and agrD) that are co-transcribed. The system is organized in a two-component of transmembrane transduction complex (agrA and agrC), a pro-signalling peptide (agrD) and a membrane component (agrB), responsible for the externalization of the post-translationally modified signaling peptide which consists of an auto-inducing peptide (AIP) (Vuong et al., 2000; Otto et al., 2001). This system are regulated directly by DNA-binding protein agrA or through the regulatory RNAIII (Novick et al., 1993). The agrA activates the P2 promoter which controls expression of agrB, agrC, agrD, agrA and it also activates P3 promoter which drives expression of RNAIII and the embedded phenol-soluble modulin ∂–toxin (Queck et al., 2008). The QS agr system is activated during the transition from exponential to a growth stationary phase. Despite, the role of agr during infection is controversial (Qin et al. 2007), some studies reported that controls the expression of a serie of toxins (Vuong et al. 2004), virulence factors (Janzon et al., 1989), represses biofilm formation (Vuong et al., 2000; Otto et al., 2001) and the interaction with innate immune system (Otto et al., 2001) that will be further discussed below.
The QS system more recently described was luxS and this role was not well studied. However, it is known that luxS uses autoinducer 2 (AI-2), limits biofilm formation, virulence, regulate the ica gene (represses the icaADBC transcription) and production of PIA (synthesis) (Lin et al., 2006; Xu et al., 2006). This system is not always accompanied by endogenous AI-2 activity suggesting that AI-2 QS system may not be operative in some bacteria. The same study showed that luxS in S. epidermidis is functional and luxS-dependent gene regulation represses biofilm formation in vitro and pathogen success during biofilm-associated infection. Thus, by regulating different biofilm factors, the two QS systems of Staphylococcus, have very similar effects on the biofilm mode of growth (Lin et al., 2006).
1.3.1 Initial Adhesion
Initial adhesion is characterized by the bacterial adherence to foreign body or biomaterials (Vacheethasanee et al., 1998). In S. epidermidis hydrophobic interactions (biofilm associated protein – Bap) and adhesins/autolysins (Autolysin E – AtlE)) are involved adhesion to uncoated surfaces (Vacheethasanee et al., 1998). The human body quickly reacts to the presence of medical devices by coating them with glycoproteins and proteins, such as fibronectin, vitronectin, fibrinogen, albumin and immunoglobulins (Begun et al., 2007). The specific binding with fibronectin is mediated by a surface proteins group characterized by the presence of various
serine-Introduction
8 • Chapter 1
aspartate repetitions. The interaction with fibronectin seems be get by techoic acids and also by a binding protein to the extracellular matrix of the host (Embp) (Gross et al., 2011). AtlE also mediate the interaction and this protein is connected to the Bap. Both proteins are responsible for contributing to the hydrophobic character of the cell surface, that will have an impact on the initial adhesion to surfaces (Mann et al., 2009).
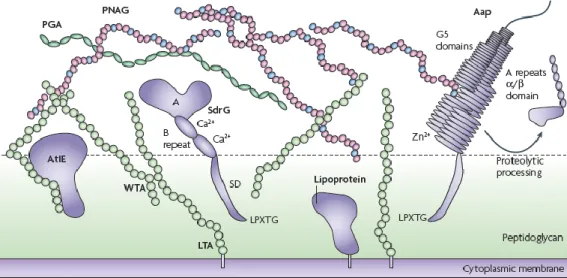
Staphylococci have multiple adherence factors known as microbial surface components recognizing adhesive matrix molecules (MASCRAMM) (Pei and Flock, 2001). The MSCRAMMs that have been found in most strains are SdrG, a fibrinogen-binding protein (Hartford et al., 2001), SdrF, a colagen-binding protein (Arrecubieta et al., 2007), and SdrH an elastin-binding protein (Arrecubieta et al., 2009). However, the most studied is SdrG, that has been described as important to promote S. epidermidis adhesion to fibrinogen-coated surfaces (Hartford et al., 2001). Recent studies demonstrated that SrdG is responsible, also, for promoting platelet adhesion and aggregation (Brennan et al., 2009). SdrF has also been demonstrated during ventricular assist device driveline-related infection (Arrecubieta et al., 2007)(Figure 1.2).
Figure 1.2 -The S. epidermidis cell surface (Adapted from Otto, 2009).
1.3.2 Biofilm Maturation
The biofilm maturation is achieved by adhesion proteins, eDNA, techoic acids and polysaccharides, allows the development of the typical three-dimensional structure of the biofilm (Rupp et al., 1999). S. epidermidis growing within a biofilm consists, at least, four metabolic states: aerobic growth, anaerobic growth, dormant cells and dead cells (Rani et al., 2007).
Introduction
Chapter 1 • 9
One specific operon that is consistentely upregulated within biofilm populations of S. epidermidis, in contrast to cells growing in planktonic form, is the arginine deiminase operon (ADI) (Beenken et al., 2004). This pathway is used to catabolize arginine under microaerobic or anaerobic conditions to generate ammonia and ATP (Abdelal, 1979) and under anoxic conditions arginine serve as carbon source (Makhlin et al., 2007). One study report that the generation of ATP through arginine catabolism is an important aspect for biofilm maturation (Diep et al., 2008). The pseudopeptide polymer PGA is very important and synthetized by the gene products of the cap locus which seems to be increased during the biofilm mode growth important (Chokr et al., 2007). PGA promotes growth function of S. epidermidis at high salt concentrations, in pathogenesis is only known this specie (Fluckiger et al., 2005) and contributes to osmotolerance which indicates a role for S. epidermidis colonization (Gerke et al., 1998).
The best studied mechanism of biofilm accumulation is related to the production of β1,6-poli-N-acetylglucosamine (PNAG) also referred as polysaccharide intercellular adhesion (PIA), which is produced by many S. epidermidis strains (Mack et al., 1996; Wang et al., 2004). The biosynthesis of PNAG is the result of the expression of the genes that constitutes intercellular adhesion (ica) locus, which compromises icaADBC operation and icaR gene (Knobloch et al., 2004) which encodes a regulatory protein (Wang et al., 2007). The icaADBC codifies icaA and icaD proteins (acetilglucosamine transferases) responsible by development chain activated of the N-acetilglucosamine monomers (GlcNAc) (Gerke et al., 1998). De-acetylation from activated N-acetylglucosamine (GlcNAc) monomers by the ica gene produces positive charges into the otherwise-neutral polymer which is necessary for surface binding of PNAG. GlcNAc is synthetized by the membrane-located activity (step 1, Figure 1.3a) (Conlon et al., 2004). The PNAG chain is exported by the icaC membrane protein (step 2, Figure 1.3a). Then, icaB de-acetylase, in cell surface, removes some of the N-acetyl groups giving a cationic character which is necessary for surface attachment (step 3, Figure 1.3a) (Conlon et al., 2004). icaC responsible for the elongation of monomers and subsequent transport to the bacterial surface (Gerke et al., 1998) and the icaB responsible for the partial de-acetylation process (Kristian et al., 2008). This process introduces a positive charge on the polysaccharide, which contributes to the connection of this surface and other biological functions involved in biofilm formation and evasion of the host immune system that will further discussed. The expression of icaADBC operon is regulated by the icaA promoter or through expression of icaR and both are controlled by a series of regulatory proteins such as SigB, SarA, SarZ, ClpP, tricarboxylic acid (TCA) cycle and luxS (Figure 1.3b) (Handke et al., 2007; Wang
Introduction
10 • Chapter 1
et al., 2007). Both SarA and SarZ are required for icaADBC transcription and subsequent PIA synthesis (Tormo et al., 2005; Wang et al., 2008). Cerca et al. (2008), demonstrated that in S. aureus, SarA and ∂B are required for icaR expression and icaR does not significantly affect its own
transcription.
Importantly, some studies demonstrated that PNAG is not essential for biofilm formation, since S. epidermidis strains lacking the ica gene can form biofilms and the surface proteins, Aap and Bap, may be additionally or exclusively responsible for biofilm formation (Rhode et al., 2005). Colonies that produce PNAG grow as crusty, irregular colonies whereas, PNAG-negative colonies are smooth and creamy (Freeman et al., 1989). Some ica-negative S. epidermidis strains seems to be mediated by Bap and accumulation associated protein (Aap), which requires proteolytic activation and zinc ions (Zn2+) (Conrady et al., 2008). Zn2+ is crucial for the modular association of
G5 tandem repeats that may underlie the formation of Aap based fibril-like structures on the bacterial surface (Figure 1.2) and, consequently, mediates the adherence to corneocytes implicating a further role in adherence to skin (Macintosh et al., 2009). Based in some studies, Aap is found approximately 90 % (Sun et al., 2005) and Bap between 15 % - 45 % (Rohde et al., 2007; Bowden et al., 2005) supporting the importance of their presence in biofilm formation.
Introduction
Chapter 1 • 11
In the detachment process, biofilm release cells in order to maintain the survival of community, promoting the spread of bacteria and leading to the formation of new sites of infection (Voung et al., 2003). Biofilms can be dispersed by many processes such as shedding of daughter cells from actively growing cells (Vuong et al., 2004), as a result of low nutrient level (survival mechanism) (Gross et al., 2001), quorum sensing (recognition of nearby cell density) or shearing of biofilm aggregates because of flow effects(Vuong et al., 2003). The mechanisms underlying the release of the cells are poorly understood but many factors can be involved such as mechanical, enzymatic degradation of exopolymers and the rupture of non-covalent interactions by surfactant molecules (phenol soluble modulins - PSM) or ∂-toxins (Otto, 2009).
Little is known regarding dispersal and detachment mechanisms, however, in both S. aureus and S. epidermidis this process is agr dependent (Boles and Horswill, 2008). A model has been proposed for S. aureus, which involves agr expression which exposes layers of biofilm promoting the detachment of cells clusters, controlling biofilm expansion (Otto et al., 2001). Likewise, in S. epidermidis agr activity is limited to the biofilm surface which indicates the existence of a common staphylococcal mechanism of QS-controlled biofilm detachment (Little and Lvins, 1999).
Based in one study, S. epidermidis agr mutants showed increased biofilm development and colonization in a rabbit model (Vuong et al., 2004). It is hypothesized that the increased biofilm thickness in agr mutants is due to the loss of ∂-toxin and other phenol-soluble modulins (Otto, 2009). These molecules act as surfactants that inhibit noncovalent interactions of bacteria at the surface of biofilm (Vuong et al., 2004). Detachment was related to increased protease activity in biofilm effluent and was related to increased expression of Aur metalloprotease and the SplABCDEF serine proteases. It is unclear what function these proteases may have in detachment of PNAG/ Aap-Bhp dependent biofilm in S. epidermidis (Boles and Horswill, 2008). Therefore, detachment is not just important for promoting genetic diversity, but also for escaping unfavorable habitats aiding in the development of new niches which, consequently, have a very important implication in patients with medical devices (Raad et al., 1992).
Introduction
12 • Chapter 1
1.4 The impact of biofilms in health
S. epidermidis can account for more than 90 % of the resident flora in humans. Despite its generally innocuous nature, in last 20 years emerged a frequent cause of nosocomial infections (Cogen et al., 2008). Up to 60 % of all nosocomial infections are caused by biofilms on medical devices (Donlan and Costerton, 2002). In United States of America, nosocomial infections are responsible for 1.7 million of infections and 99 thousand deaths per year (CDC, 2004). In Portugal, it his estimated than 10 % of all infections are hospital acquired (Pina et al., 2013). It is estimated that biofilms are involved in 65 % of all human infections (Lewis, 2007).
1.4.1 Biofilm infections in indwelling medical devices
The microbial infections associated to the biofilm formation are recognized as etiologic agents of many chronic and persistent infections (Costerton et al., 1999). Probably, due to the very slow growth in the biofilms, these infections are difficult to diagnose and treat with conventional approaches (Howden et al., 2010). With the increase of medical devices, the incidence of these infections also increased the incidence and prophylaxis and limiting the colonization of medical devices the simplest and effective measures to be taken (Rohde et al., 2007).
Medical devices (Figure 1.4) are made out of abiotic materials such as metals, polymers (silicone), but may also contain biological materials such as devitalized bone, blood vessels, muscle fascia from autologous (venous bypass), allogeneic (processed bone), or xenogeneic sources (porcine heart valve) (Darouiche, 2004; Zimmerli and Trampuz, 2011). Interestingly, neither synthetic nor devitalized biological devices are rejected by the body, despite the fact that host reacts to such implants in different ways depending upon the biocompatibility of the device. However, no implant is completely inert after implantation (Anderson et al., 2008; Zimmerli et al., 2004). There are two different type of devices that interact very differently with the host. Whereas, intravascular implants mainly interact with coagulation factors and circulating blood cells, extravascular implants interacting with surrounding tissue, interstitial fluid and attracted phagocytes (De Man et al., 2011). Permanent implants cannot be removed without compromising the replaced function. Therefore, the primary goal is to prevent implant failure due to mechanical reasons or infection (Zimmerli, 2006).
Introduction
Chapter 1 • 13
Biofilm infections occur in the hospital environment, especially in very young or old immunocompromised patients (Howden et al., 2010). These infections are usually associated with persistent and relapsing infections such as otitis media (Hall-Stoodley et al., 2006), native valve endocarditis (Martin-Davila et al., 2005), cystic fibrosis (Bjarnsholt et al., 2009), periodontitis and caries (Zjinge et al., 2010), chronic bacterial prostatitis (Mazzoli, 2010), tissue necrosis (Hall-Stoodley, 2008), catheter-related septicaemia and emboli with serious complications to the host (clumps of cells which also contain platelets or erythrocytes) (Costerton et al., 1999). Unfortunately, biomaterial associated infection compromises the quality of life, has a high morbidity and is even associated with mortality. In addition has a high economic impact, since treatment costs more than the primary implantation of the device (Batoni et al., 2010; Ketonis et al., 2010).
Figure 1.4 - Schematic model of phases involved in S. epidermidis biofilm formation on medical devices (Adapted from Heilmann and Götz, 2013).
1.4.2 Immune response and resistance for antibiotics
The most important clinical consequences related to biofilm infections is their higher resistance to antibiotic and to the host immune system (Otto, 2009). The host immune response is a structured system and involves several biological processes that protect the organism against diseases (O´Gara, 2007). It is divided into innate (primary barrier such as skin) and acquired
immunity (lymphocytes) as can see in Figure 1.5(Riken, 2013). S. epidermidis has to cope with
various mechanisms of host defense during the infection, such as antimicrobial peptides (AMPs), that are present in human skin, or phagocytes, among which neutrophils or polimorphonuclear leucocytes (PMNs) have a proeminent role(Knoblock et al., 2004; Sadyvok and Bayles, 2012).
Introduction
14 • Chapter 1
As mentioned above, PNAG, is involved in evasion of S. epidermidis biofilms to the immune system of the host (Wang et al., 2004). PNAG has positive a charge, which is rare in bacterium polysaccharides (Opperman-Sanio and Steinbuchel, 2002). This charge prevents the action of AMPs, also with positive charge, by electrostatic repulsions(Vuong et al., 2004). However, pattern recognition receptors present in bacterium surface by phagocytic cells difficult the binding between antibodies and proteic factors of the complement system (Cheung et al., 2010). Preventing the binding of these last two components of bacteria cell surface limits the process of opsonization and, consequently, phagocytosis of these bacteria by phagocytic cells(O´Gara, 2007).
Besides the protection that PNAG confers to the bacteria, it can also stimulates the production of pro-inflammatory cytokines such as interleukins (IL) 8 and IL-6 by activating toll-like receptor 2 (TLR2)(Cheung et al., 2010). The stimulation of the immune response by biofilms may seem a non-sense in respect of being hostile to pathogens. On the other hand, a continuing inflammatory response causes damage to the surrounding tissue promoting susceptibility to bacterial adhesion and thus biofilm development locations (Sadyvok and Bayles, 2012).
On the other hand, biofilms can be up 1.000 times more tolerant to antibiotics than equivalent planktonic cultures (Hoyle and Costerton, 1992; Mah and O´Tole, 2001). Resistant bacteria can occur during or after an antibiotic treatment (Beiji et al., 2004; Hurford et al., 2012). Whilst biofilm cells may employ a variety of mechanisms to resist the action of antimicrobial agents (Mah et al., 2003), studies have shown that a number of key factors contribute to reduced antimicrobial susceptibility of biofilms (Percival and Bowler, 2004). Several other agents with bactericidal and/or bacteriostatic effects, many of them available in a wide range of household products such as disinfectants, are responsible for resistant bacteria (Levy, 2000; McMurry et al., 1998).
In S. epidermidis, specific antibiotic resistance genes are widespread. In many countries, including United States, 75 % - 90 % of all hospital isolates of S. epidermidis are resistant to methicillin (Diekema et al., 2001). This resistance is encoded on mobile genetic elements (MGEs), known as the staphylococcal cassette chromosome mec (SCCmec) (Diep et al., 2008; Wisplinghoff et al., 2003). This cassette chromosome contains the mecA gene which encodes a penicillin-binding protein, PBP2a (Chambers et al., 1985). S. epidermidis has also acquired resistance also rifamycin, fluoroquinolones, gentamycin, tetracycline, chloramphenicol, erythromycin, clindamycin and sulphonamides (Rogers et al., 2009). Despite widespread resistance to methicillin and other
Introduction
Chapter 1 • 15
antibiotics, 80% of catheters infected with S. epidermidis can be still treated with antibiotics such as vancomycin and chitosan (Raad et al., 2007; Neoh and Kang, 2009). The frequency of antibiotic resistance reflects the overuse of antibiotics. Furthermore, the ubiquity of S. epidermidis as a human commensal microorganism renders this bacterium an optimal carrier and reservoir for antibiotic resistance genes (Miragaia et al., 2005).
Figure 1. 5 - Innate and Adaptative immunity (Adapted fromhttp://www.rikenresearch.riken.jp).
1.5 Biofilm gene expression
The biofilms can quickly adapt to new conditions, phenotypically, genetically and structurally, and changing internal and external conditions, consequently, can result in the resistance to many antibiotics or mechanisms of the host defense. These features provide an important advantages compared with their planktonic existence(Hoyle and Costerton, 1992). S. epidermidis has a substantial, genome-wide adaptation to the biofilm mode of growth, including downregulation of basic cell processes as nucleic acid, protein and cell wall biosynthesis(Sadyvok and Bayles, 2012). Therefore, it is very important to study the expression of genes and their influence or contribution in biofilm formation, to better understand the S. epidermidis virulence. Since biofilm formation is one of the major virulence factors for these strains (Table 1.1).
Introduction
16 • Chapter 1
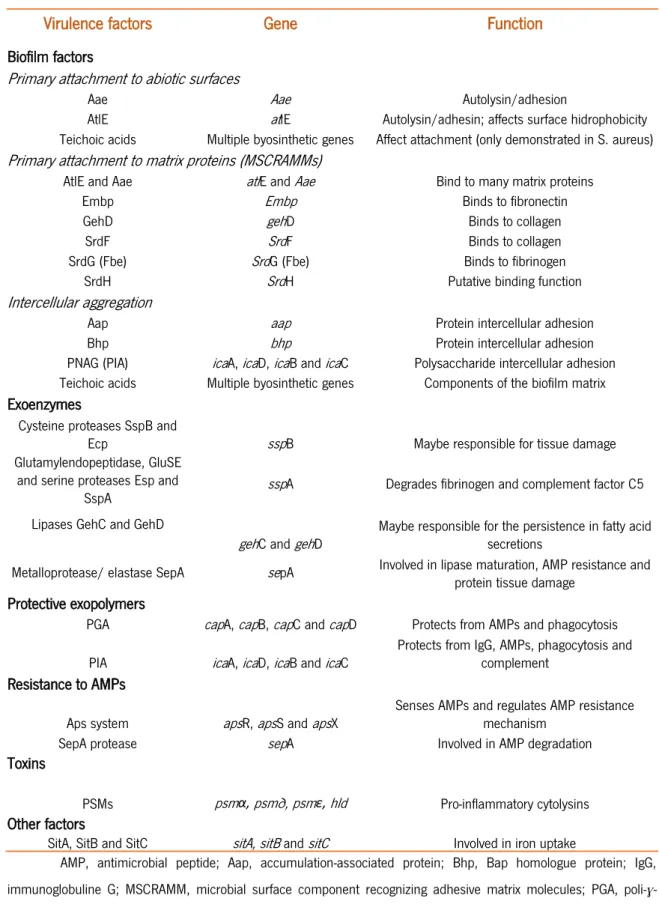
Table 1.1 - Main recognized virulence factors of S. epidermidis (Adapted from Otto Nat. Rev. Microbiol., 2009, 7(8): 555-67).
Virulence factors Gene Function
Biofilm factors
Primary attachment to abiotic surfaces
Aae Aae Autolysin/adhesion
AtlE atlE Autolysin/adhesin; affects surface hidrophobicity
Teichoic acids Multiple byosinthetic genes Affect attachment (only demonstrated in S. aureus)
Primary attachment to matrix proteins (MSCRAMMs)
AtlE and Aae atlE and Aae Bind to many matrix proteins
Embp Embp Binds to fibronectin
GehD gehD Binds to collagen
SrdF SrdF Binds to collagen
SrdG (Fbe) SrdG (Fbe) Binds to fibrinogen
SrdH SrdH Putative binding function
Intercellular aggregation
Aap aap Protein intercellular adhesion
Bhp bhp Protein intercellular adhesion
PNAG (PIA) icaA, icaD, icaB and icaC Polysaccharide intercellular adhesion Teichoic acids Multiple byosinthetic genes Components of the biofilm matrix Exoenzymes
Cysteine proteases SspB and
Ecp sspB Maybe responsible for tissue damage
Glutamylendopeptidase, GluSE and serine proteases Esp and
SspA sspA Degrades fibrinogen and complement factor C5
Lipases GehC and GehD
gehC and gehD Maybe responsible for the persistence in fatty acid secretions Metalloprotease/ elastase SepA sepA Involved in lipase maturation, AMP resistance and
protein tissue damage Protective exopolymers
PGA capA, capB, capC and capD Protects from AMPs and phagocytosis PIA icaA, icaD, icaB and icaC Protects from IgG, AMPs, phagocytosis and complement Resistance to AMPs
Aps system apsR, apsS and apsX Senses AMPs and regulates AMP resistance mechanism
SepA protease sepA Involved in AMP degradation
Toxins
PSMs psmα, psm∂, psmε, hld Pro-inflammatory cytolysins
Other factors
SitA, SitB and SitC sitA, sitB and sitC Involved in iron uptake
AMP, antimicrobial peptide; Aap, accumulation-associated protein; Bhp, Bap homologue protein; IgG, immunoglobuline G; MSCRAMM, microbial surface component recognizing adhesive matrix molecules; PGA, poli-ɣ-glutamic acid; PIA, polysaccharide intercellular adhesin; PSM, phenol soluble modulin.
Introduction
Chapter 1 • 17 1.5.1 Techniques used for gene expression determination
In common gene expression studies, there are three fundamental experimental steps before obtaining the final results: RNA extraction, reverse-transcriptase reaction and quantitative polymerase chain reaction (qPCR).
RNA extraction method consists in purify RNA from biological samples. The quality, purity and integrity are an important requirement for any RNA-based analysis (Bustin et al., 2005). The samples have intrinsic properties that can affect yield RNA with different quality (Nolan et al., 2006). Furthermore, the cell wall of gram-positive bacteria´s are constituted by a thicker layer of peptidoglycan compared with gram-negative bacteria´s and, consequently, it´s more difficult to obtain a good quantity and quality of RNA (França et al., 2012) because the lysis of bacterial cell and the high content of proteins and polysaccharides, major component of the biofilm matrix,
which is estimated to compromise about 90% of the total biofilm biomass(Flemming, 2010). Due
to his, the bacterial cell lysis and nucleic acid purification seems to be difficult in RNA extraction methods, as well as, the purified RNA which still contains inhibitory substances (Juntilla et al., 2009; Santiago-Vásquez, 2006).
Some studies showed that different RNA extraction methods can yield RNA with distinct quality and this can be explained by the complexity of biological samples (França et al., 2011;
Schowchow et al., 2012; Shulman et al., 2012). So the type of extraction method to choose is
crucial: enzymatic, chemical and/or mechanical. For this case in specific, S. epidermidis, the best kits are based on organic extraction and a mechanical lysis step results in a higher yields. However the RNA yield and RNA purity were not a relationship directly in stability of gene expression (França et al., 2011; Sieber et al., 2010). Carvalhais et al. (2013), have recently shown that the indicators of quality did not correlate, ever, with an authentic gene expression quantification which has high relevance since the indicators that guarantee RNA quality may not to be enough to determine the authenticity of bacterial gene expression. Nonetheless, the purity and integrity can impact the accuracy of processing or analytical techniques such as complementary DNA (cDNA) synthesis and quantitative real-time PCR (Bustin et al., 2005; Nolan et al., 2006).
The quantification of mRNA has proved to be a useful tool to validate the transcriptional measurements associated with switching to the pathogenic mode of infection (Yao et al., 2005; Beenken et al., 2004; Li et al., 2008; Zhu et al., 2010). Due to the low half-cycle of RNA molecules, a strategy commonly used to quantify the amount of messenger RNA (mRNA) is to
Introduction
18 • Chapter 1
convert those molecules in complementary cDNA. This is achieved by the reverse transcriptase polymerase chain reaction (RT-PCR)(França et al., 2012). Some reports indicated that reverse transcription reaction is very important since during the optimization of cDNA synthesis with commercial kits and revealed high variability in the results by some of the kits tested (França et al., 2012; Sieber et al., 2010). Besides of that, is necessary more studies to a better understand the implication of this step.
The qPCR technique has been widely used in gene expression experiments due to its high sensitivity allowing the accurate quantification of very small amount of starting material. This method is used to amplify and quantify a targeted DNA molecule by fluorescence detection (Didenko et al., 2006). The quantification can be absolute or relative: absolute quantification when the objective is to determine the exact number of copies of mRNA molecules present in the sample and relative quantification expresses the results, not as an absolute amount, but as n fold change on expression values (Raajevan et al., 2001; Fang and Cui, 2011).
Sieber et al. (2010), also reported there is some variability associated with the qPCR kit used. However, what is not known is how the different experimental steps, influence the observed gene expression variability.
1.6 Study objective
The main goal of this work was to demonstrate and understand the influence in the variability of gene expression quantification, by the individual experimental steps required for gene expression quantification, namely bacterial growth, RNA extraction, reverse transcriptase and real-time quantitative PCR. Additionally, we proposed an optimized protocol to enhance gene expression reproducibility in S. epidermidis biofilms.
CHAPTER 2
Genetic expression variability
Genetic expression variability
Chapter 2• 21
2.1 Introduction
Transcriptional measurements are often used to study S. epidermidis virulence (Batzilla et al., 2006; Dai et al., 2012; Fluckiger et al., 2005; Handke et al., 2004).
The RNA must have high quality for downstream applications like qPCR (Nolan et al., 2006). Normal quality parameters include purity, integrity and yield of RNA (Fleige and Pfaffl, 2006) and, according MIQE guidelines, RNA should be pure, presents high integrity and sufficient quantity (Bustin et al., 2009). All these parameters can influence gene expression. As mentioned before (in Chapter I), different RNA extraction methods (Atshan et al., 2011; França et al., 2011; Pinto et al., 2009) as well as the complexity of biofilm matrix can yield distinct RNA quality (Radstrom et al., 2004; Tichopad et al., 2004). França et al. (2012) demonstrated that RNA quality indicators did not, ever, correlate with a reliable gene expression quantification. Furthermore, RNA isolation procedure such as ethanol or phenol may inhibit the PCR process (Bar et al., 2012; Wilson, 1997). Sieber et al. (2010) reported that when low concentration of RNA is used, the variability in gene expression is higher. Furthermore, gene expression can also be influenced by other factors, such as contaminants or loss of RNA integrity (Carvalhais et al. (2013)). However, what is not known, so far, is the intrinsic contribution, by each individual experimental procedure, to the observed variation in gene expression studies.
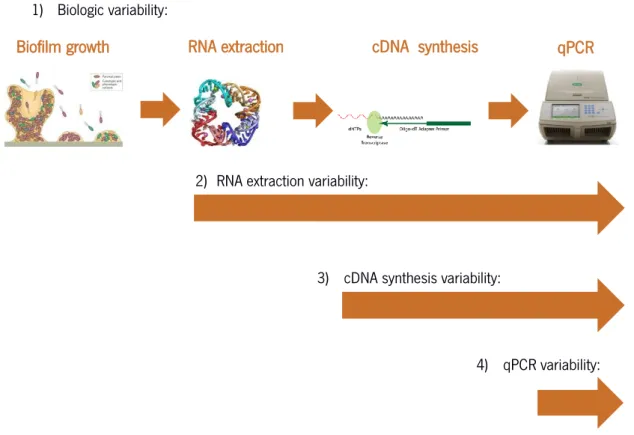
The main objective of the work described in this chapter was to understand the origin of variability in gene expression studies, in S. epidermidis biofilms. To achieve that, we designed an experimental protocol that would allow us to determine the individual contributions of each of the proposed experimental steps, to the final observed variability, namely the biological variability, from one biofilm to another, the variability from different RNA extraction procedures, the variability from different reverse transcriptase reactions and finally, the variability of the qPCR quantification (Figure 2.1). The genes selected for this study have different functions in the physiology of S. epidermidis: aap gene is involved in biofilm accumulation and icaA gene is involved in biofilm maturation (Vandecasteele et al, 2003); pgi gene is involved in glycolysis (Gill et al., 2005); lrgB gene is thought to be involved in induced cell death, lysis and stress environment response (Sadyvok and Bayles, 2012) and fmtC gene is involved in the resistance to antimicrobial peptides (Bao et al, 2012) and mechanism of the host´s immune system.
Genetic expression variability
22 • Chapter 2
1) Biologic variability:
2) RNA extraction variability:
3) cDNA synthesis variability:
4) qPCR variability:
Figure 2.1 - Scheme representation of the experimental design aiming to determine the source of gene expression variability.
2.2 Materials and Methods
2.2.1 Bacterial strain and growth conditions
One well-known biofilm-forming strain was used in this study: S. epidermidis RP62A (PubMed accession number: PRJNA57663, ID: 57663) was replicated in petri plates (Frilabo) with Tryptic Soy Agar (TSA, Liofilchem) and were incubated for 48 H at 37º C. For the biofilm assays, two growth media were prepared: Tryptic Soy Broth (TSB, 30 g/L – Oxoid) and TSBG (TSB supplemented with 1% (w/v) of glucose).
2.2.2 Biofilm formation assays
A pre-inoculum was prepared, in plastic tubes of 10 mL (Frilabo), containing 2 mL of TSB.
A fresh TSA plate with S. epidermidis was used as inoculum. The strain was grown overnight at
Genetic expression variability
Chapter 2• 23
37ºC with 120 rpm in a shaker-incubator (N-Biotek, NB-205Q). Then, the culture was dilute in TSBG to adjust the O.D. between 0.25-0.30 by spectrophometer reading (Spectronic® 20 Genesis,
Spectronic Instruments) with 640 nm filter. After adjusted, 15 µL of the diluted suspension was placed in a 24-well plate (Thermo Scientific) with 1 mL of TSBG and incubated with same conditions for 24 H. The spent media was removed of the 24-well plates and biofilms were washed and resuspended in 1 mL of 0.9 % (w/v) Sodium Chloride (NaCl), to remove planktonic bacteria. The resuspended biofilm (dislodged by scraping) was then transfer to a 1.5 mL RNAse and DNAse free eppendorf tube (Bioplastics, Frilabo).
2.2.3 Customized RNA extraction protocol
The protocol described here combines mechanical and chemical lysis along with silica-membrane RNA isolation (E.Z.N.A.TM Total RNA, VWR, Omega Bio-Tek). Briefly, it consists in
suspend bacterial pellet in 500 µL of TRK lysis buffer provided by the kit (supplemented with β-mercaptoethanol, Sigma) plus 500 µL of phenol (AppliChem, Frilabo) after centrifuged at
maximum speed for 10 minutes in Centrifuge5415R (eppendorf) and transferred into a 2 mL safe
lock tubes with 0.5 g of glass beads (150-212 µm, MP Biomedicals, IIIKrich, France). This mixture was vortexed (Vortex V-1 Plus, Biosan, Frilabo) for 20 seconds before using the FastPrep® Cell
disruptor (BIO 101, ThermoElectron Corporation, Thermo Scientific) with setting 6.5 and 35 seconds. The samples were then cooled on ice for 5 minutes and the beat-beading step repeated twice. Afterwards, samples were centrifuged (Centrifuge ScanSpeed mini blue, Labogene) at 12,000 g for 2 minutes and supernatants transferred 700 µL into a 2 mL DNAse/RNAse free tube (Bioplastics) and added equal volume of 70 % ethanol (Fisher Scientific). The samples, 700 µL, were transferred to the RNA isolation column (including any precipitate) and centrifuged (Centrifuge ScanSpeed mini blue, Labogene) at 12,000 g for 30 seconds at room temperature (RT). The flow-through was discarded and each column was reinserted into a new collection tube. To wash the columns, 500 µL of wash buffer I (provided by the kit) was added to each column and centrifuged (Centrifuge ScanSpeed mini blue, Labogene) at 10,000 g for 30 seconds at RT. The flow-through was discarded and the same collection tube was used. After that, 500 µL of was buffer II (provided by the kit) was added to each column and centrifuged (Centrifuge ScanSpeed mini blue, Labogene) at 10,000 g for 30 seconds at RT. The flow-through was discarded. This step was repeated one more time but either the flow-through as collection tube were discarded. Then, was reinserted into
Genetic expression variability
24 • Chapter 2
a new collection tube and centrifuged (Centrifuge ScanSpeed mini blue, Labogene) at 16,000 g for 3 minutes to remove any trace of the wash buffer II that contains ethanol that is known to influence downstream applications and the columns are transferred to a 1.5 mL DNAse/RNAse free tube (Bioplastics, Frilabo). Finally, RNA elution was achieved by adding 50 µL of DEPC-treated water (provided by the kit) to the center of the membrane and centrifuged at 10,000 g for 1 minute.
2.2.4 DNAse Treatment
5 µL of DNase I reaction buffer (Fermentas, Frilabo) and 2 µL of DNase I (Fermentas, Frilabo) were added to 45 µL of the RNA samples, mixed thoroughly by pipetting up and down, and incubated at 37ºC for 30 minutes in a thermal block (Alfagene). Then 5 µL of 25 mM EDTA (Fermentas, Frilabo) was added to the mixtures, mixed by pipetting up and down, and incubated at 65ºC for 10 minutes, in a thermal block (Alfagene), to inactivate the DNase I enzyme (Fermentas, Frilabo).
2.2.5 RNA Quality Determination
The concentration and purity of the RNA sample was determined with a NanoDrop 1000TM
(Thermo Scientific). The purity was achieved based in two absorbance ratios: the absorbance ratio A260/A280 is an indicator of protein contamination and the absorbance ratio A260/A230 is an indicator of
polysaccharide, phenol and/or chaotropic salt contamination (Tavares et al, 2011). High quality RNA has both ratios higher than 1.8 (Glasel, 1995). Two independent measurements of each same sample were performed and average. The integrity of the total RNA was assessed by visualization of the 23S/16S banding pattern. RNA samples were analyzed in 1.0 % agarose gel stained with Midori Green DNA (Nippon Genetics Europe GmbH, Germany) at 90V. RNA was stored at -80ºC until further use.
2.2.6 cDNA synthesis
The commercial kit used was RevertAaidTM First Strand cDNA Synthesis Kit (Fermentas,
Frilabo) and the total RNA was normalized to a 100 µg/µL. The reverse transcriptase reaction was performed accordingly to manufacturer instructions, with small modifications with a final volume of 10 µL, as optimized before (França et al., 2012). Briefly, in one 0.2 mL DNAse/RNAse free tube
Genetic expression variability
Chapter 2• 25
(Bioplastics, Frilabo) was added the respective quantity of water, 1 µL random primers (NZYtech, VWR) and RNA in order to obtain a final volume of 10 µL. Then, were heated at 65ºC for 5 minutes, in a heat block (Alfagene) and then placed on ice for 5 minutes. This heat-cool process is advisable for RNA templates GC-rich or that contains secondary structures. In a 0.2 mL DNAse/RNAse free tube (Bioplastics, Frilabo), 5 µL of the prepared RNA was added to the 2 µL of buffer (Thermo Scientific, Frilabo), 1 µL of dNTPs (Thermo Scientific, Frilabo), 0.75 µL of reverse transcriptase (Thermo Scientific, Frilabo), 0.25 µL of Ribolock (RNAse inhibitor, Thermo Scientific, Frilabo) and 1 µL of water nuclease free (Thermo Scientific, Frilabo) for each gene. In another tubes 5 µL was added of the previously prepared RNA samples to 5 µL of water (Reverse Transcriptase minus Negative control - NRT). NRT is used to determine the possibility of genomic DNA carry-over with absence of reverse transcriptase enzyme. PCR amplifications were performed using thermal cycler (MJ MiniTM Personal Thermal Cycler, Bio-rad). The following cycle for thermal
cycle were 25ºC during 5 minutes, 42ºC during 60 minutes, 70ºC during 10 minutes and 4ºC forever. Primers efficiencies were determined by the dilution method.
2.2.7 Gene expression quantification
Biofilm gene expression was determined by qPCR. qPCR analysis was performed using mix iQTM SYBR Green Supermix (Bio-Rad) in a 10 µL reaction volume. Each reaction contained 2 µL of
the diluted cDNA or no-RT control (400 fold dilution of the resulting cDNA template in DEPC-treated water), 5 µL of master mix, 1 µL of primer mixture (10 µM of each forward and reverse primers) and 2 µL of nuclease-free water as described before (França et al., 2012). Information about de primers used are listed in Table 2.1.
qPCR run was performed on a CFX 96 (Bio-Rad) with the following cycle: 95ºC for 30 seconds, 39 cycles of 95ºC for 5 seconds, 60ºC for 15 seconds, 68ºC for 15 seconds and the products were analyzed by melting curves for unspecific products or primer dimer formation. qPCR products were analyzed by melting curves to confirm that if the desired product was only amplified and all reactions were run in triplicate with two controls namely no-template control (NTC), which is composed by 5 µL of mix and 5 µL of nuclease-free water, for each set primer and NRT as mentioned above were included in each run. The expression of aap, icaA, pgi, lrgB and fmtC were normalized to the expression of the housekeeping gene 16S rRNA and was performed by the Livak
Genetic expression variability
26 • Chapter 2
method and the gene expression quantification was calculated by: CT= CT (housekeeping gene) – CT (target gene) (Livak and Schmittgen, 2001).
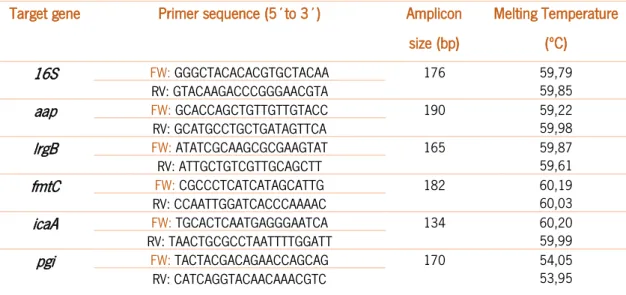
Table 2.1 - Primers, amplicons, functions and melting temperature for the primers used in this study.
Target gene Primer sequence (5´to 3´) Amplicon
size (bp) Melting Temperature (ºC) 16S FW: GGGCTACACACGTGCTACAA 176 59,79 59,85 RV: GTACAAGACCCGGGAACGTA aap FW: GCACCAGCTGTTGTTGTACC 190 59,22 59,98 RV: GCATGCCTGCTGATAGTTCA lrgB FW: ATATCGCAAGCGCGAAGTAT 165 59,87 59,61 RV: ATTGCTGTCGTTGCAGCTT fmtC FW: CGCCCTCATCATAGCATTG 182 60,19 60,03 RV: CCAATTGGATCACCCAAAAC icaA FW: TGCACTCAATGAGGGAATCA 134 60,20 59,99 RV: TAACTGCGCCTAATTTTGGATT pgi FW: TACTACGACAGAACCAGCAG 170 54,05 53,95 RV: CATCAGGTACAACAAACGTC
Bp, base pairs; FW, forward; RV, reverse.
2.3 Results and Discussion
Gene expression in S: epidermidis biofilm samples has been shown to have a high variability, that can be related to the experimental protocol, as discussed in the introduction of this chapter. Here, we aimed to determine that intrinsic variability of each of the experimental steps required to quantify the expression of five independent genes.
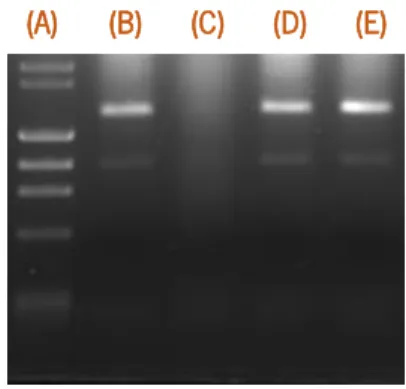
First of all, we determined the integrity of RNA samples and eliminate all that shown significant loss of integrity (such as sample B, in figure 2.2). Then, we determined the efficiency of each primer set. The efficiency was determined at different temperatures, ranging from 50ºC to 65ºC. The best possible combination of efficiencies was obtained at 60ºC (Table 2.2). Furthermore, in all our experiments, all RNA samples extracted were absent of significant genomic DNA, as determined by an average cycle threshold difference of 18 ± 3 which indicates a maximum error of 0.0003 %.
Genetic expression variability
Chapter 2• 27
Figure 2.2 – Example of integrity of RNA samples of RP62A: (A) DNA marker, (B to E) independent RNA samples.
Table 2.2 - Efficiency of five genes studied.
Genes 16S aap lrgB fmtC icaA pgi
Efficiency (%) 92,5 95,2 90 97,8 90 85
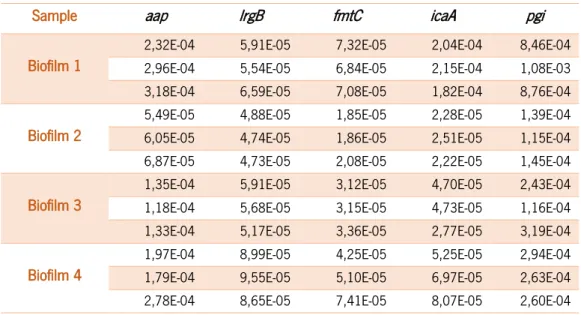
Since external factors can interfere in gene expression measurements, all experimental conditions were strictly maintained, namely the composition of growth medium, agitation, temperature and time of incubation, as well as the material of the 24-well plates. We started by determining the biologic variability observed in four independent 24 H biofilms. Each biofilm was formed in a different day and the RNA was extracted and stored at -80ºC until further use. The reverse transcriptase and qPCR reactions were done simultaneously. Table 2.3 represents the gene expression determination for each individual qPCR run.
As it can be observed, in table 2.3, gene expression variability was dependent of the tested gene. Therefore, we calculated the coefficient of variability obtained for each gene. As can be seen in Figure 2.3, gene variability ranged from 27 % (lrgB) to 88 % (icaA). The overall gene expression variability, as determined by the average of the five tested genes variability, was 61 ± 26 %.
Interestingly, the genes that presented higher variability were icaA and pgi, both related to the carbon metabolism and subsequent biofilm formation (Cerca, 2012). The use of glucose is often considered fundamental for biofilm formation (Holá et al., 2006); however, excess glucose will induce the medium acidification (Cerca et al., 2011) and this may interfere with the stability of mRNA.
Genetic expression variability
28 • Chapter 2
Table 2.3 – Quantification of gene expression normalized to 16S, using four independent biofilms.
Sample aap lrgB fmtC icaA pgi
Biofilm 1
2,32E-04 5,91E-05 7,32E-05 2,04E-04 8,46E-04 2,96E-04 5,54E-05 6,84E-05 2,15E-04 1,08E-03 3,18E-04 6,59E-05 7,08E-05 1,82E-04 8,76E-04
Biofilm 2
5,49E-05 4,88E-05 1,85E-05 2,28E-05 1,39E-04 6,05E-05 4,74E-05 1,86E-05 2,51E-05 1,15E-04 6,87E-05 4,73E-05 2,08E-05 2,22E-05 1,45E-04
Biofilm 3
1,35E-04 5,91E-05 3,12E-05 4,70E-05 2,43E-04 1,18E-04 5,68E-05 3,15E-05 4,73E-05 1,16E-04 1,33E-04 5,17E-05 3,36E-05 2,77E-05 3,19E-04
Biofilm 4
1,97E-04 8,99E-05 4,25E-05 5,25E-05 2,94E-04 1,79E-04 9,55E-05 5,10E-05 6,97E-05 2,63E-04 2,78E-04 8,65E-05 7,41E-05 8,07E-05 2,60E-04
Figure 2.3 - Coefficient of biological variability (in %) of gene expression of aap, lrgB, fmtC, icaA, pgi.
After assessing the variability associated with independent biological replicates, we proceeded with the next stage of our experimental design. In order to determine the intrinsic variability obtained from the RNA extraction procedure, we performed four different RNA extractions, from the same biological sample, randomly selected from our pool of biofilms. Table 2.4 represents the gene expression found, originated from independent RNA extractions within the same biological sample, therefore eliminating the biological variability.