Texto para Discussão
Número 45
BRAZIL: INTERNATIONAL TRADE
OPP
ORTUNITIES AMONG ECONOMIC
REGIONAL BLOCS
VERA THORSTENSEN ERNESTO LOZARDO
MAIO 95
BRAZIL
: INTERNATIONAL TRADE
OPPORTUNITIES AMONG
ECONOMIC
REGIONAL BLOCS
Emuto Lourdo
BRAZIL: INTERNATIONAL TRADE OPPORTUNITIES AMONG
ECONOMIC REGIONAL BLOCS
I. INTRODUCTION 1
11.
NEW CHARACTERISTICS OF INTERNATIONAI. TRADE 7111.
CURRENT SITUATION OF INTERNATIONAl TRADE 11 IV. BRAZIL'S RELATIONSHIP WITH REGIONAl TRADING BLOCS 13v
.
CURRENT POLICY TOWARDS INTERNATIONAl TRADE 37 Vl. INTERNATIONAl TRADE OPPORTUNITIES OPEN TO BRAZIL 40VIl. CONCLUSIONS 51
I -INTRODUCTION
The Brazilian economy is rtON facing a maíOf challenge. The decisions made and lhe aclions taken rtON by Brazillan policy makers will
de<:icle
lhe future economi<: and political importanee of Brazil. lf lhey ChooSe correctly, Brazil will experience slable growth, balanc:ed developmtnt throughout lhe country, better income dislribution, and a more oompetitive eoonomy. The real challenge to Brazilian policy makers is to implement lhe necessary c:hanges quid<ly so lhat lhey can be effective in a business envirorvrenl lhat is dlanging swiftly and beooming more intemationally orienled. Mvltinational corpo~ations inc:reasingly dominale lhe global ecot oomy through lheir fitl81ldal and investment dec:isions. The formation of global mat1<ets and regional ltading blocs tiYoughou! lhe W0<1d is another maíOf lrend. By lhe end of lhis century, lhese blocs will have formed , _ intemational economic and lreding relations, establishing new global lrede patterns and, consequently, a new global baanc:e ofpower.
Nly nation
not
already enmeshed in this netwotk of financiai and ttading relations and political power will simply not be part of lhe global d!ICision-making proc:ess, and will suffer lhe consequenc:es.The term globallzation is widely, but imprecistly, used. 1t is not ctear whether globalization refers to a macroeconomlc phenomenon or is an extension of the theory of the firm. In some cases, globallzatlon refers to a stage oi development, and in olhers to a sequence of stages. Where globalization is more conc:emed with lhe firm, much of lhe use of the termlnology ls concemed with differentiating the globalized firm from lhe multinational. lt ls not ctear whether lhe global firm grew out of the multinational flrm or how l was achieved duríng lhe last decades. However, ali lhe relevant evidence related to globalization issues suggests that there has been en irreverslble shift In lhe global structure of many industrial sectors, such as lextlle, automobile, footwear, end olhers. In spite of lhe lack of precision in defining globalization, we perceive lhat lhe stimuli for global mar1<ets resun trom lhe nature and the stability of lhe international political-economic agreements reached among leading nations. Without carefully enforced international agreements and sustained intemational peace among lhe major nations, global mat1<ets cannot function for long. That global mar1<ets are emerging in different parts of lhe WOtkl reflects lhe stability of these international agreements. We believe lhat tlle international balance of power agreernents made duríng lhis century aided the formation of global mar1<ets, as well as shaped lhe structures of global firms.
F&w c:ountries in the WOtld are imm.ne to global compet"ion. In lhis
context.
globalizalion is aproceS$ of
stages by whích internai or externai firm struáures are reshaped in such a way that their individual advantages anel disadvantages become part of lhe global firms· strategies.lt is impossible for Brazil to grow if it ignores lhe size. structure anel strategies of global firms. which are based on the stimuli of the global markets mentioned above. Brazilian policy makers, responsible for the c:ountry's social anel economic developman~ cannot over100k lhe interests lha! intemational firms have in lhe c:ountry's attitudes towards anel willingness to pc-ovide: open trade, qualified labor, technologically advanced manufacturing, ec:ological protection, intra-i.Wstry trade pref«ences anel concessions, a mature dernoaatic system, anel more favorable eOOf oomic rules anel laws favoring the flows of foreign capital etc.
The formation of global markets is not merely an academlc proposition; it is a matter ot vital concem for the politícal anel economic survival of many emerging c:ountries in lhe westem hemisphere. Stimuli from global markets causes lhe formation of regional markets, and lhe eventual success or failure ot these markets. The speed anel strength with which lhe various components of global markets are converging to consolidate regional economias, trading agreements anel pc-eferences, can be frightenlng to policy makers anel
economic
agents in emorging countries such ao Bnozil. This new approac11 to trade ls forcing most c:oootries with similar wttural anel ltthical values to strengthen their political alliances in order to sustain their marl<et atliances anel to protect their industrial anel technological deve~ts. The alliance of trading partners influences intemational politlcal power balances. From the begiming of lhe next cent\Jry, a c:ountry's trade partners, by creating regional treding egreements and preferences. will determine its pattem of economic growth anel thus its social welfare anel development. This decade will be criticai for Brazil: the alliances it makes with its chosen trading partners will determine its pattem ot economic growth, anel thus its social welfare anel developmenlUntil lhe 1980s, Brazll was able to sustain its trade policy by div«sifYing exports without establishing long-term partnerships that COUid hefp stre< lg!hei o "" intemational trade position. lnt«national cou omeo ca was important only in so lar as it COUid impc-ove the balance of payments anel not because of lhe intematíonal relalions that c:ould be forged with trading partners. Nowadays, regional trading partners are becoming more important than ever before. Brazil is aware of lhe n&w intematíonal economlc order and of relatíons among the leading nations. Because of these changes, Brazil has started to create its
own
economic regional bloc with íts South American neighbors - Argentina, Unuguay anel Paraguay - to form lhe MERCOSUL, Mercado Comum do Sul. The agreement was signed in 1991 anel MERCOSUL began to operate freely in January 1995.In 1990, the USA launched NAFTA, a free trade agreement among USA. Canada and Mexico. NAFTA started functioning in 1994. At the beginning oi
this decade, the North American govemment p<esented a broad proposallor lhe
creation oi a lree trade zone among lhe countries of lhe Americas, the "lnijiative for lhe Americas•, which aims at lhe economic integration of the hemisphere, from Alaska to Patagonia. This initiative was politically confirmed at the Miami
Summit in December 1994.
During 1990, the two Germanies, East and West, were reunited after the collapse of the Soviet Bloc. Since then, the dimate of the European economy has undergone great changes with the creation oi the EEA, European Economic
Area, a quasi-common market among lhe countries that constMe the EFTA,
European Free Trade Assodation, a.nd the EC, European Community. Europe· s most recent innovation is the European Union, which is planned to become a cornmon market with lree circulation of goods, people, services and capital. At
the present time. different EU members have conflicting ideas abOut the
development of the EU. England sees the EU as a confederation of nations
which will permit lhe free circulation
ot
goods, people, trade and services, but it does not see ij as a monetary union. England believes lhat lhe EU shouldbeccme stronger by coordinating toreign trade and foreign policies and issues
pertinent to lhe region's military delence. 1t also prefers to enlarge the EU by
admitting some East European countries, Poland, Hungary and the Baltic
countries. England' s proposals have reeeived support from most of the small
EU countries. England wants to reduce Germany·s hegemony in the region.
On lhe other hand, Germany and F rance have quije dilferent ideas oi whether to
enlarge or deepen lhe EU. The Gennans'concept of the EU is based on lhe
appreciation of different countries · development and encouragment of short term
economic growth within lhe European Community. German leaders see Europe
organized to include p<osperous and economically backward regions, forming
different inter-European regional blocs. In some way, German's fluctuating
between broadening politic and economic ties with some european countries,
and deepening lhese teis wijh chosen countries according their stage of
economic growth. France prelers to deepen lhe integration of the European Community in order to tie Germany cfoser to European political and economic
decisions. France wants to consolidate the European Community instead of
enlarging it, thus losing political and economic strength with respect to other
ernerging prosperous European countries. In lhe short run, if the EU members
cannot reach agreement on a concrete plan for further consolidation, the union
will only function only to produce collective political decisions, ralher lhan act as members joined in a monetary union.
The USA is fast moving towards lhe lormation of its
own
free trade zone. The"lnitiative for lhe Americas• is an important stratagy for the region·s economic
development and should have signíficant, positive effects on the economy. In
addition, the US has been trying to tighten its commercial links with developing Pacific Basin countríes through the creation of APEC - Asian Pacific Economic Cooperation. This initiative was confirmed at the Jakarta Summmít in 1994. APEC was formed because the countries ínvolved
saw
the need for better coordínation of investments and the technological and trade flows that are increasing in countries like Japan, NICs, ASIAN and China. Therefore, the EU cannot ignore the steps that the USA has taken towards enlarging its trading and technofogical interests around the globe, particularly in Latín Ameríca.The countries that constitute the MERCOSUL have responded to the USA's •1nitiative for the Americas• by proposíng the creation of SAFTA-South American Free Trade Alea-which, in its initial outline, is a trading zone withoot barríers composed of ali Sooth American countries. Thís
new
free trade zone aims at consolidating South Amerícan countries' economic and political power so that they will have more bargaining power when negotíating with NAFTA. In this respect, MERCOSUL will profit from any concreta trade negotiation with lhe EU, since thís would strengthen their negotiating position with the common market. MERCOSUL has few trade advantages with the EU when comparted to NAFTA markets.These propositions of creating regional economic blocs, not yet well orchestrated, íntend to promote more trade, ramping oommercial preferences, and increase the intemational política! and economic leverage of emerging nations with the developed oommercial wortd. There has been some dispute among Latin American countries trying to establish theír correct ranking in global trading relationships. For example, Algentína has clear1y made an independent move towards NAFTA. Argentina has tried, by any means possíble, to make an alliance with the USA, thus becomíng pari of NAFTA, regardless of MERCOSUL foreign policies towards NAFTA. So
tar,
its efforts have been in vain; the USA has instead invited Chile to join NAFTA. lt is interestíng to note that, although Chile is not a member of the MERCOSUL, ít has shown an increasing interest in joining this common market. lt seems that Chile's intematíonal trade policies reflect clear1y our argument that MERCOSUL countríes should consider joining NAFTA to gain stronger presenca in intemational and EU markets, thus eventually gaining intemational competitiva trade advantages.These issues will be examined in our paper. lt is irrelevant whether or not Brazil and MERCOSUL are labled "small global traders". The important point for these countries is that increasing ties with NAFTA' s economic, financiai and commercial markets, as well as its technological development, should be pari of the main strategy for MERCOSUL regional economic and political development. Trade with the EU could be a mere tactical step towards the globalization of the regional competitíve opportunitíes. There are markets, such as China, Asia and Japan, and others, that Brazil's intemational trade policies should be targeted to
explore eventually marl<et niches. We will develop most of these issues in parts IV, V, and VI.
In this article, we raise some global and domestic questions about lhe trade options and opportunities that will face lhe Brazilian economy in lhe last years of this century. Should Brazil concentrate ali its efforts on lhe development of lhe MERCOSUL, which is a new experience in 'deep integration,' or should it promote its econorny as a 'small global trader", without strong political and trade ties in lhe South American continent? Since Brazil is lhe major player in lhe MERCOSUL, it must influence its final decision as to whether this small cornmunity of developing countries should lead lhe creation of lhe SAFT A, a process of'shallow integration', aiming ata free trade zone in Soulh America. Should MERCOSUL try to establish a free trade agreement wilh lhe European Union, or should these Latin American countries negotiate only commercial agreements wi1h Europe, even though their commercial advantages are very limited , given lhe cornmercial restrictions that lhe EU is imposing on foreign trade in lhe area? Should Brazil reverse the trend of its foreign policies to aid lhe USA in promoting lhe process of hemispheric integration including NAFTA? We can certainly argue that, until lhe beginning of this decade, Brazil did not give much importance to foreign trade as a crucial part of its development. Commerical barriers and dornestic marl<et protection frorn international competition were part of lhe govemment policy to isolate lhe country frorn lhe rest of lhe wortd. Can Brazil still prornote social and econornic development if it remains a nation isolated from global and regíonal marl<ets? ls it possible to indicate which regional marl<ets should be considered of long-term, and which of short-term importance to lhe country's foreign trade policies? Our study intends to shed some light on these questions, a light that is greatly needed. Brazil's present policies are ambiguous, although lhe country seems to see ~se~ and to function as a 'small global trader". We do not believe that Brazil has to confine its foreign policies to those of a small global trader, a peripheral country. On lhe contrary, lhe nation must face the new options and opportunities available to lhe traders in new global marl<ets. 11 must be an actor in
new
political and trade alliances with regional marl<ets that can promote, provide and sustain ~s social and econornic devetopment. Only if Brazil develops links with other marl<ets can it receive lhe transfers of capital, technologies and management knowledge of large scale production that are necessary to respond to global marl<ets' demands for quality goods. We foresee that, if Brazil's foreign policy makers do not implement policies which promote industrial devetopment by tightening political and trade alliances within lhe Americas' hemisphere, global firms will have lhe economic and política I power to stunt Brazil' s econornic, and thus its social development.11- NEW CHARACTERISTICS OF INTERNATIONAL TRADE
In lhe las! fi!!W years, lhe intemational ecouomy has undergone a deep transfonnation.
An
ll'lderslanding of some oi lhe charac:leristicsot lhe c:urrent
wOf1d Oróer is necessaoy to sucx:esstully anatyze lhe dift'erant policies which Btazil could P16stJe in entenng lhe intemational arena.Some
of !hem will be briefly presented showing wtlic:h are lhemost
stable opportUnies for Btazilian foreign trede growth.Change from a blpolar model to a multlpolar modet
The first new charactenstle of lhe rurrent global situation is lhe
shifl
trorn abi
potar
model to a mullipolar model. The bipotar modet that prevailed in previous decades, led by lhe Uníted States anel lheSolliet
Union, collapsed with lhe Bertin Wall. Anothet modet is takingavar:
lhe muhipolar modet with lhe EU (European Union), USA.Japan
,
Russia and China leading lhe new wOf1d order. In lhe new econcmic order, thegreat
powers - EU, USA and Japa~ also compete to be lhe leader of the intemational Irada.The wortd, wtlic:h used to be analyzed within a model of well defined polarities, now has to be assesSed under a muc:h more cornplex model, whe<e the polar~ies are no! yet defined (Leter, 1994). The eonsequenee for international trade has been that lhe USA lost ~s roles of leader and arbwator, leaving room for eommercial eonflic:ts among lhe great
powers
.
Fonnatlon of Regional Trading Blocs
The second new characteriatle is that lhe ideal of multilateralism, which stood for the partieipation of ali countries in the discussion
of
intemational issues, was also heavily damaged by the formationof
lhree great regional blocs: the European Bloc wilh EU and EFTA. the North Amenean Bloc with USA, Canada and Mexico, and lhe Asian Bloc with Japan, lhe NICs, lhe ASEAN and China.These blocs have severa! fonns o! íntegration; the EU is a common ITI8f1<.et with free cireulation of goods, people, sefVIces and capital, having common policies
and supranational authorities; NAFTA ia an area of free trade with free
circulation of goods and services onty, and the Asian Btoc is an area of united
economic interests with coordinated lnvestments, technology and export
actívitles.
Since the formation of these btocs ls very recent, ít ís still impossíble to predict whether they will favor the growth of inter-bloc protectionism and liberalization ot commerce ínSide b4ocs onty or, conversety, adopt a strategy of free oompetitíon.
Wllh the conclusíon of the Uruguay Round and the aeation oi the WTO • Wortd
Trade
Organization
, the hypothesis oi
open spaces seems to be more hkety.lha
figures that show the performance of these btocs are surprising. lhaEuropean Bloc, the North American Bloc, and the Asian Bloc, íncluding onty 31 countrles, B<XXlunt for the astonishlng proportion of 85% of ali exporls wortd-wíde, reaching an estimated US$3.8 lrillíon (GATI, 1994), and 48% of lhat ís lraded lntra-bloc, i. e., ínsíde each of the lhree great lrading blocs.
Tnlde Under Prefe..mial Agreements
lha third
new
c:haraderistic is that the Idealoi li
bera1izationoi ínt
ennationalcommerce, with equal opportunities for ali oountries oi the wortd, has been
placed ín íeOPardy.
lntematíonal lrade has cnsated prívileged tradíng arrangements among regions,
íncludíng preferential tariffs, generous import quotas, sector agreements and
bilateral negotíations to settle oommercial conflicts.
lha
EU created íts preferential zone with EFTA countries, Central and EastemEuropa countríes, Medit911'8ne8n countries and their former
coloníes
in Africa,the Caribbean and the Pacific. lhe USA created a free trade zone with Canada
and Mexico. keeping privileges with the Caribbean COCX1Iries and Israel. Japan.
the NICs, lhe ASEAN and, latety, China, have strong commoc
o
interests in araassuch as commerce, technology and ínvestmenl They also share the oommon
objedive of íncreasing their exporJs to the major wortd markels, l.e., EU and
USA. MERCOSUL ilself is another example of preferentiat commerce among
membets.
Data from the Wortd Bank show that 50% of industrial goods are already
intemalionally traded through preferential agreements between certain counlries
and zonea (Wortd Bank, 1992).
Trade Under Managed Sector Agreements
The fourth new characteristic is the birth of trade managed by sectors. Analysis
of the Externai Trade Policy of the big leaders of the regional blocs shows that a considerable part of intemational trade is practiced under agreements made between enterprises or govemments of the exporter and importer countries.
The export restraining agreements known as VRA - Voluntary Restraint Agreement are becaming more and more common in foreign trade. Recently,
the USA started to negotiate the VIE -Voluntary lmport Expansion, which are forced import agreements. 8oth are the results of excessiva use of trading
instruments that compel partners to keep their flow of trade at a certain levei
through managed agreements.
Such agreements reach important sectors: textiles, via the Multifiber Agreement dueto expire in 10 years; steel, via the Multilateral Agreement on Steel that is
presently being negotiated and the VRA on steel between EU and USA, now suspended; eletronic appliances via VRA on from the Asian Bloc to the EU and the USA; and the automobiles , via the VRA from Japan to the USA and EU. Another kind of managed trade refers to bilateral sector agreements, such as the one on semiconductors anel auto-parts between the USA and Japan. Besides restricting exports to the USA, it establishes a 20% import quota of American products by Japan, in a typical VIE.
GA TT estimates that about 40% of intemational trade is done under these so-called "voluntary" agreements (GATT - Trade Policy Review, EC, USA,
Japan).
Though forbidden by the World Trade Organization's new Agreement on Safeguards, nothing can prevent the direct negotiation of such agreements by trade associations of different countries, instead of the governments of these
countries.
Globalization of the Economy
The flfth new characteristic represents one of the greatest changes in today's world: the globalization of the financiai, investments, production and consumer markets. This creates another kind of intemational trade, the "intra-industry trade", i.e. among corporations and industries themselves. GATT estimates that intra-industry trade already accounts for 50% of the intemational trade between
European countries and lhe USA. In 1992 ~ amounted to 59% for the USA total trade (GATT, TPR-US, 1994).
The relevance of multinational corporations has been growing oonsiderably. UNCTAO data show that the total revenue in 1992 for multinational corporations in industrial businesses amounted to US$4.5 trillion. lt is estimated that multinational corporations already account for 50% of total intennational trade (UNCTAD 1993).
In short, the fonnation of regional blocs, the preferential trading among countries, lhe globalization of lhe eoonomy and trade managed by sectors are the new dlaracteristics of intemational trade. They define lhe intennational strategy of the major partners in wor1d trade.
The options available to Brazil in choosing its Policy of lntemational Trade should be analyzed in view of these new characleristics.
L
111- THE CURRENT SITUAT10N OF INTERNAT10NAL TRACE
Before analyzing lhe options Brazil has in forming relationships with different intemational trade blocs,
n
is important to emphasize lhe role of each oneot
the main actors in trading activities.The European Bloc, lhe North American Bloc and lhe Asian Bloc play important roles wíth respect to ltle formation of global marl<ets, and MERCOSUL and
SAFTA must be contrasted with lhem.
TABLE 1 - lntemational Trade of Merchandlse by BIOC$ and by Selected
Countrles
-1993
(billion)EXPORTS IMPORTS
US$ % US$ %
WORLD
3,752
100
3,705
100
EUROPEAN BLOC IEU+EFTA)_
1539
41
1535
41
EUROPEAN BLOC I Extra 121
724
19
756
20
• EU ITOTALI
1,336
361,343
36. EU (INTRA EU)
815
22779
21
. EU {EXTRA EU)
521
14
56415
.EFTA
203
5
192
6NORTH AMERICAN BLOC 640
17
790
21
. USA 465
12
603
16
.CANADA145
4
137
4
.MEXICO 301
50
1
ASIANBLOC958
26 8&62
3
.JAPAN362
10
242
7
. CHINA91
2103
3
. NICs+ASEAN505
13
521
14
SOUTH AMERICA92
2
89
2
.MERCOSUL 551
461
EB+NAB+ABfTOTAL3160
863,166
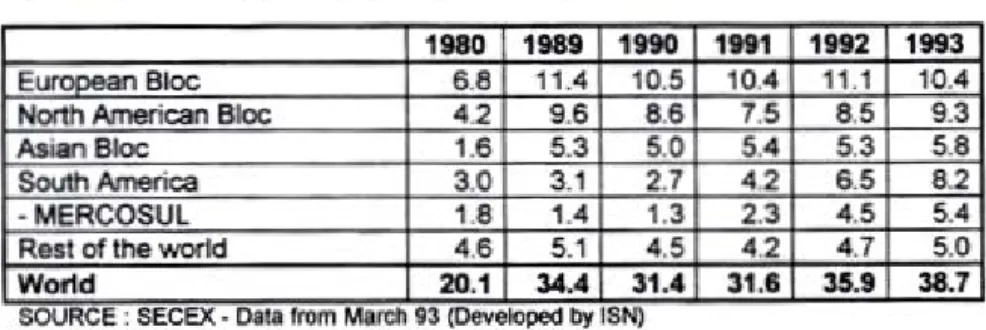
86 SOURCE.IMF 1994 11The European Bloc accounted for 41% of wortd exports, if intra-bloc exports
(between lhe 12 member-nations) are counted, and for 19% if only exports
outside the EU are considered. 1t also accounted for 41% of lhe imports ~ trade intra-EU is included and for 20% ~ trade extra-EU is excluded. The value of lhe intra-bloc trade was already 72% (see Table 1).
The North American Bloc accounled for 17% of world exports and 21% of
world imports. lt is importanl to poinl out lhal lhe American govemmenl's
statemenl thal NAFTA is the biggest exporter bloc in lhe world is nol correct. In
fact, since il is a free trade zone, NAFTA cannot be compared with the EU (14%
of exports), bul with the European Bloc, v.hich is a quasi-common markel
between the EU and EFTA. NAFTA accounted for 17% of the wortd exports in
1993 and the European Bloc (EU+ EFTA) accounled for 19% of exports. The
value of NAFTA trade intra-bloc was 33% of its global exports.
The Asian Bloc accounted for 26% of world exports and 23% of world imports.
The value of lhe Irada intra-bloc was 41% of its global exports.
South America accounted for 2% of lhe wortd exports and 2% of wortd imports.
MERCOSUL accounted for 1.4% of lhe wo~d exports and 1.1% of wortd
imports.
TABLE 2- lntra-Blocs Exports -1992
rY • BRAZIL'S RELATIONSHIPS WITH THE REGIONAL BLOCS
In order to analyze Brazíl's perfonnanoe in relation to the different regional blocs, it is necessary to take a look at its foreign trade over the last few years.
Data on exports were obtained through export lioenses in the Data Bank of DTIC • Technical Department of Externai Trade of SECEX • Secrelary of Extemal Trade. Data on imports were obtaineô from the Internai Revenue through DTIC. lnfonnation was groupeô by regional blocs to show the importance of the different groups as trading partners of Brazil.
The blocs were so defined: European Bloc: EU and EFT A
North American Bloc: USA, Canada and Mexico Asian Bloc : Japan, NICs, ASEAN, China South America: South American countries
MERCOSUL: Brazíl, Argentina, Uruguay and Paraguay Rest of lhe world: ali other countries
N. 1 • BRAZIL'S EXPORTS
1. Evolutlon of Brazilian Exports
Brazilian exports grew frorn US$20.1 billíon in 1980 to US$38.7 billion In 1993. Thís meant a 93% overall growth during this 12-year period; exports orew 95%. From 1991 to 1992 Brazilian exports
orew
by 13% and trorn 1992 to 1993 by 8%, compared to a global growth rate oi onty 4%. 11 Btazirs exports had followed lhe wortd exports' growth rata, they would have reached lhe US$40 billion levei (Table3).Brazirs performance in 1992 and 1993 improved greatly oompared to the previous situation of stagnation that exlsted in 1990 and 1991, when exports
dropped from US$34.3 billion in 1989 to US$31.4 in 1990 and US$31.6 bíllíon in 1991.
TABLE 3 • Brazil : Foreign Tl'llde • (US$ nVIIion)
Yur
lO ).132 ~ ·2,804r-~~~~--~~~~~~;~
:-
~~%~10
+-
__
1~1
-
~~~~
1 ;,428 6,470 1.907 13 5 ·,167 12 86 ~ .. 6 ~ 87+-~15~
-
~~!
r--
~11
.
1~
88 14.6(); 19,1' 89 14.31 ~ 16, t 90 ~1~. 20,661 10.752 91 ~1.o
21.~1 ~~~ 92 35. ~ '"'•308 ~ 38.7~ 25,695 13.0092. Brazll's Exports by Bloca
In 1993, Brazil's most valued partner was the European Bloc, to which Brazíl exported US$10.4 billion or 27% of its total exports. Within lhe European Bloc, lhe most important group was lhe EU with US$9.9 billion (Table 4).
lhe second most impo<tant partner was lhe North American Bloc to which Btazil exported US$9.3 billion or 24% of "s total volume. lhe most important oounlry was lhe United States which accounted for US$7.9 billion.
TABLE 4 • Brazil's Exporta by Blocs (US$ blllion)
TABLE 5 • Brazil: Exporta· Pen:entage
per
Blocs1980 1990 1991 1992 1993 European Bloc 33.8 33.6 32.8 30.8 26.8 North American Bloc 20.6 27.4 23.7 23.6 24.1 Asian Bloc 8.0 16.0 17.1 14.7 15.0 South America 14.8 8.6 13.2 18.1 21.1 ·MERCOSUL 9.0 4.2 7.3 11.4 13.9
Rest of lhe world 22.7 14.5 13.2 12.8 13.0
World 100.0 100.0 100.0 100.0 100.0
SOURCE • SECEX • Doto from Morch ~3 (Developed 1>\' ISN)
European Bloe
Looking at the distribution of Brazilian expo<ts among regional blocs, we can see
that. Brazil has increased its expo<ts to European oountries from USS 6.8 billion in 1980 to USS 10.4 billion in 1993 (Table 4). lts expons have shown steady
growth. In 1993, within the European Bloc countries. Brazilian expons were
divided as follows: Netherlands US $2.5 billion. Germany US$1.8 billion, ltaly
US$1.3 billion, Belgium-Luxembourg US$1.1 billion, Franca US$788 million.
Spain US$675 million, Ponugal US$270 million. Greece US$98 mllllon, lreland
US$60 million and Oenmark US$103 million. The six EFTA members booght
US$502 million wonh of the Brazilian expons.
North American Bloc
lt is imponant to point out that Brazilian exporta have been
los
i
ng
~ in lheAmerican
market
In 1988, theywere
US$9.6 billion, but by 1992 they had dropped to USS 7.5 billion, although they reached US$ 9.3 billíon in 1993.Meláco. in oontrast, has been growing in importance to lhe US. lts expo<ts went
from US$274 míllíon in 1986 to US$1.1 billion in 1992 and US$995 million in 1993.
Asian Bloc
In 1993, Brazilian exports to the Asian Bloc were US$5.8 billion and growing. Among the Asian Bloc countries, Brazilian exports were divided as follows: South Korea, US$538 million, Taiwan, US$588 million, China , US$779 million, Thailand , US$289 million, Hong Kong , US$ 331 million, Malaysia , US$244 million, Singapore, US$267 million, the Philippines, US$205 million and lndonesia, US$256 million.
Latin America and MERCOSUL
Chile, Paraguay and Uruguay are the most important countries for Brazilian exports. In 1993, Brazil exported, US$1.1 billion to Chile, US$961 million to Paraguay and US$775 million to Uruguay, but the most significant foreign trade has been done with Argentina.
Brazili's most important foreign trade partner in South America is Argentina. In 1993, Brazil exports to Argentina were US$3.7 billion. This is remar1<able when compared to 1990's exports of US$645 million . The potential value of Atgentina's mar1<et for Brazilian exports is approximately US$8 billion. Therefore, the present volume of trade couild easily double by the year 2000. These figures are possible because of the creation of MERCOSUL. In 1980, Brazil's exports to this region were only US$1.8 billion, and almost 13 years later the exports have risen to US$5.4 billion. In South Atnerica, Brazilian exports grew 262% during the last 13 years: an annual growth of 9%. lt is possible that by lhe year 2000, export values will be near1y to US$ 20 billion, which will representa 10% rate
ot
growth. This will be twice what the country presently exports to the European Bloc (Table 4).The Rest of the Worid
Brazil exports to many other countries, but only severa! of these buy a significant amount of goods. In 1993, Saudi Arabia imported US$420 million from Brazil • lran US$ 257 million, Nigeria US$239, Australia US$207 and Egypt US$175 million. These countries are the most important within this classification.
At the aggregate levei, ~ is important to observe the evolution of Brazilian exports among the different regional blocs. 1t is also relevant to observe lhe distribution of these exports among different countries during lhe last 13 years, a period in which the existance of regional blocs was not as important it will be in lhe next century. 1t will be interesting to see how the developrnent of regional blocs, with their systems of tariffs and quotas regulating imports , will affect
Brazil's exports. Their influence can already be seen in lhe changes in Brazil's exports during the last years (Table5).
Total Brazilian exports to lhe North American Bloc fell from 31% in 1984 to 24% in 1993. The percentage of total Brazilian exports boughl by the European
market varied from 26% in 1984, to 33% in 1990, to 27% in 1993. Brazilian exports to the Asian Bloc went up frorn 8% in 1980 to 15% in 1993, representing an inctease of 1 O% yearly.
South America went from 14.8% in 1980, to 18% in 1992 to 21% in 1993; and MERCOSUL went from 4% in 1985to 11% in 1992 to 14% in 1993, with lhe same rale of trade growth as lhe Asian Bloc.
3.
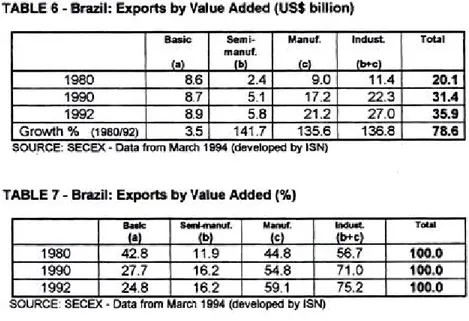
Brazllian Exports by Blocs and V alue AddedOne way of analyzing the levei of value added to export products is through their classification into basic and industrialized products and dividing the industrialized products into semi-manufactured and manufactured.
Products so classifoed in the export list according to value added are:
Basic: iron, manganese and aluminum ore,
raw
coffee, tea, sugar, soy, soy meal citrus pulp, chilled or frozen meat, cashew-nuts, Brazil nuts, tobacco leaves, pepper, frozen lobster and fish, raw cocoa, precious stones, asbestos,raw
cotton, carded ramie, granite, fresh and dried fruil.Semi-manufactured : non-alloy iron and steel,
raw
iron, iron alloy,raw aluminum, wood pulp,
sawn
wood, tanned hide, soybean oil, cocoa butter, crystal sugar,raw
tin, wool, cocoa paste, tanned fur and hide, seed extract. Manufactured: electric machines and appliances, mechanich machines and appliances, engines, chemicals, footwear, auto parts, vehicles, transpor!, materiais, steel products, paper, plastic, gasolina, apparel, textiles, yam, tiles, plywood, aluminum, glass, fumiture, precious stones, lamps, costume jewelry, integrated circuils, orange juice and other fruit juices, refined sugar, processed meat, cigarettes, freeze dried coffee, refined oil, candies, preserved vegetables fruils and plBrazilian E>q:>orts by Value Added
In 1992 , Brazil exported US$35.9 billion worth of goods, of which US$8.9 billion were in basic products and US$27.0 billion was in industrialized products. Of these, US$5.8 billion worth we<e semi-manufactured and US$21.2 billion worth were manufactured. Growth rale over lhe past 12 years was under 4% for basic products, compared to 137% for industrialized, 142% for semi-manufactured and 136% for manufactured products (Table 6).
TABLE 6- Brazil: Exporta by Value Added (US$ billion)
Buic s.tni- Manu1. lndust. Total
manuf. (o) (b) (C) ( ... C) 1980 8.6 2.4 9.0 11.4 20.1 1990 8.7 5.1 17.2 22.3 31.4 1992 8.9 5.8 21.2 27.0 35.9 Growth% (1~192) 3.5 141.7 135.6 136.8 78.6
SOU.RCE. SECEX ·Data trom Marth 1994 (devoloped by ISN)
TABLE 7 -Brazil: Exporta by V alue Added (%)
':'
M~"':;":
T-~
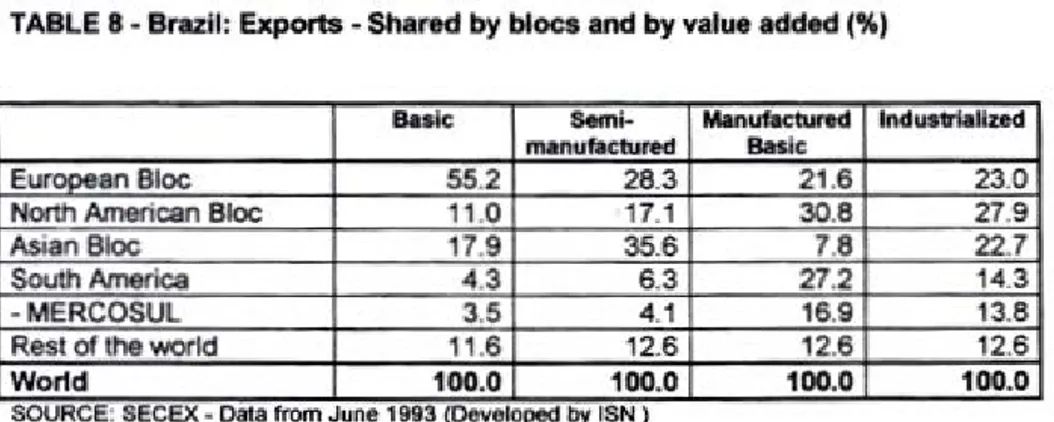
: - Data 1 rom ; 1arc11 14 by I! N)The destinations of Brazilian exports in 1992 by blocs and by value added were as follows:
Basic Products : 55% wentto lhe European Bloc, 11% lo lhe North American Bloc, 4% to South America, 3% to MERCOSUL, 18% to lhe Asian Bloc.
The European Bloc's share was stable, the North American Bloc's fell and that
of lhe Asian Block readled 20% in 1986. The European Bloc was lhe largest importer of basic products.
lndustrialized Products: 23% wentto lhe European Bloc, 28% to the North
Ame<ican Bloc, 23% to South Ame<ica, 14% to MERCOSUL, 14% to lhe Asian Bloc. The European Bloc'$ share reac:hed 27% in 1990, bul fell in 1992.
The North American Bloc's share reac:hed 38% in 1987 and also fell in 1992.
So, lhe blocs' share in lhe induslrialize<l produàs eJCpOfls ilJ balanosd, but the
North American Bloc is still the largest market of the Brazilian industrtalized products.
Semi-Manufactured: 28% for the European Bloc, 17% for lhe North American Bloc, 6% for South America and 35% for the Asian Bloc. In 1986, Brazil eJCpOfle<l31% to lhe USA. bul during recent years, lhe Asian oountries heve be<:ome lhe most promising market for Brazilian semí-manufaàured goods .
Manufacwred. 22% for lhe EIKopean Bloc, 31% for lhe North Amencan Bloc, 27% for South America, 17% for MERCOSUL and 8% for lhe Asian Bloc.
During lhe last decade ,there have been some changes in lhe manufaàure<l goods eJCpOfle<l by Brazil. In 1987, lhe country exported 40% of its
manufactured goods to the North American Bloc, and this downward trend indicatas that manufactured goods have lost some market share in North America. Moreover, lhe share of manufactured products eJCpOfled by Brezilto MERCOSUL has increased greatly. In 1990 , the MERCOSUL markets imported 6% ot lhe total manufacture<l products eJCpOfled by Brazil, and
two
years later lhey imported 17%. In short. lhese data show lhat lhe larg&$1 market
for lhe Brazilian manufactured products is still lhe North American Bloc, bul that
lhe MERCOSUL market is gaining importance
TABLE 8. Brezll: Exporta-Share<l by blocs and by value added (%)
Baslc 8emi- MlnllfoctuM lndu01riallzed manufllctured Baslc
European Bloc 55.2 28.3 21.6 23.0 North Amencan Bloc 11.0 17.1 30.8 27.9
Asian Bloc 17.9 35.6 7.8 22.7
South Ame<ica 4.3 6.3 27.2 14.3
·MERCOSUL 3.5 4.1 16.9 13.8
Rest of the world 11.6 12.6 12.6 12.6
Wortd 100.0 100.0 100.0 100.0
SOURCE. SECEX • Oala from June 1993 (Delleloj>ed by ISN)
4 -Brazil Exporta by Blocs and Product Groups
Brazilian exports can also be divided into severa! large groups of products according to the NBM-SH (Brazilian Merchandise List - Harmonized System) classification.
Foodlfobaccolbeverages (I to IV in the NBM-SH): Products of animal origin:
livestock. meat, fish, dairy prcduc:e, eggs; vegetable products: plants, vegetables, fruits, coffee, tea, cereais, starch, wheat, grains, seeds, gum; animal and vegetable fats and oils; food products, beverages and tobacco: proc:essed meat. sugar, cocoa, flours, proc:essed cereais, dough, fruits and vegetables preserves, alcoholic and non-alcoholic beverages, tobacco. Mineral Producfs (V) : Salt, sulfur, gypsum, quicklime, c:ement, ore, fuel, mineral wax.
Chemical Products (VI): inorganic, organic, pharmac:euticals, fertilizers, paints, essential oils, soaps, waxe.s. glues, gunpowder, photographic products.
Plastic and Rubber (VIl).
Footwear and /eather (VIII and XII): Footwear, hats, umbrellas, fur and leather goods.
Wood and coai (IX): wood, oork and wood craft Papar and rellulose (X): papar and printing Textile {XI): yam, fabric and apparel
Non-metal minerais and predous metais {XIII and XIV): Stone crafts, tile and glass; pear1s, precious stones, precious metais.
Common metais (XV): lron and steel, ccpper, nickel, aluminum, lead, zinc, tin, tools.
Electric machinery and equipment {XVI).
Transport material (XVII): transpor! vehicles, automobiles, tractors, aircraft, boats.
lnstruments (XVIII): optical, photographic, measurement and control inslruments.
• Others (XIX to XXI): Anns and ammunition, various merchandise: fumiture, lamps, toys, sporting goods; art objects.
Exports to each bloc were broken down acccrding to lhe composition of lhe
export list , lhus showing what sort of produds each bloc imports from Brazil.
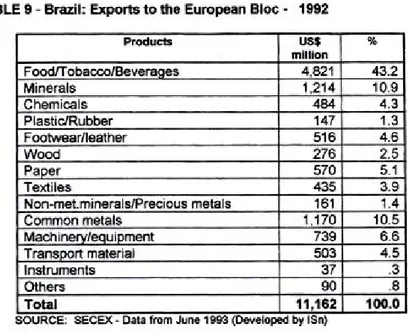
The value of Brazilian exports to lhe Europem Bloc was US$11.2 billion. The most important products were food, tobacco and beverages, followed by
minerais and common metais (lhe ones used for making steel and aluminum).
The export list is mostly composed of products wilhlittle value added.
The value of lhe Brazilian exports to lhe North American Bloc was US $8.5 billion. The most important products were: machinery and equipment, food,
tobacco and beverages, and footwear, followed by common metais (lhe ones
used for making steel and aluminum) and transport materiais (automobiles). The list is diversified and composed mostly of higher value added products, which
means better market value and profit margins. These sorts of trade advantages
are found only in lhe North American markets.
The value of lhe Brazilian exports to lhe Asian Bloc was US$5.3 billion. The most important products were: common metais (iron, steel, aluminum), minerais (ore), and food (meat, soy complex, coffee). The list consists mostly of low value added products.
The value of lhe exports to South America was US$6.5 billion. The most relevant products were: machinery and equipmen~ transport materiais (vehicles) and common metais such as steel, iron and aluminum.
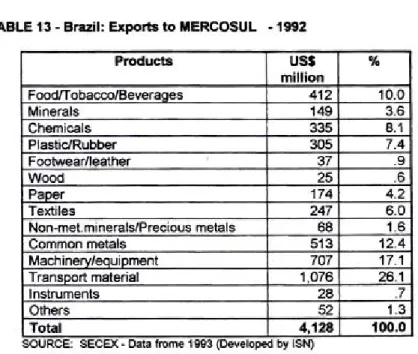
The same distribution occurs in lhe exports to MERCOSUL lhat bought US$4.1 billíon worth of Brazilian products. The list is díversified bul with greater concentration of higher value added products.
The value of the exports to lhe Rest of lhe World was US$4. 7 billion. The most
important products were: food (meat, sugar, cocoa) and common metais (lhose used for making steel and alumínum). The list consists mostly of low value added products.
TABLE 9-Brazil: Exports to the European Bloc- 1992 PTodUC1S
us
s
.,.
million FoodfTobaccoiBeveraoes 4 821 43.2 Minerais 1,214 10.9 Chemicals 484 4.3 Plastic/Rubber 147 1.3 Footwear/leather 516 4.6 Wood 276 2.5 PaDer 570 5.1 Textiles 435 3.9 Non-met.minerals/Predous metais 161 1.4 Common metais 1 170 10.5Machinerv/eQuipment 739 6.6
Transport material 503 4.5
lnstruments 37 .3
Others
90
.
8
Total 11,162 100.0
SOURCE. SECEX ·Data !tom June 1993 (Oe-;elojled by ISn)
TABLE 10-Brazil: Exports to ltle North Ameriean Bloc -1992
I'T'oduets
uss
%mlllion Food/T obacco/Beveraaes 1622 19.1 Minerais 415 4.9 Chemicals 380 4.5 Plas1ic:/Rubber 210 2.5 Footwearneather 1161 13.6 Wood 134 1.6 PaDe< 229 2.7 Textiles 426 5.0
Non-melminerals/Precious metais 135 1.6
Common metais 1046 12.3
Macl'linetY/eauipment 1 631 19.2
TranSJ)OC'I material 937 11.0
lnstruments 88 1.0
Others 100 1.2
Total 8,514 100.0
SOURCE. SECEX • Dato from J\Uio 1W3 (Oovolopod by ISN)
TABLE 11 • Brazil: Exports to 1t1e Aalan Bloc-1992
uss
% Foodf 71 -i614 34 17.6~
S8
s:o
7T4
9 1.8 I Wood I Paper 113 3:1 Textíles 1 10 2.1 I melaiS !7 I c • metais 2. 1744
74 3.64
3.1
83:
Jthers 2~
SECEX ·DOU trom .AJno 1W35.314 100. lb11S~
TABLE 12 - Brazil: Exports to South America -1992 Products
uss
% million FoodVTobaCOO(Beveraoes 514 7.9 Minerais 197 3.0 Chemicals 513 7.9Plastic/Rubber 451 6.9
Footwear/leather 84 1.3
Wood 34 .5
Paper 264 4.1
Textiles 397 6.1
Non-met.minerals/Precious metais 122 1.9
Common metais 999 15.3
Madlinerv/eauipment 1,184 18.2
TransPOrt material 1,627 25.0
lnstruments 57 .9
Others 75 1.1
Total 6,517 100.0
SOURCE. SECEX-Data from June 1993 (Oeveloped by ISN)
TABLE 13-Brazll: Exporta to MERCOSUL -1992
Products
u
s
s
% Fc
412 10.0 149 3.6 I 315 8.1 3 15 7.4 ' 17 .9 Nood 25 >aper 174 4. 247 6. • metais 68.E
1metals 513 707 T 1.07 .1 2 .7 >therss
1.3~
SECEX ·Data frome 1993 ·4,12 100.0 I by ISN)
TABLE 14-Brazll: Exporta to the Rest ofthe Woftd 1992
~
% 33.6 10.2 130 2 190 4 61 1 IWood t IP_. 2· Textíles •metais 72 li' o metais lit
:
I Others 45< 9,T
ota
l
lb'f~
o
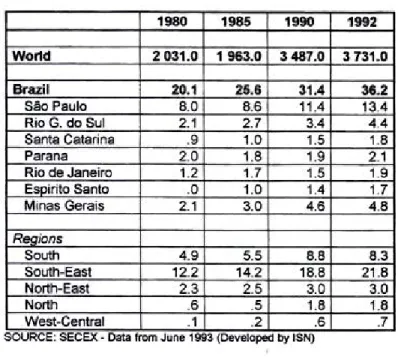
100. • Dato from 1993 ' 265. Brazil's Expofts by States
sao Paulo State representa 34%
ot
Brazirs GNP (US$ 470 billion) and 23% oi the total population in lhe oountry (145million). 1t also has an impressive amount of exports: US$ 13 billion which is equivalent to 36%ot
Brazil's total exports in 1992. The sao Paulo State's industrial production represents 42%ot
the oountry's total production . lts infant mortality rale, which shows lhe effectiveness of public health care policy, is decreasing. Ouring lhe period from 1970-1975, lhe infant mortality rale in lhe Stateot sao
Paulo was 86 per 1,000 bom ative. This rale dropped to 26 per 1,000 bom alive in 1993, while lhe restot
lhe c::oootty still showed a higher leveiot
61 per 1,000 bom alive. The levei oienergy oonsumption per capjta is higher lhan that in
many
othef OOISI!ties, such as Portugal, Argentina, Israel and Republic oi Korea. The State of Sêo Paulo energy oonsumption per caplta was 1.7 kgot
oil equivalent, in 1993. This amount is almost lhe double of the oountry's per capita anergy consumption . In the past, lhe State of sao Paulo was by far lhe most lmportant exporter state.Nowadays, other states , such as Rio Grande do Sul. Minas Gerais and Espírito
Santo are increasing lheir exports (Table 15).
Global exports grew 91.5% during 1980-92. Brazírs exports have
not
increased to lhe $iOITle extent. vrowing only ~ dwing this pe<1od • sao PaulO State's lower growth rale oi 67.5% oompares unfaW<ably to lhe rale of other States such as Rio Grande do Sul, Santa Catarina and Minas Gerais. These dataclearly show lhat other regions in lhe oountry are challenging São Paulo's
export leadership (Table 111).
The distribulion of the destinations of exported goods differed between goods coming from São Paulo and those ooming from Brazil as a whole. In 1992, Brazilian and sao Paulo Satate exports were distributed as follows:
Regional Bloc Brazil Slo Paulo
European 31% 25%
North American 23 28
Asian 15 8
MERCOSUL 11 16
South America 18 27
This table shows that Brazil's most important importers are the European and the North American Blocs, while São Paulo State's significant importers are South America, North America, and then, the European countríes. There are some other relevant differences between São Paulo and Brazil which are related to the contents of technological exports . This issue will be discussed in sedion6.
TABLE 15 -Brazil: Exports by States anel Regions- US$ billion
1980 1985 1990 1992 Wortd 2 031.0 1 963.0 3487.0 3 731.0 Brazil 20.1 25.6 31.4 36.2 São Paulo 8.0 8.6 11.4 13.4 RioG. do Sul 2.1 2.7 3.4 4.4 Santa Catarina .9 1.0 1.5 1.8 Para na 2.0 1.8 1.9 2.1 Rio de Janeiro 1.2 1.7 1.5 1.9 Esoirito Santo
.
o
1.0 1.4 1.7 Minas Gerais 2.1 3.0 4.6 4.8 Reoions South 4.9 5.5 8.8 8.3 South-East 12.2 14.2 18.8 21.8 North-East 2.3 2.5 3.0 3.0 North .6 .5 1.8 1.8 West-Central .1 .2 .6 .7SOURCE: SECEX ·Data from Juno 1993 (Doveloped by ISN)
TASLE 16-Brazil: Exporta by States and Reglons Rate of Growth (%)-1980-1992
I
Wortd 9151 Brazil 80.1 São Paulo 67.5 Rio Grande do Sul 109.5 Santa Catarina 100.0 Paraná 5.0 Rio de Janeiro 58.3 Esoírito Santo 88.0 Minas Gerais 128.6 Reaíons South 69.4 South-East 78.7 North-East 30.4 North 200.0 West-Central 600.0.
SOURCE; SECEX Dltl 1Iom Junc 1993 (DIMIIoped by ISN)
6. Brazil's Exports by Technological Content
UNCTAO has developed a dassification for products according to their tectonological content as follows:
High T echnology Content airspace, computers, electronics, pharmaceuticals,
precision instruments, electric and mectoanic machines, fine chemistry, precision mectoanics, automobiles.
Mectium Technology Content chemistry ,rubber, plastic, pape< and cellulose. Low Technology Content Non-metal minerais, foods, beverages, tobacco, oil refining, metallurgy, metal products, editing and printing, wood and fumiture,
textile, footwear and leather.
TABLE 17. Brazil and Sio Paulo: Exports by Technologlcal Contents (Average1991-1992) %
Brazil Sio Paulo
Low 67,8 47,7
Average 11,9 14,5
Hlgh 20,3 37,8
In 1992, according to lhe UNTAD technological classification, Brazil's exports consisted mostly of low technology content produds, which accounted for 68% of its total exports. The majority of exports from São Paulo consist of medium or higher technology products: airplanes.automobiles,machinery and equipment, chemicals, plastics and electronics. The majority
ot
Brazirs exports are such low technology products as: foods and beverages. minerais, textiles, shoes and metallurgic materiais.IV.2 • BRAZIL'S IMPORTS
Brazilian imports amounted to US $23 billion in 1980 and US$25.7 billion in 1993. which represents an 11% increase in nominal tenns, ora little less than a
1% rate of annual growth . lmports of rose US$20 billion in lhe early '80s, fell to US$15 billion from 1983 to 1988 and rose again in 1989. These figures reveal that allhough lhe Brazilian economic policies for growth and development pretended to open lhe economy, it has actually remained extremely closed . The
lmports share of importsin the GNP fell from 9% in 1989 to 5% in 1993.
1. Brazil's lmports by BIOC$
Brazirs most important imports during the last decade were from lhe European and lhe North Amerícan blocs, which each contríbuted 27% or US$6.9 billion worth of lhe imports in 1993. Within lhe North American Bloc ,lhe mos! important partner was the United States wíth US$6.0 billion in 1993, which shows how unimportant the other members of the bloc are for Brazilian exports. From lhe European Bloc , Brazil imported almost the same amount as " had from the North American Bloc, In 1989, Brazil imported US$ 4,8 billion which represented 26% of lhe country's total imports. Germany provided lhe largest amount of imported goods , at US$2.3 billion, followed by ltaly with US$1.0 billion , and then F rance wilh US$690 million.
The third important regional bloc for Brazilian imports was South America wíth US$4.4 billion followed by the "Rest of the Worlcf', with US$4.6 billion in 1993.
The imports from the "Rest of lhe World'', the Middle East. fulfilled a great portion of Brazilian oi I demands.
TABLE 18- Brazil: lmports by Bloc of Orígin (US$ billion)
TABLE 19- Brazil: lmports by Blocs (%)
1989 1990 1991 1992 1993
Eurooean bloc 26.2 25.6 26.8 26.7 26.7
North American Bloc 24.8 24.2 26.9 27.7 26.9
Asian Bloc 8.8 8.3 8.6 8.3 11.3
South America 17.2 16.3 16.5 16.0 17.0
-MERCOSUL 12.0 11.2 10.8 10.7 13.0
Rest of lhe wortd 23.1 25.7 21.2 21.4 18.1
Wortd 100.0 100.0 100.0 100.0 100.0
SOURCE. SECEX • Oata from Maroh 1994 (Develq>eCII>y ISN)
2. Brazillmports by Blocs and Products
The value of the Brazilian imports from the European and the North American
Blocs were significant and qu~e well balanced during 1983-1993 (Table 18) .
European imports. which amounted to US$ 5. 7 billion, machinery and
equipment accounted for 31%
ot
the total and chemicals about 24%.The imports from the North American countries totalled US$ 5.6 billion. The
most relevant products were machinery and equipment, which represented 31%, chemicals at 17% and minerais at 14%.
In 1991, the imports from Asian Bloc were US$1,8 billion. The product
distribution was similar to North America's, and the most important products
were machinery and equipment 52%.
Finally, the imports from the South America Bloc represented US$ 3.5 billion, and foodllobacco/beverages (36%) and minerais (22%) were the most important product purchased. The MERCOSUL countries, representing 65% of Brazilian imports from the South American Bloc, sold the the country US$ 2,3 billion of goods, mainly foodllobacco/beverages and textiles.
In 1991, imports from the Rest of the World were US$4.5 billion worth. Minerais, principally oi I and its sub products ,accounted for 80% .
TABLE 20-Brazll: lmports from lhe European Bloc- 1991
Products
u
ss
% million FoodffobaccotBeverages 612 10.8 Minerais 104 1.8 Chemicals 1,337 23.7 Plastic/Rubber 215 3.8 Footwearneather35
.6 Wood 5 .1 Paper 145 2.6 Textiles 110 2.0Non-met.minerals/Precious metais 75 1.3
Common metais 335 5.9 Machinerv/eauioment 1,990 35.2 Transoort material 359 6.4 lnstruments 299 5.3 Others 31 .5 Total 5,650 100.0
Source. Secex -Da1a from March 1993 (Developed by ISN)
TABLE 21 -Bnzil: lmports from lhe Notth
Americ:M
B1oe -1991 1'.-.c:tsuss
% million FOOdfTobaccoJBever-s 457 8.5 Minerais 792 14.0 Chemieals 948 16.8 Plastic/Rubber 306 5.4 Footwear/leather 16 .3 Wood 1 0.0 Paoer 206 3.7 Textiles 81 1.4Non-met.minerals/Precious metais 65 1.2
Common metais 204 3.6 Mactainery/&Quioment 1763 31.2 Transpo<t material 395 7.0 lnstruments 381 6.7 Othets 15 .3
Total
5653 100.0.
...
SOURCE. SéCEX Data lmm June 1993 {l)o\o-by ISN)
TASLE 22-Srazil: lmpor1s from lhe Aalan Bloc-11191
m~t:n
% I 3. Pll 2j 1.:wood
i6 3. 'metais 17 'metais l3 4....
94 51.9 8 1.4 17 l.4 I Others 17 _.iI
Total
1,812 100.0TABLE 23-Brazil: lmports from South America -1991
Products US$ million %
South Am. MERCOSUL South Am. MERCOSUL
Food!Tobacco/Beverages
1259
1,153
36
.
3
50
.
6
Minerais771
61
22
.
3
2.7
Chemicals247
193
7
.1
6
.5
Plastic/Rubber96
76
2
.
6
3
.4
Footwear/leather143
139
4
.
1
6
.
1
Wood23
22
.
7
1
.
1
Paoer/cellulose73
24
2.1
1
.1
Textiles276
249
6
.
0
11.0
Nonmetal. Min./Precious met.
35
17
1
.
0
.
7
Common metais
2
4
0
49
6
.
9
2
.
2
Machinerv/oouioment166
156
4
.
6
6
.
9
TransPOrt Material11
1
1113
.
2
4
.
9
lnstruments11
9
.
3
.4
Others6
6
.
2
.
3
Total 3,484 2,268 100.0 100.0SOURCE. SECEX ·Dota trom June 1993 (Déveloped by ISN)
TABLE 24-8.-.zjl: Importa from thft Rest of lhe World -11191 Products
u
ss
""
mítlton FOOdiTot>acco~Bev..-s 1894
.2
Minerais 3547 79.5 Chemicals 392 8.8 Plastic/Rubber 5 .1 Footwearneather 21 .5 Wood 1 0.0 Paoer 13.3
Textiles 45 1.0Non-metminerals/Precious metais
2
.1Common metais 46 1.0 Macrune.v/ 110 2.5 T material 50 1.1 lnstruments 37 .8 Others 3 .1 Total 4482 100.0
SOURCE. secex. Dita
trem J
une 1993 (Develope<l 11y ISN)IV.3 -CONCLUDING REMARKS
From the data lhat were presented and analysed here, one may draw some
conclusions abOul lhe nature of past Brazilian import-exports activities lhat
should not repeated in lhe tuture. lf lhey are, lhe country will not be able to
overcome lhe bottJeneck related to its structural backwardness: socially unfair income distribution, lack of finn commitment to improve its international competitiveness, insutficient supply of goods and services , a shortage of lhe capital, technology and management knowfedge necessary to implement large scale of production. Brazil's past intemational trade activities do not necessarily indicate lhe path it should choose in order lo ina-ease ~s
intemational competitiveness, as well as its stable and sustained economic growth and development.
In respect to Brazilian exports, lhe most important partners have bee<l lhe European Bloc. lhe North American Bloc and South America. lhe North American Bloc's share in the Brazilian exports has been stable, while lhe European Bloc's has decreased and South America's has increased
significantly since of lhe creation of the MERCOSUL. Regardless of the stability of demand or lhe size lhe export share that a particular economic bloc has. lhe most important aspect to be considered is the nature of lhe products being
demanded. This demand will detennine lhe country's comparativa intemational
competitiveness related to its foreign trade policies. The decision to open a country's economy to intemational market compet~ion is nota simply question of political desire: it deals with lhe country's market share competiliveness based on products with high technological contents ( value added ).
Brazilian exports to Europe consisted mainly of low technology products such as fann products (43'.!.) and minerais and ore (11%). In contras! to products bought by Europe, Brazilian exports to North American Bloc were composed of higher value added products ( high technology content) such as machinery and equipment(19'A.), transpor! materiais (11%), metais (12%) and manufactured
foods (19%). Exports to South American countries also consisted of technologically advanced produsts. such as transpor! material (25%), machinery and equiprnent (16%) and metais (15%).
Given our initial premise about foreign trade policies, lhat on efficient opening
economy should concentrate on ina-easing its intemational market share of high technology products, Brazil's best opportuniies seem to be in lhe North American
Bloc.The North American and lhe European Blocs are important and stable suppliers for Brazilian import market, but South America's market share is
inaeasing. The products that have bee<l imported from these countries are
mostly machinery, equipment and transpor! materiais.
V. CURRENT POUCY TOWAROS INTERNATlONAL TRADE
The Brazilian decision to open its economy has not been an even and continuous process. For many years, a vague desire to open the Brazilian economy existed among some policy makers and politicians, but almost no effective policies supporting these ideais were implemented. However, during the last decade, starting in 1967, various political decisions were taken which
made the process of opening the Brazilian economy irreversible.
Brazilian foreign trade policy has been a consequence of other economic measures taken to meet the priorities of the moment, such as generating foreign currency reserves by reducing imports, or sustaining high leveis of exports through a variety of aggressive strategies.
Ouring the import substitution phase, govemment policy consisted of banning
the entry of foreign products to help the development of domestic industry. There
was strict control over imports and high tariff barriers to protect local interests, as well as a strong system of supporting exports through means of subsidies and other ftnancing aids.
Ouring the 80's , when the foreign debt crisis occured, Brazil adopted rigid
policies in order to generate foreign currency reserves at any cost. This translated into support for exports and strict limits on imports in order to improve Brazil's balance of payments - current account.
Brazil started opening its economy in 1991, when severa! measures were
implemented to increase the country's compemiviness. Externai tariffs were
reduced from an average of 50% to 20% from 1991 to 1994. A list of particular product , subject to lower trade tariffs. will be introduced which will lower the average tariff rate frorn 25% to an average of 10% in 1998. Since Brazil is the most important commercial partner of the South American countries, ali these procedures were also aimed at making the MERCOSUL a feasible common market after the year of its inauguration, 1995.
The Objeetlve of the Current Trade Polley
The eurrent Brazilian extemal trade poliey aims at inereasing lhe effieieney of the prOduction and marketing of gOOCis and services by integrating lha eountty into lhe lntemational eeonomy . This will be accomplished by giving foreign markets , both imponers and exponers, easler aceess to Btazilian prOCiucts and markets (Repon of lhe Govemment of Brazil in GATT, TPR- Brazil, Vot. 11,
p.199, 1992).
Brazil gave high priority to a
so
occessful c:ondusion oi lhe GA TT Uruguay Round with important egreemems lhe redudion of exts1Jng proteetion, especoalty in areas of interest to developing eountries.Under lhe New Industrial Poliey and Externai Trade Poliey announced In 1990, lhe govemmenl has set lhe objeetive of liberalizing imports lhrough redueing tariff proleetion and eliminating nonolariff measures, The objeetive is to gradually e.xpose lhe domestic economy to intematlonal eompetition.
Govemment support for e.xports tries to lncrease the value added of expons,
and to identify
new
markets through expons finanáng., simplifieation of exponprocoduro.o, modcmíz.otion of infra-sttucture end review of tariffs.
The main ehanges
were
lhe fotlowing:- refoonulatlon of lhe foreign excha.nge regime which rtr1W floats freely In lhe interbank markel,
- review of the proleetionist scherne, by lnereasing lhe exposure of Brazilian prOCiucts lo lntemational eompelition, and letting tariffs be the main instrumenl of proteetion,
- reformulation of lhe exports' promotion poliey by signifieant elimination of
fiscal incentives,
- inc:reased tratlspareney and efficieney of lhe decision makíng prooess related to lhe Externai Trade Potiey througtl a far-reaching reform oi govemmeo 4 ins1Jtutions and simptifieation oi norms and proeedoxes.
Structural reforms aiming at stabílizing inflation were implemented and, at lhe same time, the externai debt was renegotiated . The Externai Tracte Poliey plays an important role in lhis
effort
as it inereases eompetition and lowers domestic prices. Llberallzation aims at eutting investment eosts and strengthening exports' eompetitivity lhrough easier aecess to more efficient inputs.In lhe agricultura! sector, lhe old model of self-sufficíeney and exponing surptus was replaced with a
new
model lhal slressed increased intemationalcompetitivity, improved quality and quantity of domestic supply and better control and defense of lhe environment
tn the industrial sector, the objective is to increase competitivity through special programs such as the Program of Industrial Competitíveness. This program helps to increase modemízation through measures such as tax and fees exemption for the acquisition of machinery and equípment, and accelerated depreciation and deregulation of ports.
The computer sector was opened to intemational competition by eliminating non-tariff restridions. The sedo<'s policy includes: redudion of lhe protection to products under mar1<et reserve; openness to foreign technology; adoption of a tariff policy in the area of components, and a plan for developing of lhe sedor that sets the ma in targets to be pursued.
Brazil is an important ador in lhe muttilateral negotiations at GA TT and il backs lhe strengthening of the multilateral system and liberalization of intemational trade. Brazil's main objedive
at
lhe Uruguay Round was lhe redudion of barriers and easier access to mar1<ets, especially reduding protedion to the agricultura! sector of developed countries which impairs exports in this sedor.Bask: Points of lhe Current lnltmational Pollcy
The most important poínts of the current policy on Brazil's entry inlo lhe intematíonal economy are the support of muttilateralism and consolidation of MERCOSUL.
Brazil has always been a supporter of multilateralism , with the participation of ali countries in intemational negotiations, especially in the commercial area. Moreover, i! has always been interested in strengthening GA
TT
so that it can better fundion as the regulator body of intemational trade, and the manager of conflids between developed and developing countries.In compliance with GATT's principies, Brazil defends trade liberalization which is best accomplished by treely opening marl<ets to ali countries and by deregulating trade, which is now restrained by countless preferential agreements and sector arrangements that exists mainfy among the most developed countries. In GA TT's jargon, Brazil defends lhe principies of lhe mos! favored nation that estabfishes n~iscrimination among nations. According to that principie and in view of Brazil's exports which reach a great variety of marl<ets, Brazil has adopted lhe policy of defending its condition of "global trade(', i.e .. a country that trade$ with ali other countries in the world and has no interests in making speciaf agregments or getting closer to any one of the great bfocs being created.