PREDICTING THE PRICE INDEX OF TEHRAN STOCK EXCHANGE
H. Abdollahzade1 , A. Safari1,*
1Department of Financial Management, Faculty of Management and Accounting, Shahid Beheshti University, Tehran, Iran * a.safari991@gmail.com Received 28/06/2017 -‐ Accepted 16/08/2017 DOI: 10.15628/holos.2017.6062 ABSTRACT
Today, pursuant to development of science and emerging of modern managerial techniques in economics and financial markets, one can hope to achieve more profits by small capitals but appropriate and timely decision making. Inter alia, stock exchange is one of the most prominent markets in which management of capital and decision-‐making method are crucially important. The stock exchange index may be assumed as one of the objective manifestations of the macro financial status in a community. Due to fluctuation of prices, investment in stock exchange is followed by high risk. Thus, prediction of behavior of stock exchange is a very difficult task. Hence, it necessitates for adaption of quantitative techniques in financial knowledge. Overall, this first question which
should be responded regarding prediction of time series is that whether the studied time series are predictable or not. It is because of this fact if the given time series includes random trend then it can be expected that all of the existing techniques and models concerning prediction of the time series fail to propose appropriate and ideal results. By employing Rescaled Range (R/S) analysis for review on structure of time series and also Variance Ratio Test for testing Random Walk theory in this study, predictability of monthly values of Tehran Exchange Price Index (TEPIX) is examined. The results of R/S analysis and variance ratio test indicate the presence of positive correlation (long-‐term memory) and non-‐random monthly values of time series for price index, respectively.
KEYWORDS: Long-‐Term Memory, Random Walk, Variance Ratio Test, Tehran Stock Exchange
1 INTRODUCTION
The random behavior is assumed for most of economic variables in the given literature of economy and econometrics. Such an assumption results in that the fluctuations of such variables is not predictable. At the middle of 1970s and also since 1980s, new and extensive efforts were started regarding predictability of stock prices by means of modern mathematical techniques, long time-‐series and advanced tools that were led to advent of Chaos Theory and linear and nonlinear dynamism. This theory is a strong and important method for identifying economic and financial processes. The chaos phenomenon tends to seek for regularity in seemingly random behavior of price in stock exchange and other financial markets. One can discover the complex pattern over such variables and use them for prediction of their future trend in short term by means of Chaos Theory. Therefore it can be implied the monetary and financial markets are deemed as one of the suitable cases for adaption of Chaos Theory. The Chaos Theory provides for conducting more accurate study on very complex behavioral characteristics of economic variables which are impossible to be met by the current tools (Moshiri, 2002).
Based on the current theories in financial markets, market returns are independent from each other. In other words, prices follow Martingales process. Efficient Market Hypothesis (EMH) is one these theories. Based on EMH theory, prices in stock exchange follow random walk process; namely, stock returns may not be predicted according to the previous changes of prices in such a market since the information is quickly disseminated in market and it will impact on stock price. Alternately, in order to consider correlations of returns and prices in financial indices at stock exchange, Peters (1994) suggested Fractal Market Hypothesis (FMH). This hypothesis does not disprove the former reasons concerning lack of correlation, but it assumes wider range for behavior of returns. The fractal market hypothesis originates from theories of fractals and fractal geometry (Morovat, 2012). The fractal market hypothesis is a substitute for EMH based on Chaos Theory (Peters, 1994). Fractal market hypothesis focused on heterogeneity of investors mainly with respect to horizon of their investments. According to fractal market hypothesis the behavior of prices and returns may be in three forms: anti-‐persistent (as equivalent of mean-‐ reverting feature), random (i.e. EMH), and persistent (denotes presence of correlations and long term memory and fractal structure in indices), but this theory focuses on presence of fractal structure in time series.
This question has been equivocal for long time that if it is possible to predict price of assets. One of the methods to give answer to this question is the variance ratio test. Lo and McKinley (1988) innovated a new test about examination of random walk theory and thus analysis on weak form of market efficiency and called it variance ratio test. It is noteworthy that the long term memory is one of the defects for efficient market in which it denotes time series of stock market index does not follow random walk theory. The long term memory (which also called dependency with long term range) explains structure of correlation of values in a time series in long time intervals. During recent decade, processes with long term memory have devoted major part of analysis on time series. Whereas long term memory causes dependency of future price of asset on its former prices, it indicates presence of a predictable parameter in dynamics of time series. Presence of long term memory in stock price index represents autocorrelation among observations with long term interval. Thus, the previous values can be
employed for prediction of its future values. Among the conducted studies on analysis of market efficiency and presence of long term memory (fractal structure), one can refer to the following cases:
Using daily data, Erfani(2008) analyzed long term memory in Tehran Exchange Price Index (TEPIX) for period (2003-‐2007). He used three methods for this test i.e. standardized range, modified standard range, and detrended fluctuations techniques. The results of all three models showed that Teheran Stock Exchange possessed long term memory. Using classic R/S statistic, Greene and Fielitz (1977) found strong evidences about presence of dependency in daily return of New York Exchange Index. Olan (2002) examined the presence of long term memory in returns rate of 9 international exchange indices using parametric and semi-‐parametric methods and presented some evidences about presence of long term memory in exchange markets at Germany, Japan, South Korea and Taiwan while USA, UK, Hong Kong, Singapore, and Australian stock exchanges lacked signs of long term memory. Costa and Vasconcelos (2003) analyzed presence of fractal structure in Brazil stock exchange index by means of R/S technique. They confirmed presence of fractal structure in returns of Brazil stock. Kim and Yoon (2004) showed presence of long-‐term correlation at South Korea stock market index by means of R/S analysis. In a study, Squalli (2005) examined daily data of indices for various industries in Dubai stock exchange from 2000 through 2005 using variance ratio test. The result of this investigation rejected random walk hypothesis in Dubai market in all industries except banking industry by means of variance ratio test and market efficiency was also disproved at weak level using turnover test. Onali and Goddard (2011) tested presence of long term memory in returns of stock in eight European countries using R/S method. They found strong evidences about presence of long term correlation in stock index of Czech Republic and weaker evidences in stock indices at Switzerland and Spain. However, they indicated that 5 other indices (e.g. UK stock index) did not follow fractal process.
The concept of long-‐term memory denotes that the given events may affect the intended time series and this impact may be visible in this time series for long run (Nikoomaram, Saeedi, and Anbarestani, 2011). Many tests and models have analyzed long-‐term memory in time series out of which one can imply Detrended Fluctuation Analysis (DFA), Rescaled Range Analysis (R/S), Modified Rescaled Range (MRS), Autocorrelation Function Test (AFT) [in this technique, autocorrelation diagram is reduced from certain value not exponentially but in hyperbolic form] and Geweke & Porter-‐ Hudak (GPH) test (1983) (this method is based on frequency range analysis). In this regard, the current research analyses predictability of monthly values of Tehran Exchange Price Index (TEPIX) using 2 different techniques. The conducted techniques include variance ratio test, which has been used as the strongest test, and rescaled range analysis (R/S) for determination of presence of long term memory in time series of price index.
The rest of this paper has been organized as follows. The second section is devoted to methodology. The results of research are presented in third section and conclusion is proposed in Section 4.
2 METHODOLOGY
The needed data in this study include monthly values of Tehran Exchange Price Index (TEPIX) during years 1998-‐ 2015. Tehran Stock Exchange computed and published its price index
under title of TEPIX since April 1990. This index represents variations of total market price and it is computed as mean weighted and by means of the following formula:
𝑇𝐸𝑃𝐼𝑋! = 𝒏𝒊!𝟏𝒑𝒊𝒕𝒒𝒊𝒕
𝑫𝒕 ×100 (1)
𝒑𝒊𝒕: Price of ith company at time t; 𝒒𝒊𝒕: Number of published stocks by ith company at time t; 𝑫𝒕: The basic number at time-‐t that was 𝑝!!𝑞!! at original time; 𝑝!!: Price of ith company at original time; 𝑞!!: Number of published stocks by ith company at original time; 𝒏: Number of index-‐ included companies.
The price index indicates general price trend among the enterprises and it should be affected by price changes and not by other parameters. As usual, the following cases cause adjustment of index basis:
1) Increase in capital of companies from cash contribution; 2) Increase in number of index-‐included companies; 3) Reduction in number of index-‐included companies; 4) Dissolution of companies; 5) Merging of companies
TEPIX index covers the stocks of all listed enterprises in Tehran stock exchange and if brand of any company is closed or is not transacted for some period, the last dealing price will be considered in index. The numerical values of prices index have been extracted using archives (indices) of Tehran stock exchange website and also technology Management Company of Tehran stock exchange.
2.1 Analysis on predictability
In order to respond to the research question i.e. whether the TEPIX time series is predictable or not, two different methods have been adapted.
2.1.1 Rescaled range analysis (R/S)
With respect to properties of time series with feature of long-‐term memory, several tests have been presented for determination of presence of long-‐term memory in time series. Using rescaled range analysis (R/S) is one the best methods for identifying long-‐term memory. This non-‐ parametric technique has been innovated by Hurst (1951) and it is used for calculation of Hurst exponent (it measures intensity of long-‐term dependency in a time series). This technique is widely utilized in analysis of financial time series. If the market has long-‐term memory, there will significant autocorrelation among observations which have been examined over very long time. Hurst exponent (H) is a statistical criterion that is used for classification of time series and provides a criterion for long-‐term memory. Similarly, it is also known as index of dependence. Accordingly, it can be implied that Hurst exponent (H) is a suitable tool to distinguish a non-‐ random time series from a random series regardless of its distribution. The numerical values of Hurst exponent range from 0 to 1 based on which time series is classified into 3 categories:
1) The value of (𝐻 = 0.5) indicates random series and under this condition the time series values are not correlated.
2) Values (0 < 𝐻 < 0.5) indicates series with mean-‐reverting feature that is so-‐called anti-‐ persistent. The values of series are negatively correlated for all periods at this state.
3) Values (0.5 < 𝐻 < 1) show persistent series. Namely, the next value of series (up or down compared to current value) is probably similar to the current state which denotes persistent process of a time series with long-‐term memory. Under this mode, time series values are positively correlated together.
The Hurst exponent (H) can be calculated by rescaled range analysis (R/S).
For time series (𝑋 = 𝑥!, 𝑥!, 𝑥!, … , 𝑥!) the R/S technique for calculation of Hurst exponent (H) including the following steps:
1) Calculate mean value m
𝑚 =!! ! 𝑥!
!!! (2) 2) Calculate mean adjusted series Y
𝑌! = 𝑥!− 𝑚 (𝑡 = 1,2, … , 𝑛) (3) 3) Calculate cumulative deviate series Z
𝑍! = ! 𝑌!
!!! (𝑡 = 1,2, … , 𝑛) (4) 4) Calculate range series R
𝑅! = max 𝑍!, 𝑍!, … , 𝑍! − min 𝑍!, 𝑍!, … , 𝑍! 𝑡 = 1,2, … , 𝑛 (5) 5) Computation series S (standard deviation):
𝑆! = !! ! (𝑥! − 𝜇)!
!!! 𝑡 = 1,2, … , 𝑛 (6) Here, 𝜇 is the mean of values 𝑥! to 𝑥!.
6) Calculate rescaled range series (R/S) as follows:
(𝑅/𝑆)! = 𝑅!/𝑆! 𝑡 = 1,2, … , 𝑛 (7) Hurst found that (R/S) scales by power-‐law as time increases, which indicates
(𝑅/𝑆)! = 𝑐. 𝑡! (8)
Where, 𝑐 denotes a fixed number, 𝑡 is number of observations, and 𝐻 is called the Hurst exponent.
In practice, R/S diagram should be drawn versus 𝑡 in the mode of vertical and horizontal logarithmic axes (log-‐log) in order to approximate Hurst exponent (H). In this state, slope of regression line is estimator of Hurst exponent (Qian and Rasheed, 2004).
In other words, Eq. (8) can be approximately written as:
𝑙𝑜𝑔(𝑅/𝑆)! = 𝑙𝑜𝑔 𝑐 + H 𝑙𝑜𝑔 (𝑡) (9) In this mode, Hurst exponent (H) can be obtained with estimation of a regression.
2.1.2 Variance ratio test
This test analyze predictability of time series values by comparing the variances resulting from difference of data (returns) along with various time intervals. The main idea of the given test is based on this fact that if returns are not correlated over the time, we should have:
𝑣𝑎𝑟 𝑥!+ ⋯ + 𝑥!!!!! = 𝑞. 𝑣𝑎𝑟(𝑥!) (10) Where, 𝑥! is equal to first-‐order difference of time series 𝑦!, namely we have:
𝑥!= 𝑦!− 𝑦!!!
In one of their studies, Lo and McKinley compered power of variance ratio test with other tests in order to test random walk theory by means of Monte Carlo simulation and concluded that the power of variance ratio test and its flexibility is greater than other tests. Therefore, it can be implied among the other existing techniques, variance ratio test is one of the strongest methods. Lo and McKinley (1988) proposed conventional variance ratio and after them, Chow and Denning (1993) modified test of Lo and McKinley and expressed multiple variance ratio test.
Variance ratio tests are classified according to null hypothesis in 2 versions i.e. 1) individual and 2) joint. As it so far mentioned, these two variance ratio tests were statistical parametric tests. As a result, data distribution should be normal in order to do these tests; namely, sequential changes of data should have normal distribution. If data distribution is not normal, non-‐parametric tests should be employed. Wright (2000) suggested nonparametric variance ratio test (ranks and signs based variance ratio tests) that included 2 major advantages compared to the other tests, particularly when sample size is relatively small.
1) Whereas rank (𝑅! & 𝑅!) and sign (𝑆! & 𝑆!) tests include accurate sampling distribution therefore there is no need to approximation of asymptotic distribution. Most of variance ratio tests were asymptotic tests in former cases so they might have defect or deficiency in small samples.
2) If data are severally abnormal these tests are stronger and more reliable than other tests.
In order to determine predictability of monthly values of price index in this study, both of R/S analytical method and variance ratio test are adapted.
3 RESULTS
3.1 Statistical data analysis
The following table displays descriptive specifications and criteria of monthly values of time series in Tehran Exchange Price Index (TEPIX) during the given years:
Table 1: Descriptive statistics
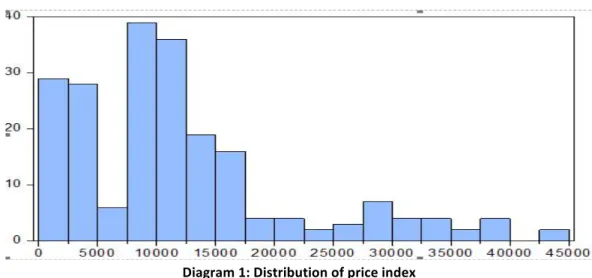
Whereas Jarque-‐Bera probability value (for normality test) is smaller than 0.05 therefore 𝐻! (i.e. normality of series) is rejected and as a result TEPIX time series is abnormal.
Diagram of price index distribution is given in the following:
Diagram 1: Distribution of price index
3.2 Results of R/S method algorithm
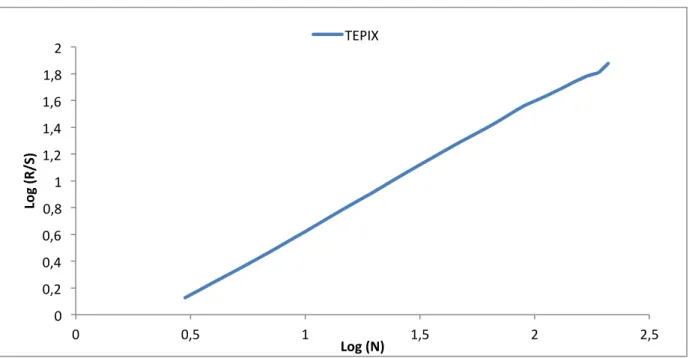
The results of rescaled range analysis for survey of time series indicates that the numerical quantity of Hurst exponent (H) is 0.934 and since it is placed within range of values (0.5 < 𝐻 < 1) thus time series values are positively correlated. Similarly, it denotes process of persistent time series with long term memory. The long term memory indicates strong dependency among distant observations in the time series.
Serie
s Observations Mean Median Maximum Minimum Std. Dev. Skewness Kurtosis
TEPIX 209 12113.01 10042 44319 1484 9551.13 1.319 4.344
Jarque-‐Bera 76.358
Diagram 2: Diagram of R/S analysis
Hurst = 0.9341109
The Hurst exponent is computed in the figure above by slope of a line that is created from plot Log (R/S) against Log (N). Based on this calculation, H (slope) is 0.9341109 in this state.
3.3 Results of variance ratio test
Whereas it was identified TEPIX time series is abnormal, thus non-‐parametric tests should be utilized in order to analyze predictability using variance ratio test.
Table 2: Sign Variance Ratio Test on TEPIX
The given results from sign-‐based variance ratio test suggest that there is no evidence for the given series (and also series of lags) of Martingales (random) processes following to rejection of null hypothesis of this test (i.e. TEPIX is a Martingale) and as a result process of data production is not random in them. For this reason, predictability of this series is revealed.
In addition to the above-‐said results, using rank-‐based variance ratio test shows non-‐ random values of this time series.
4 CONCLUSION
As it implied, various theories have been posited in relevant scientific bases to the subject out of which theory of fractal market and efficient market hypothesis are some of foremost ones.
0 0,2 0,4 0,6 0,8 1 1,2 1,4 1,6 1,8 2 0 0,5 1 1,5 2 2,5 Lo g (R/ S) Log (N) TEPIX Probability df Value Joint Tests 0.000 208 7.7653 Max |Z| (at period 20)
0.000 19
83.7740 Wald (Chi-‐Square)
Based on efficient market hypothesis, prices follow random walk process in stock market. Information is quickly disseminated in such a market and affects in stock price. Thus stock returns may not be predicted according to former changes of prices but during recent decades the fractal market hypothesis have been suggested. In addition to testing efficiency, fractal market hypothesis assesses persistence and potential of financial markets to absorb economic shocks.
The Hurst exponent statistics is used for determining presence of correlation in prices and type of process of their behavior. There are various techniques for calculation of Hurst exponent out of which one is called rescaled range analysis (R/S). Based on this method, if H = 0.5 this means that the data follow an independent Gaussian process but as it visible in research findings, H-‐value differs from 0.5 and it is placed in interval (0.5 < 𝐻 < 1). Namely, previous events influence in future events. Time series possesses fractal property under this condition. Alternately, variance ratio test is one of the strong tests to examine random walk theory where the results of this test did also signify non-‐random nature of monthly values of TEPIX time series.
Therefore it can be mentioned that the results of current study indicate predictability of monthly values of time series for Tehran Exchange Price Index (TEPIX). The comparative analysis has been conducted on results of this study are consistent with some of the given researches in this field such as findings from Norouzzadeh and Jafari (2005) which showed that TEPIX returns possessed long term correlation, and, Afshari (2003) which signified predictability of stock price and reviews of Namazi and Kiamehr (2007) regarding behavior of time series in daily returns of stocks from the listed companies in Tehran stock exchange organization was not a random process and it had memory.
The subject of future studies that can be suggested is to employ other techniques and models for analysis on predictability of exchange rate, stock price in companies, and or international financial indices.
5 REFERENCES
Afshari, H. (2003). “Structural analysis on predictability of stock price TEPIX”, Journal of the Accounting and Auditing Review, 10(32), 103-‐126.
Costa, R. L., & Vasconcelos, G. L. (2003). “Long-‐range correlations and nonstationarity in the Brazilian stock market”. Physica A, (329), 231−248.
Erfani, A. (2008). “Long-‐memory of Tehran Securities price index”. Quarterly Journal of Executive Management, 8(28), 77-‐92.
Greene, M., & Fielitz, B. (1977). “Long Term Dependence in Common Stock Returns”. Journal of FinancialEconomics, 5(4), 339-‐349.
Kim, K., & Yoon, S. (2004). “Multifractal features of financial markets”. PhysicaA, (344), 272−278. Moshiri, S. (2002). “A review on chaos and its applications in economics”. Iranian Journal of
Economic Research, 4(12), 29-‐68.
Morovat, H. (2012). “Testing Fractal Market Hypothesis (FMH) in Tehran Stock”. Quarterly Journal of Securities Exchange, 5(19), 5-‐25.
Namazi, M., & Kiamehr, M. M. (2007). “Predicting Daily Stock Returns of Companies listed in Tehran Stock Exchange Using Artificial Neural Networks”. Journal of Financial Research, 9(24), 115-‐134.
Nikoomaram, H., Saeedi, A., & Anbarestani, M. (2011). “Analysis on long term memory in Tehran stock exchange”. Quarterly of Financial Engineering and Portfolio Management, 3(9), 47-‐63. Norouzzadeh, P., & Jafari, G. R. (2005). “Application of multifractal measures to Teheran price
index”. Physica A, (356), 609−627.
Olan, T. H. (2002). “Long memory in stock returns: some international evidence”. Applied Financial Economics,725-‐729.
Onali, E., & Goddard, J. (2011). “Are European equity markets efficient? New evidence from fractal analysis”. International Review of Financial Analysis, 20, 59-‐67.
Peters, E. (1994). Fractal Market Analysis: Applying Chaos Theory to Investment and Economics, John Wiley & Sons, New York.
Qian, B., & Rasheed, K. (2004). “Hurst Exponent and Financial Market Predictability”. Paper Presented at The LASTED conference on Financial Engineering and Applications (FEA 2004), 203-‐209.