i
A Geographically Weighted Regression Approach
to Investigate Air Pollution Effect on Lung Cancer
A Case Study
ii
NOVA Information Management School
Instituto Superior de Estatística e Gestão de Informação
Universidade Nova de Lisboa
A GEOGRAPHICALLY WEIGHTED REGRESSION APPROACH TO
INVESTIGATE AIR POLLUTION EFFECT ON LUNG CANCER – A CASE
STUDY
byDiogo Oliveira da Luz Cardoso
Dissertation report presented as partial requirement for obtaining the Master’s degree in Geographic Information Systems and Science
Advisor / Co Advisor: Professor Marco Painho Co Advisor: Rita Roquette
iii
DECLARATION OF ORIGINALITY
I declare that the content of this document is my own and not from somebody
else. All assistance received from other people is acknowledged and all sources
(published or not published) are referenced.
This work has not been previously submitted for evaluation at NOVA
Information Management School or any other institution.
Lisbon, February 26 2018
Signature:
iv
DEDICATION
v
ACKNOWLEDGEMENTS
To my advisor, Professor Marco Painho, for all the help he gave me in this course, from the first to the last day, thank you for all the opportunities, trust, support and scientific guidance. To my advisor Rita Roquette, thank you for your time, your sympathy and dedication. To both, I owe you your commitment.
To my friends Alexandra, Bárbara, Belchior, Carlos, Érica, Inês, João, Paulo, Patrícia, Ricardo, Tiago and Vitor.
My favorite geographer, Maggie, we have come a long way since graduation and I cannot thank you for how much I learned from you.
To my family, the most important thing in my life, but especially to my parents, who gave me every opportunity to follow my dreams, this would not be possible without you.
Finally, to Guida goes my biggest thank you, because you were always the first one to read all of my works, for having all the patience in the world, for hearing my outbursts and frustrations, for always having the right words at the right moments. My success is our success.
vi
ABSTRACT
The risk of developing lung cancer might be to a certain extent attributed to tobacco. Nevertheless, the role of air pollution, both form urban and industrial sources, needs to be addressed. Numerous studies have concluded that long-term exposure to air pollution is an important environmental risk factor for lung cancer mortality. Still, there are only a few studies on air pollution and lung cancer in Portugal and none addressing its spatial dimension. The goal was to determine the influence of air pollution and urbanization rate on lung cancer mortality.
A geographically weighted regression (GWR) model was performed to evaluate the relation between PM10 emissions and lung cancer mortality relative risk (RR) for males and females in Portugal between 2007 and 2011. RR was computed with the Besag, York and Mollié (BYM) model. For a more in-depth analysis, the urbanization rate and the percentage of industrial area in each municipality was added.
GWR efforts lead to identify three variables that were statistically significant in explaining lung cancer relative risk mortality PM10 emissions, urbanization rate and the percentage of industrial area with an adjusted R2 of 0,63 for Men and 0,59 for Women. A small set of 8
municipalities with high correlation values was also identified (local R2 above 0,70). Stronger
relationships were found in northwestern part of mainland Portugal. The local R2 tends to be
higher when the emissions of PM10 are joined by the urbanization rate and the percentage of industrial area. However, when assessing the industrial areas alone, it is noted that its impact is lower in the overall results. Being one of the first works on this subject in Portugal, we were able to identify the municipalities where possible impacts of air pollution on lung cancer mortality RR are higher. Thus, it highlights the role of geography and spatial analysis in explaining the associations between a disease and its determinants.
vii
KEYWORDS
Air Pollution
Geographically Weighted Regression Lung Cancer Mortality
Relative Risk PM10
viii
RESUMO
O risco de desenvolver cancro do pulmão pode ser, em certa medida, atribuído ao tabaco. No entanto, o papel da poluição do ar, tanto na forma de fontes urbanas como industriais, precisa ser abordado. Diversos estudos concluíram que a exposição à poluição atmosférica é um importante factor de risco ambiental para a mortalidade do cancro do pulmão. Ainda assim, existem poucos estudos sobre poluição do ar e cancro do pulmão em Portugal e nenhum deles aborda sua dimensão espacial. Com este estudo, o objectivo foi determinar a influência da poluição do ar, em conjunto de uma vertente urbanística, na mortalidade de cancro do pulmão.
Foi desenvolvido um modelo de Regressão Geograficamente Ponderada (GWR) para avaliar a relação entre as emissões de PM10 e o risco relativo da mortalidade por cancro do pulmão para homens e mulheres em Portugal entre 2007 e 2011. O risco relativo foi calculado através do modelo de Besag, York e Mollié (BYM). Para uma análise mais aprofundada, foi adicionada a taxa de urbanização e a percentagem de área industrial em cada município. Os modelos de GWR identificaram três variáveis que foram consideradas estatisticamente significativas na explicação do risco relativo da mortalidade por cancro do pulmão nas emissões de PM10, na taxa de urbanização e na percentagem de área industrial com um R2
ajustado de 0,63 para homens e 0,59 para mulheres. Foi ainda identificado um pequeno conjunto de 8 municípios com altos valores de correlação (R2 local acima de 0,70). Relações
mais fortes foram encontradas na região noroeste do país. O R2 local tende a ser maior
quando as emissões de PM10 são acompanhadas pela taxa de urbanização e pela percentagem de área industrial. Contudo, ao avaliar apenas as áreas industriais, o seu impacto é menor nos resultados globais. Sendo um dos primeiros trabalhos sobre este tema em Portugal, conseguimos identificar os municípios onde possíveis impactos da poluição do ar sobre o risco relativo da mortalidade por cancro do pulmão são maiores. Com isto, destaca-se o papel da geografia e da análise espacial na explicação das associações entre uma doença e seus determinantes.
ix
PALAVRAS-CHAVE
Mortalidade do Cancro do Pulmão Risco Relativo
PM10
Poluição Atmosférica
x
INDEX
Dedication ... iv Acknowledgements ... v Abstract ... vi Keywords ... vii Resumo ... viii Palavras-Chave ... ix 1. Introduction ... 11.1.Objectives and hypothesis ... 3
1.2.The Journal ... 4
2. Literature review ... 5
3. The Article ... 9
3.1.Abstract ... 9
3.2.Introduction ... 10
3.3.Methodology and Data ... 12
3.3.1.Study Area ... 12
3.3.2.Pollution ... 12
3.3.3.Relative Risk ... 13
3.3.4.Urbanization Rate ... 13
3.3.5.Methods of Exploratory Data Analysis ... 14
3.4.Results ... 16
3.4.1.PM10, Urbanization Rate and RR of Lung Cancer Mortality Maps ... 16
3.4.2.Model results ... 18
3.4.3.RR with PM10 Emissions ... 18
xi
3.4.5.RR with PM10 Emissions, Urbanization Rate and Percentage of Industrial Area
... 18
3.4.6.RR with PM10 Emissions and Percentage of Industrial Area ... 18
3.5.Discussion ... 21
3.6.Conclusions ... 22
3.7.References (Article only) ... 23
4. Bibliography (Extra Article) ... 27
xii
LIST OF FIGURES
Figure 2 - Mainland Portugal NUTS level II and Oporto MA ... 12 Figure 2 - PM10 emissions t/km2 ... 16 Figure 3 - Urbanization Rate ... 16 Figure 4 - Lung Cancer Mortality Relative Risk for Women (a) and Men (b) between
2007-2011 ... 17 Figure 5 - Percentage of smokers in mainland Portugal by NUTSII ... 17 Figure 6 - GWR model with PM10 emissions values for Women (a) and Men (b) ... 19 Figure 7 - GWR model with PM10 emissions and urbanization rate values for Women (c) and
Men (d) ... 19 Figure 8 - GWR model with PM10, urbanization rate and percentage of industrial area values
for Women (a) and Men (b) ... 20 Figure 9 - GWR model with PM10 and percentage of industrial area values for Women (c)
and Men (d) ... 20 Annex 1 - Confirmation of article submission at IJHG... 30 Annex 2 - The article waiting for review at IJHG’s website ... 30
xiii
LIST OF ABBREVIATIONS AND ACRONYMS
APA Agência Portuguesa do Ambiente (Portuguese Environment Agency)
DGT Direcção Geral do Território (Directorate-General of Territory)
EEA European Environment Agency
GIS Geographic information System
GWR Geographically Weighted Regression
IARC International Agency for Research on Cancer
IJHC International Journal of Health Geographics
PM Particulate Matter
OLS Ordinary Least Squares
RR Relative Risk
VIF Variance Inflation Factor
1
1. INTRODUCTION
The first steps in what we know today by Geographic Information Systems were given in the search for answers to public health problems. First in 1832 by Charles Picquet, where he mapped cholera deaths in Paris through a color gradient [1]. Twelve years later, John Snow in a similar work, mapped the location of cholera victims in neighborhoods of London [2]. Since then, GIS has helped health authorities to act on epidemics and serious health problems. Nowadays, GIS applied to health and emergency response is an emerging area, with more applications and research work developed within it. A large number of organizations use these tools to improve geographic visualization, to make better and faster decisions, and to share information where it is really needed [3].
The beginning of the Industrial Revolution in the United Kingdom in the 18th century brought about air pollution as a serious problem which has impacted human society since then. Until then, air pollution was limited to volcanic activities, mining and some domestic tasks involving the use of fuels such as coal [4]. There has been a rapid urbanization and industrialization around the world, resulting in large increases in emissions of pollutants from burning fossil fuels. However, this is not a problem that exclusively affects the urban population. In rural areas local populations are exposed to the use of solid fuels such as vegetal, wood and coal, among others [5]. In 2012, the World Health Organization (WHO) estimated that global air pollution (indoor and outdoor) killed 7 million people worldwide (one in eight deaths), a number that has doubled past estimates, making air pollution a major health risk in the world [6].
Causing approximately 8.8 million deaths annually, the various types of cancer have a significant impact on human society. Several studies have been carried out in recent years using GIS or other spatial analysis techniques in an attempt to better understand cancer and how its spatialization can lead to its treatment [7][8][9]. Lung cancer could be one of the main diseases linked to air pollution, the type of cancer that kills the most and the fifth leading cause of death in the world: 1.69 million deaths in 2015 [10]. It was an almost unknown disease at the end of the XIX century and beginning of the XX century. At the time it represented only 1% of all cancers identified in autopsies at the Institute of Pathology at the University of Dresden in Germany in 1878, which rose to about 10% in 1918 and more
2
than 14% in 1927 [11]. Over the course of the century, this number increased and several causes were identified, including increased air pollution due to the higher number of motor vehicles on the roads and exposure to different types of noxious gases during I and II World War (smoking was only associated decades later)[11]. However, studies associating these two factors would only appear in the middle of the XX century, after three major events of air pollution, or smog as they later became known: in 1938 in the Meuse River Valley, Belgium; in 1948 in Donora, Pennsylvania; and the gravest of all, in 1952 in London, which killed about 12,000 people, arousing the authorities to the true consequences of prolonged exposure to harmful material in the air [11].
Given the current economic and social situation, especially the increase in urban areas and a context where economic growth is encouraged, it is to be expected that more and more people will be exposed to air pollution. Thus, it is essential to determine the contribution of risk factors in the development of the disease, so that preventive measures may be implemented. With access to information, people living in high risk areas make pressure on public authorities and stakeholders to act in the name of public health and the environment. It is important to note that by the year 2050, exposure to external air pollution is expected to become the leading cause of premature environmental death in the world [12], overcoming malaria and deaths associated with poor water quality. While everything points to a decrease in deaths because of these two last causes, pollution should continue to make more victims each year. Since air pollution is intrinsically associated with different economic activities, it is crucial to define strategies that can bring together the various stakeholders in order to solve the health effects of air pollution.
As there were very few studies in Portugal that addressed this issue, we thought it would be pertinent to develop an in depth article of air pollution and lung cancer. With an article we can focus on our findings and we can introduce the results to the scientific community, and propose a new approach to the theme.
This thesis is divided in three main chapters. In the first chapter an introduction is made to the thesis, the objectives and the hypotheses are explained. Also, why it was made in an article format and why the article was submitted to the IJHC. In the second chapter, a literature review to the topic is made. An approach to air pollution and lung cancer is
3
addressed separately. Then, the two variables are dealt with together, and a literary review of the theme is done. The issue is also addressed in the Portuguese context. The third chapter includes the article that was submitted to the IJHG. It is divided in 5 sections and includes an Introduction, Methodology and Data, Results, Discussion and Conclusions. For a better organization bibliography was divided into two parts: the first part includes the introduction and revision of the literature (chapter 1 and 2) and can be found on chapter 4; the second part includes all references present in the article and it’s the last part of chapter 3.
1.1. OBJECTIVES AND HYPOTHESIS
The aim of this study is to understand the impact of air pollution in lung cancer in Portugal and thereby investigate the relationship between PM10 and lung cancer mortality RR. Additionally, further spatial variables with potential impact on air pollution will be included in the analysis to obtain deeper knowledge of the impact of urbanization and industrial areas. The aim consists of the following four objectives:
1. Verify the influence of air pollution rate on lung cancer mortality in mainland Portugal;
2. Identify the most susceptible areas through spatial analysis;
3. Apply a GWR to model the relationship between PM10, urbanization rate and percentage of industrial area with lung cancer mortality RR. This will generate a high model performance in order to investigate spatially varying relationships.
4. Identify the municipalities with the highest levels of correlation between the study variables;
5. Evaluate the importance of the urbanization rate and the percentage of industrial area in the model results.
The main hypotheses of this thesis are:
1. PM10 are statistically significant on Lung Cancer Mortality RR in mainland Portugal; 2. Higher correlation values are to be found in both Metropolitan Areas of Portugal;
4
3. Urbanization Rate and Percentage of Industrial Area increase the correlation values.
1.2. THE JOURNAL
The journal chosen as the first choice was the International Journal of Health Geographics, an Open Access journal, with aim on all aspects of geospatial information systems and science applications in health and healthcare [13]. It was chosen due to its speed of publication (24 days from submission to first decision and 14 days from acceptance to publication), flexibility and coverage. At present health geographics papers are offered very little room, priority and recognition in peer reviewed journals dealing with medical informatics, public health, statistics or GIS in general. They are not specifically focused on the broader spectrum of geospatial information science in health and healthcare, and are at best journals of social medicine, public health, planning and policy with an emphasis on the concept of place. IJHC is filling this serious gap in existing journals by providing a credible central venue for researchers and practitioners to publish their health geographics research [13]. Its Citation Impact is 3.282 (2-year Impact Factor) and 3.199 (5-year Impact Factor). The article was submitted to the journal on February 23 and approved for review on the next day (Annex 1 and 2).
5
2. LITERATURE REVIEW
Several studies have shown the link between particulate and gaseous pollutants emitted by different sources, and the symptoms of respiratory diseases and the consequent demand for health services and hospitalizations [5]. Although smoking is the major cause of lung cancer (about 90% of cases in men and 55% to 80% of cases in women are attributed to cigarette smoking [14]), air pollution is also identified as an important cause of the disease. Since the 80’s, several epidemiological studies reported health effects at surprisingly low concentrations of particulate air pollution [15]. The convergence of all the data from these studies, although controversial, encouraged serious review and health guidelines and led to a long-term research program designed to analyze health-related effects due to particulate pollution [16] [17]. Even though some authors claim that given this high percentage of tobacco-related cases it is difficult to carry out studies proving other factors that cause the disease [18], more recently a large number of studies conducted in various parts of the world have concluded that long-term exposure to air pollution is an important environmental risk factor for lung cancer mortality and other respiratory diseases [19] [20] [21] [22]. Estimates for 2010 indicated that of the total deaths in the world from lung cancer, around 223,000 (about 13% of the total) were directly related to air pollution [23]. Even though the relative risk of developing cancer as a result of exposure to air pollution is low, the attributed risk (the relative risk multiplied by the number of exposed persons) is high, making air pollution the most significant environmental risk for lung cancer [24].
Carcinogens1 generated by the combustion of fossil fuels include polycyclic aromatic
hydrocarbons and metals, such as arsenic, nickel and chromium. The constituents of air pollution vary by location, time and sources of pollution. Particulate matter (PM) presents the most serious risks because there is no evidence of a safe level of exposure or a threshold below which no adverse health effects occur [25]. PM has the ability to penetrate the lungs and bloodstream without being filtered, causing permanent DNA mutations, heart attacks, severe respiratory problems, and premature death [26]. PM are fine, liquid or solid particles that are suspended in the atmosphere, ranging in size from 2.5 to 10 micrometers (μm), and may be of natural or human origin. Due to their small size, particles smaller than 10 microns
6
(PM <10 μm) can penetrate deeper parts of the lungs, such as the alveoli or bronchioles [26]. Thus, although these do not represent a clear boundary between what is potentially dangerous or not, most health and environmental agencies tend to monitor particles of this size - larger particles are more likely to be filtered through the nose or throat. As the humans inhale about 10 000 liters of air per day, it makes the pollutant present in the air, even at low concentrations a risk factor for the development of cancer [27].
At the European level, a study with a sample of approximately 313,000 people showed that each 10 μg / m³ increase in PM10 increased the lung cancer rate by 22% while at each 10 μg / m³ increase in PM 2.5 increased the rate by 36% [28]. Gharibvand et al. [29] conducted a study in the USA with mostly non-smokers and healthy people, and observed estimates of higher risk of lung cancer in people living near places with high PM 2.5 values. The estimated values were higher among those with prolonged residence at the original address and those who spent more than 1 hour per day outdoors. Similar results were found by Turner et al. [30] where people who have never smoked, but who live in areas with higher air pollution levels, are approximately 20 percent more likely to die from lung cancer than people who live in areas with cleaner air. It also states that Lung cancer in never smokers is the sixth leading cause of cancer in United States [30].
In China, one of the countries with the highest mortality rate in the world [31] and where recent industrial expansion has increased pollution levels in a drastic way, a study covering 75 communities using the data from the National Cancer Registry of China showed once again that the high mortality of lung cancer is related to PM 2.5 and also to ozone pollution [32]. Others studies on the link between lung cancer and particulate pollution are receiving increasing attention as the air quality deteriorates in China [33] [34].
In some cases, nitrogen oxides (NOx) increase cancer mortality as shown in a study conducted in Denmark in 2011 [35] where patients living in locations with high concentrations of these chemical compounds (in this case, near roads with ADT2 > 10,000)
were more likely to contract the disease. The association was higher in non-smokers than smokers. However, nitrogen oxides do not appear to be as significant as PMs [35]. The same scenario occurs with Ozone (O3) [36] [37]. Diesel smoke, a result of the combustion of diesel
2 Average Daily Traffic
7
fuel, also increases the risk of lung cancer mortality. In a study in mines where workers are exposed to this type of pollution, the risk increased significantly in miners who worked underground, especially those with more than 5 years' stay, and there is also an increasing trend in the risk of worker mortality with longer exposure periods [38].
Even when lung cancer diagnosis has been closely tied to exposure to tobacco smoke, air pollution can still play a major role on survival rates and time. A study by Eckel et al [39] shows that the length of time that lung cancer patients live after diagnosis varies depending on their exposures to air pollution. The median survival for patients diagnosed with lung cancer that lived in areas with high levels of NO₂, O₃, PM2.5 and PM10 was 3 times shorter than other patients living in areas with lower levels of air pollution. Survival times after lung cancer diagnosis can be quite short, and few studies have attempted to unscramble the two, but additional research is needed to determine a possible relation between air pollution and lung cancer survival rates [39].
The use of a geographic approach with remote sensing can help to fill in data gaps that hamper efforts to study air pollution. A study by Hu & Baker [40] showed that there is a significant positive association between mortality from this type of cancer and PM 2.5. This result was achieved using data from the MODIS satellite sensor and MISR Annual Global Grid PM 2.5 data [40], which allowed to calculate an average of 10 years of PM 2.5 pollution, which were combined with data from deaths from lung cancer and the population at risk by county in the USA between 2001 and 2010. Despite the statistically significant association between lung cancer mortality and PM 2.5 may be indicative of a potential effect of air pollution, the authors suggest that the same association would require a toxicological approach in order to observe the adverse biological mechanism of PM2.5 pollution [40]. Other studies have been carried out using GWR models [41] [42] or other spatial analyst tools [43] [44]. The study of the spatial epidemiology of cancer has been researched with more significance during the last decade [45].
With the available study results, in 2013, the International Agency for Research on Cancer (IARC) classified air pollution as a carcinogen to humans, being included in group 1, a category used "when there is strong evidence of carcinogenicity in humans, or exceptionally, an agent may be placed in this category when the evidence of carcinogenicity in humans is
8
less but there is sufficient evidence of carcinogenicity in experimental animals and strong evidence in exposed humans where the agent acts through a relevant carcinogenicity mechanism" [21].
The Air Quality Report for 2016 estimated 6640 deaths from air pollution in Portugal [46]. In the same report it is mentioned that Portugal should reduce emissions of nitrogen oxide and ozone concentrations, especially in urban areas. It also addresses the excessive use of individual transport as the main aggravating factor for air quality problems and responsible for the high levels of air pollution in the cities of Lisbon and Oporto. The Portuguese Environment Agency (APA) also identifies emissions from road vehicles as one of the main sources of PM, highlighting "the combustion of biomass by the domestic sector (burning of fuels such as wood and coal)" [47]. However, there are satisfactory indicators in some points, such as PM2.5 values (lower than those recommended by the WHO) and one of the sharpest decreases in PM10 [46], as well as a downward trend in the remaining pollutants under analysis [47]. There are only a few studies on the relationship between lung cancer and air pollution in Portugal [48].
9
3. THE ARTICLE
A Geographically Weighted Regression Approach to Investigate Air
Pollution Effect on Lung Cancer – a case study
Diogo Oliveira da Luz Cardoso ([email protected]); Marco Octávio Trindade Painho ([email protected]); Rita Roquette ([email protected]).
3.1. ABSTRACT
Background: The risk of developing lung cancer might be to a certain extent attributed to
tobacco. Nevertheless, the role of air pollution, both form urban and industrial sources, needs to be addressed. Numerous studies have concluded that long-term exposure to air pollution is an important environmental risk factor for lung cancer mortality. Still, there are only a few studies on air pollution and lung cancer in Portugal and none addressing its spatial dimension. The goal was to determine the influence of air pollution and urbanization rate on lung cancer mortality.
Methods: A geographically weighted regression (GWR) model was performed to evaluate
the relation between PM10 emissions and lung cancer mortality relative risk (RR) for males and females in Portugal between 2007 and 2011. RR was computed with the Besag, York and Mollié (BYM) model. For a more in-depth analysis, the urbanization rate and the percentage of industrial area in each municipality was added.
Results: GWR efforts lead to identify three variables that were statistically significant in
explaining lung cancer relative risk mortality PM10 emissions, urbanization rate and the percentage of industrial area with an adjusted R2 of 0,63 for Men and 0,59 for Women. A
small set of 8 municipalities with high correlation values was also identified (local R2 above
0,70). Stronger relationships were found in northwestern part of mainland Portugal.
Conclusions: The local R2 tends to be higher when the emissions of PM10 are joined by the
urbanization rate and the percentage of industrial area. However, when assessing the industrial areas alone, it is noted that its impact is lower in the overall results. Being one of the first works on this subject in Portugal, we were able to identify the municipalities where possible impacts of air pollution on lung cancer mortality RR are higher. Thus, it highlights the role of geography and spatial analysis in explaining the associations between a disease and its determinants.
10
3.2. INTRODUCTION
The beginning of the Industrial Revolution in the United Kingdom in the 18th century brought about air pollution as a serious problem which has impacted human society since then. Until then, air pollution was limited to volcanic activities, mining and some domestic tasks involving the use of fuels such as coal [1]. There has been a rapid urbanization and industrialization around the world, resulting in large increases in emissions of pollutants from burning fossil fuels. However, this is not a problem that exclusively affects the urban population. In rural areas local populations are exposed to the use of solid fuels such as vegetal, wood and coal, among others [2].
Several studies have shown the link between particulate and gaseous pollutants emitted by different sources, and the symptoms of respiratory diseases and the consequent demand for health services and hospitalizations [2]. In 2016, the World Health Organization (WHO) estimated that global air pollution (indoor and outdoor) killed 7 million people worldwide (one in nine deaths), a number that has doubled past estimates, making air pollution a major health risk in the world [3].
One of the main diseases linked to this type of pollution could be lung cancer, the type of cancer that kills the most and the fifth leading cause of death in the world: 1.69 million deaths in 2015 [4]. It was an almost unknown disease at the end of the XIX century and beginning of the XX century. At the time it represented only 1% of all cancers identified in autopsies at the Institute of Pathology at the University of Dresden in Germany in 1878, which rose to about 10% in 1918 and more than 14% in 1927 [5]. Over the course of the century, this number increased and several causes were identified, including increased air pollution due to the higher number of motor vehicles on the roads and exposure to different types of noxious gases during I and II World Wars (smoking was only associated decades later)[5]. However, studies associating these two factors would only appear in the middle of the XX century, after three major events of air pollution, or smog as they later became known: in 1938 in the Meuse River Valley, Belgium; in 1948 in Donora, Pennsylvania; and the gravest of all, in 1952 in London, which killed about 12,000 people, arousing the authorities to the true consequences of prolonged exposure to harmful material in the air [5]. Even though some authors claim that given the high percentage of tobacco-related cases it is difficult to carry out studies proving other factors that cause the disease [6], numerous studies conducted in various parts of the world have concluded that long-term exposure to air pollution is an important environmental risk factor for lung cancer mortality and other respiratory diseases [7] [8] [9] [10]. Estimates for 2010 indicated that of the total deaths in the world from lung cancer, around 223,000 (about 13% of the total) were directly related to air pollution [11]. Even though the relative risk of developing cancer as a result of exposure to air pollution is low, the attributed risk (the relative risk multiplied by the number of exposed persons) is high, making air pollution the most significant environmental risk for lung cancer [12]. With the available study results, in 2013, the International Agency for Research on Cancer (IARC) classified air pollution as a carcinogen to humans, being included
11
in group 1, a category used "when there is strong evidence of carcinogenicity in humans. Exceptionally, an agent may be placed in this category when the evidence of carcinogenicity in humans is less but there is sufficient evidence of carcinogenicity in experimental animals and strong evidence in exposed humans where the agent acts through a relevant carcinogenicity mechanism" [11].
Given the current economic and social situation, especially the increase in urban areas and a context where economic growth is encouraged, it is to be expected that more and more people will be exposed to air pollution. Thus, it is essential to determine the contribution of risk factors in the development of the disease, so that preventive measures may be implemented. With access to information, people living in high risk areas make pressure on public authorities and stakeholders to act in the name of public health and the environment. It is important to note that by the year 2050, exposure to external air pollution is expected to become the leading cause of premature environmental death in the world [13], overcoming malaria and deaths associated with poor water quality. While everything points to a decrease in deaths because of these two last causes, pollution should continue to make more victims each year. Since air pollution is intrinsically associated with different economic activities, it is crucial to define strategies that can bring together the various stakeholders in order to solve the health effects of air pollution.
The Air Quality Report for 2016 estimated 6640 deaths from air pollution in Portugal [14]. In the same report it is mentioned that Portugal should reduce emissions of nitrogen oxide and ozone concentrations, especially in urban areas. It also addresses the excessive use of individual transport as the main aggravating factor for air quality problems and responsible for the high levels of air pollution in the cities of Lisbon and Oporto. The Portuguese Environment Agency (APA) also identifies emissions from road vehicles as one of the main sources of PM, highlighting "the combustion of biomass by the domestic sector (burning of fuels such as wood and coal)" [15]. However, there are satisfactory indicators in some points, such as PM2.5 values (lower than those recommended by the WHO) and one of the sharpest decreases in PM10 [14], as well as a downward trend in the remaining pollutants under analysis [15].
The objective of this study is to investigate the relation between the relative risk (RR) of lung cancer mortality in mainland Portugal at 2007-2011 and air pollution. Through a spatial analysis, we intend to identify municipalities and regions where air pollution has more impact on the RR of lung cancer mortality. Using the urbanization rate and the percentage of industrial area we intend to assess if the source of the pollutants affects the results or not. This article is organized in 5 sections. Section 1 (Introduction) introduces the background of this study, and includes a review of the theme and the situation in Portugal; section 2 (Methodology and Data) consists of three parts (i) delimitation of the study area, (ii) data acquisition and procedures and (iii) methods of data analysis; section 3 includes results;
12
section 4 a discussion about the study and its findings and section 5 presents the conclusions.
3.3. METHODOLOGY AND DATA
3.3.1. Study Area
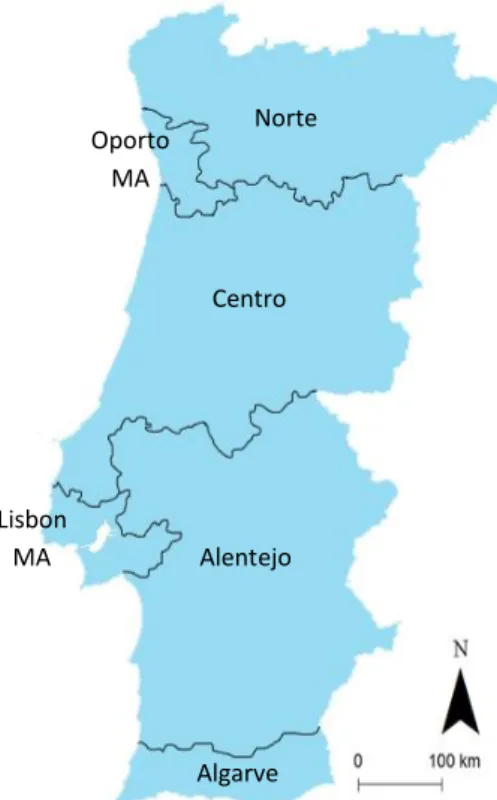
The model was built for mainland Portugal with data from the 2016 Official Administrative Charter of Portugal (CAOP) and it includes all of its 278 municipalities, the second-level administrative subdivision of Portugal. For data analysis purpose NUTS level II is also used (figure1).
3.3.2. Pollution
We focus on the PM10 approach given the various studies that have linked it to lung cancer and because it is defined as a carcinogenic agent with sufficient evidence in humans [16]. Other agents like nitrogen dioxide, diesel and arsenic are also identified with carcinogenic capabilities [16] but they were not included in this study due to lack of data for Portugal. At first, the pollution data used were provided by the European Environment Agency (EEA) on its website3, based on the values of the stations around mainland Portugal managed by
the APA and some in Spain along the Portuguese border. These values referring to the concentration of PM10 in μg / m3, although reliable, were not homogeneous at a temporal
3 https://www.eea.europa.eu/data-and-maps/data/airbase-the-european-air-quality-database-7 Norte Centro Alentejo Algarve Lisbon MA Oporto MA
13
level. Many stations only had values for just a few years, and many of the interior municipalities didn’t have a nearby station that would serve as reference, leading to the concentration of data on coastal and urban areas.
Therefore we worked with the APA report where the values of PM10 per municipality were available for 2009 [17]. These values are represented in ton per square kilometer (t/km2) and
include natural sources (the difference between the inclusion of natural sources and its exclusion is practically nil). The majority of the literature works with values in μg/m3 [18]
[19], but since the values on the report are from 2009, that is, the middle of our temporal analysis (between 2007 and 2011), and encompass all the municipalities of mainland Portugal, we chose to work with these values in order to guarantee a better consistency of the results and consequently a more accurate analysis. It is important to make a distinction between the emissions and atmospheric concentrations of PM: emissions refer solely to the emission of particulate matter by sources like industry, traffic or agriculture. The concentrations, most often expressed as micrograms per cubic meter (μg / m³) in open air are determined by those emissions and meteorological conditions. There is, however, no linear relation between the emissions and the concentrations of particulate matter [20].
3.3.3. Relative Risk
Lung cancer mortality data were made available as Relative Risk (RR) by municipality, for males and females. RR, one of the standard measures in biomedical research [21], means the multiple risk of outcome in a given group compared to another group, and is expressed as the risk ratio in cohort studies and clinical trials. RR is often used in the statistical analysis of binary results where the outcome of interest has a relatively low probability [21]. In this study the RR was calculated using the Bayesian model of Besag, York and Mollie, a model often used to estimate spatial risk patterns in the hierarchical mapping of diseases [22]. This method appears as the best option when the disease is specific enough. Some fluctuations that may arise in smaller counts imply that maps based only on raw data may be difficult to interpret and misleading. There are advantages in applying some form of smoothing, which may or may not involve a spatial component and provide point and interval estimates for hazards [23]. The model is based on the Poisson regression, where the observed cases are the dependent variable, the expected cases compensated and two types of terms of random effects that take into account both spatial continuity and spatial heterogeneity [24].
In the model construction, we adopt “Besag” model, “Laplace” option and neighborhood based on spatial contiguity.
3.3.4. Urbanization Rate
For the urbanization rate, we used the Land Use and Occupancy Chart (COS) of 2010, made available by the Directorate-General of Territory (DGT) [25]. The level one class was used -
14
Artificial Territories - and all its sub-classes, except the sub-class 1.4.1 corresponding to urban green spaces. Then, the percentage of artificial land use was calculated for all the municipalities of the country, using the following formula:
where is the urbanization rate, is the artificialized area of each municipality and the total area of each municipality. Afterwards the urban area was divided into two: urban area
per se and industrial area. The urban area includes the following subclasses: continuous
urban fabric (1.1.1), discontinuous urban fabric (1.1.2), road and rail networks and associated spaces (1.2.2), port areas (1.2.3) and airports (1.2.4). In the industrial areas the following classes were encompassed: industry (1.2.1.01), energy production infrastructures (1.2.1.05), opencast mines (1.3.1.01), quarries (1.3.1.02), landfill sites (1.3.2.01) and dumps and scrap yards (1.3.2.02). The aim was to separate the continuous and discontinuous urban fabric and the transport networks from the industrial areas and the production and extraction of aggregates sites, potentially more polluting.
3.3.5. Methods of Exploratory Data Analysis
Exploratory data analysis methods were applied to consider spatial autocorrelation within spatial data. The first approach involved the computation of Ordinary Least Squares (OLS) and Moran's I. Moran's I is widely used in Geographic Information Systems (GIS), having a rather large usefulness in the geographical analysis of variables in health and epidemiology [26] [27]. It serves as a complement to a cluster analysis, since the existence of a geographical pattern may indicate that another geographical phenomenon may explain the events under study. The OLS, a linear regression model, shows the deviation of the actual results from the expected results. However, it presents some limitations, especially with regard to the spatial question, since it uses a single equation for all geographic areas [28]. To explore the local spatial heterogeneity of the potential relations relationships between PM10 and lung cancer, the Geographically Weighted Regression (GWR) model appears as the best option. Unlike the OLS, the GWR defines a different equation for each of the geographical areas as it takes into account the local geographic variation [28], since a relation (or pattern) that is applied to one area does not necessarily apply to the rest [29]. However, OLS can be a good tool to indicate a potential problem with global or local multicollinearity: if the Variance Inflation Factor (VIF) value for each explanatory variable is large (above 7,5), global multicollinearity is preventing GWR from a good performance [30]. Using GWR, each data point is a regression point that is weighted by the distance of the point itself. A spatial kernel map fits the data, and a kernel bandwidth indicates the distance beyond which neighboring regions no longer have an influence on local estimates [31]. The GWR is then an improvement of the classical regression models [32]. The general formula of a GWR model can be written as [33]:
15
where represents the dependent variable, and are the intercept and slope coefficients at location i, the independent variable and random errors. GWR extends the global regression technique by allowing local parameters to be estimated, instead of global, therefore making it possible to model regional variations within the data [34]:
where are the coordinates for every ith point in space, allowing a continuous surface
of parameter values. An important aspect of GWR is that spatial autocorrelation is present within the sampled data. As a result, it is assumed that data near point i will have more influence regarding the estimation of the continuous function at point i than data further away from i. This method has a high importance because it addresses one of the fundamental principles of geographical analysis: to evaluate the possibility of spatial variability in the statistical models [29]. The choice of bandwidth tends to be very demanding, since "n" regressions can be used at each step [35]. In the development of this model, an adaptive kernel type was used instead of a fixed type. With the adaptive type, the bandwidth distance will change according to the spatial density of each feature in its input. The bandwidth thus becomes a function of the number of the closest neighbors, each local estimate being based on the same number of features. Instead of a specific distance, the number of neighbors used for the analysis is taken into account [35].
For the analysis of the GWR models we used the adjusted R2 results. R2 assumes that each
variable explains the variation in the dependent variable, also indicating the percentage of variation explained only by the independent variables that actually affect the dependent variable. The adjusted R2 value is always lower than R2, as it reflects the complexity of the
model (the number of variables) relative to the data. As so, the adjusted value of R2 is a
more accurate and reliable measure of a model performance [27]. Therefore, this measure was taken into account in the analysis of the data obtained through the OLS and GWR model. As there are considerable differences in the values obtained by both methods, given the differences used in solving the spatial issues mentioned in the Methodologies, we will only address the results obtained through GWR.
As for the individual analysis of each municipality, the chosen method of analysis fell on the local R2. The local R2 in the GWR model indicates how well the local regression model fits the
observed values of y. Very low values indicate that the local model performs poorly and may need more variables to better explain the causes. On the other hand, higher values indicate a causal relationship. Mapping the local R2 values to see where the GWR predicts well and
16
where it predicts poorly can provide clues about important variables that may be lacking in the developed model.
All results were determined by Geographically Weighted Regression modeling tool within the ESRI’s ArcGIS Software.
3.4. RESULTS
3.4.1. PM10, Urbanization Rate and RR of Lung Cancer Mortality Maps
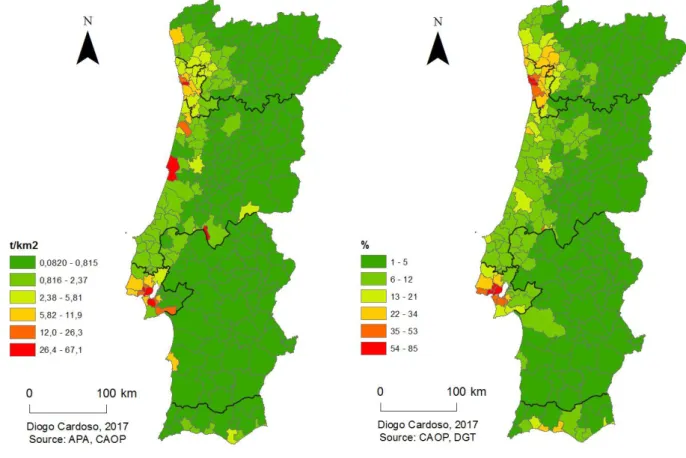
Figure 2 shows the map with the emission values of PM10 t/km2 in mainland Portugal. There
is a clear distinction between coastal areas and the interior, particularly in the two main urban centers and more densely populated areas of the country. This map almost coincide with the map with the urbanization rate (figure 3), where the regions with the highest percentage of urbanized area correspond to the two metropolitan areas. Regarding lung cancer mortality RR (figure 4), there are several differences between males and females. Although both exhibit high values in the two metropolitan areas, they differ in some parts of the country: the values for Women are smaller in the interior, except in some municipalities
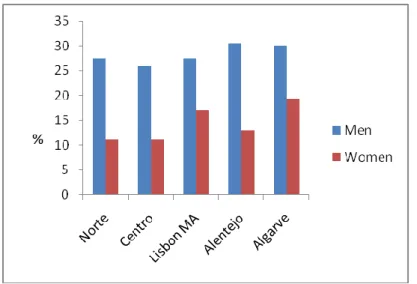
in the Centro region, while in Men these values are higher in particular in the southern regions (Alentejo and Algarve). A comparison with the data on the percentage of smokers in Portugal is only available at the NUTS II level (figure 5). The regions with the highest percentage of male smokers match with those where the mortality RR values are higher in
17
the southern regions; in women, this percentage is higher in Lisbon MA, where mortality RR values are also higher and in the South. It should be noted that given the considerable size of the administrative regions at which variables are available, a more precise spatial analysis is difficult, so they should be seen only as a complement to the analysis. For instance, in the Norte region, there is a considerable difference in mortality RR between the coastal area and the interior of the region, but it’s not possible to make a detailed analysis regarding the percentage of smokers.
Figure 4. Lung Cancer Mortality Relative Risk for Women (a) and Men (b) between 2007-2011.
Figure 5. Percentage of smokers in mainland Portugal by NUTSII. Source: INE, 2014
18
3.4.2. Model results
In our study VIF results for each variable were: 1,323011 for the PM10 emissions, 1,655088 for the urbanization rate and 1,072336 for the industrial area which indicates that the model will not be affected by multicollinearity.
3.4.3. RR with PM10 Emissions
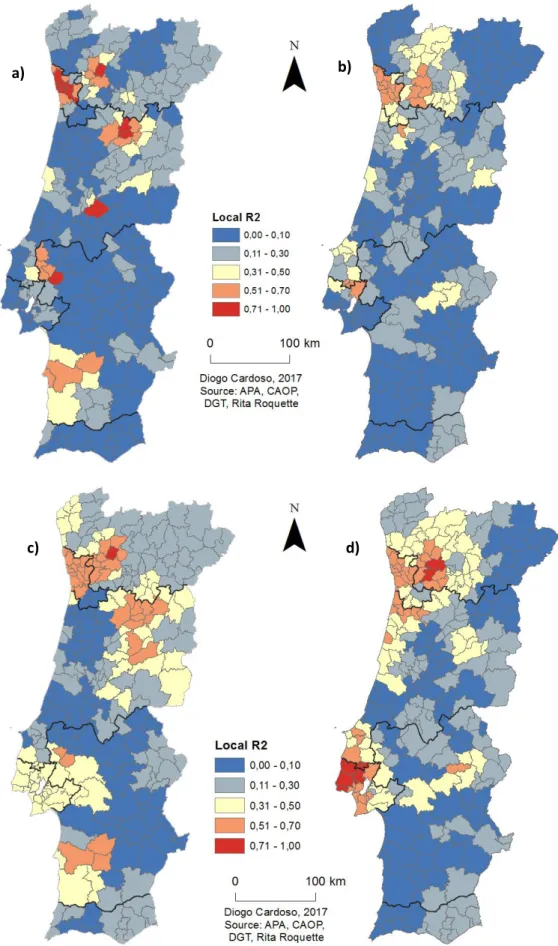
The first map, with only PM10 emissions variable (figure 6) had an overall adjusted R2 result
of 0,62 for Men and 0,58 for Women, that is, this model tends to be successfully predicting about 64% of the mortality RR variability in Men and 59% in Women. However, when this map is overlaid with the RR map (figure 3) we find some differences: looking at the values of Men there is an area to the southeast with high RR values that doesn’t have the correspondence with PM10 values. On the other hand, there seems to exist a relation in the northwest area, were both maps have higher values. In women, the highest values are scattered, but as in Men, they are more concentrated to the northwest, so as the RR values.
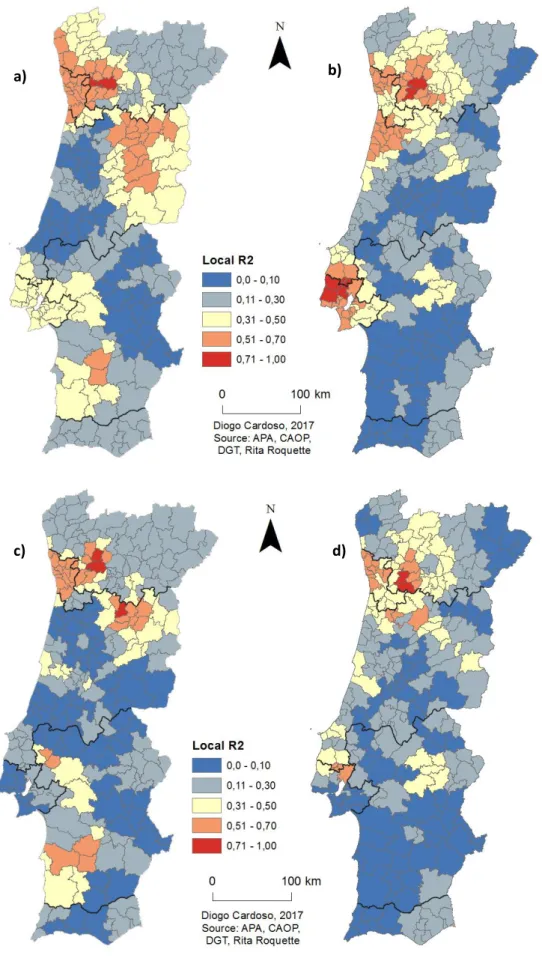
3.4.4. RR with PM10 Emissions and Urbanization Rate
In this case (figure 7), the model tends to be successfully predicting about 65% of the relative risk variability in Men and 58% in Women, a similar result as the situation before: an adjusted R2 of 0,65 and 0,59 respectively. Concerning Men, the map reveals higher values in
both metropolitan areas and its surroundings, but the southeast hotspot remains without relationship with the variables under analysis. The values of Women are again higher in the coastal north region, with a cluster in the central north region. Values around Lisbon MA are lower than the previous model. With these two variables, 18% of the municipalities have values above 0,50 for Men and 15% for Women.
3.4.5. RR with PM10 Emissions, Urbanization Rate and Percentage of Industrial Area
The industrial area was separated from urban area (figure 8), which now only includes continuous and discontinuous urban area, and the transport infrastructures. Adjusted R2
values are 0,59 for Women and 0,63 for Men. Regarding Men, higher values are found in both metropolitan areas, but in Women they’re between 0,30 and 0,50 in Lisbon MA. Using these variables, 20% of municipalities have values above 0,50 in both Men and Women. Also, in Men 3% of the municipalities have values above 0,70.
3.4.6. RR with PM10 Emissions and Percentage of Industrial Area
With the objective of measure the possible impact of industry, quarries and aggregates extraction sites on mortality RR values (in particular the hotspot in Southeast region in Men’s RR) the urban area was separated from the industrial area (figure 9). With this model we are faced with a low percentage of the municipalities with a local R2 above 0,50: only 8%
of municipalities in Men and 13% in Women, and an adjusted R2 of 0,48 and 0,46
respectively, the lowest result taking into account all the variables.
19
Figure 6 and 7. GWR model with PM10 emissions values for Women (a) and Men (b); GWR model with
PM10 emissions and urbanization rate values for Women (c) and Men (d).
a) b)
20
Figure 8 and 9. GWR model with PM10, urbanization rate and percentage of industrial area values
for Women (a) and Men (b). GWR model with PM10 and percentage of industrial area values for Women (c) and Men (d).
a) b)
21
3.5. DISCUSSION
The results of this study are in line with the hypotheses initially set. The highest values of correlation are mainly concentrated around the two metropolitan areas of the country, which are the regions with higher PM10 emissions, urbanization rate and percentage of industrial area. Nonetheless, those values are higher in the northwestern part of mainland Portugal. It was expected that some of the values of lung cancer mortality RR (figure 4) were not related to those obtained in the GWR models mainly in the southern regions, since smoking is the major cause of lung cancer (about 90% of cases in men and 55% to 80% of cases in women are attributed to cigarette smoking [36]). And, even though air pollution is also identified as an important cause of the disease its impact is expected to be lower. The GWR results between the percentage of industrial area and lung cancer mortality RR represent a lower correlation than the other two variables. A more detailed analysis is necessary in this matter, but this may mean that the impact of the industries is smaller in the emission of PM10, and its origin can have more expression in motor vehicles. As mentioned in the introduction, the use of individual transport is one of the main aggravating factors for the high levels of air pollution in the both metropolitan areas [14]. The use of urbanization rate is not new in the study of lung cancer mortality, but they tend to have a focus on rural– urban differences and socioeconomic aspects [37] [38], a different approach from that carried out in this study.
The use of a geographic approach with remote sensing can help to fill in data gaps that hamper efforts to study air pollution. A study by Hu & Baker [39] showed that there is a significant positive association between mortality from this type of cancer and PM 2.5. This result was achieved using data from the MODIS satellite sensor and MISR Annual Global Grid PM 2.5 data [39]. Regardless the statistically significant association between lung cancer mortality and PM 2.5 may be indicative of a potential effect of air pollution, the authors suggest that the same association would require a toxicological approach in order to observe the adverse biological mechanism of PM2.5 pollution [39]. The model developed in this study yielded satisfactory results and is in line with other similar studies using GWR models [40] [41], or other spatial analyst tools [42] [43]. Despite the fact that the study of cancer’s spatial epidemiology has had a greater emphasis in the last decade [44], there are only a few studies on the relationship between the lung cancer and air pollution in Portugal [45]. This study represents one of the first to use RR mortality data along with spatial regression analysis tools to explore a possible relation between both factors in mainland Portugal. One of the advantages of using GWR is that it accounts for spatial autocorrelation in the residuals that is usually found in global modeling. Further, it is possible that a variable that is insignificant at the global level might be important locally [46]. When relationships are consistent across a study area, an OLS model fits neatly into these relationships; it creates equations that best describe general relationships of data in each area. But it’s not always like that, so often these relationships have different behaviors throughout space. When the exploratory variables exhibit non-stationary relationships (regional variation), the model
22
tends to fail, unless robust models adapted to this problem are applied. The GWR model addresses precisely this issue [30].
Identifying causes and effectively addressing them can lead to significant savings in health spending. With the implementation of rigorous legislation on gaseous emissions, health expenditure directly linked to air pollution in Europe has been decreasing. It is estimated that from € 803 billion spent in 2000, it will decrease to € 537 billion in 2020 [47]. The convergence of the many studies carried out so far has led to a reconsideration and updating of health standards and guidelines, leading to new long-term research programs in order to analyze the effects of particulate pollution on health [47]. However, it is known that these changes always have economic and social impacts, sometimes facing great opposition in certain sectors of society.
Our results sustain the hypothesis that air pollution might be a risk factor for lung cancer. Indeed, it indicates a higher lung cancer mortality RR among municipalities where both urban and industrial areas are also superior. It demonstrated the benefits of GWR, both in respect to model performance and by allowing spatial analysis of the data. Lung Cancer mortality RR was found to be heterogeneously related to human factors at the municipality level in mainland Portugal. Our findings may assist local authorities when assessing risks and by helping public health entities allocate resources and address the issue according to specific conditions of each region.
3.6. CONCLUSIONS
The goal of this study was to explore the association between PM10 emissions and lung cancer mortality RR in municipalities across mainland Portugal. There is no clear homogeneous pattern spread. The relation between PM10, urban area and industrial areas and lung cancer mortality rates varies spatially, and there are other agents that may influence the lung cancer mortality rate in different areas of mainland Portugal, but we can say that it has a focus on the two metropolitan areas. There are several municipalities that tend to show values always above 0,50 in all models which represents a positive relation. It is pertinent to state that the emission of PM10 as the urbanization rate and percentage of industrial area affect the lung cancer mortality RR values on those municipalities. The relation of lung cancer turns out to be higher when the emissions of PM10 are joined by the urbanization rate and the percentage of industrial area (value of 0,63 for Men and 0,59 for Women). However, when assessing the industrial areas alone, it is noted that their impact is lower in overall results (0,48 for men and 0,46 for Women).
Spatial variation in the relations between lung cancer RR and air pollution means that in some places PM10 and urbanization rate has a greater effect on mortality than in other places. In the municipalities where the values are high local authorities should step in to minimize the effects of air pollution and to carry out better planning in order to benefit the
23
public health of the local populations. We should note that the problem is complex and that further investigation is needed for a full understanding of this issue.
With this research, our objective was not to find the municipalities where people are most likely to die from lung cancer, but rather to assess the impact of the PM10 emissions in each municipality and to understand the influence of the urbanization rate and the percentage of industrial area in these values. Furthermore, including two variables that address the land usemay be a new method of approaching this subject and generate a more realistic model. As a result, this study contributes to the knowledge on the effects of air pollution on lung cancer and on the use of local spatial analyses in epidemiological studies. Such information can be used in urban planning to reduce air pollution.
3.7. REFERENCES (ARTICLE ONLY)
1. Stern AC: Fundamentals of air pollution: Elsevier; 2014.
2. Arbex MA, de Paula Santos U, Martins LC, Saldiva PHN, Pereira LAA, Braga ALF: A
poluição do ar e o sistema respiratório. Jornal Brasileiro de Pneumologia 2012, 38(5):643-655.
3. World Health Organization: Ambient air pollution: A global assessment of exposure
and burden of disease. 2016.
4. World Health Organization: Global health observatory (gho) data: Top 10 causes of
death. In.: Retrieved; 2017.
5. Witschi H: A short history of lung cancer. Toxicological sciences 2001, 64(1):4-6. 6. Zamboni M: Epidemiologia do câncer do pulmão. J Pneumol 2002, 28(1):41-47. 7. Pope III CA, Burnett RT, Thun MJ, Calle EE, Krewski D, Ito K, Thurston GD: Lung
cancer, cardiopulmonary mortality, and long-term exposure to fine particulate air pollution. Jama 2002, 287(9):1132-1141.
8. Katanoda K, Sobue T, Satoh H, Tajima K, Suzuki T, Nakatsuka H, Takezaki T, Nakayama T, Nitta H, Tanabe K: An association between long-term exposure to ambient air
pollution and mortality from lung cancer and respiratory diseases in Japan. Journal
of epidemiology 2011, 21(2):132-143.
9. Hamra GB, Guha N, Cohen A, Laden F, Raaschou-Nielsen O, Samet JM, Vineis P, Forastiere F, Saldiva P, Yorifuji T: Outdoor particulate matter exposure and lung
cancer: a systematic review and meta-analysis. Environmental health perspectives
2014, 122(9):906.
10. Rückerl R, Schneider A, Breitner S, Cyrys J, Peters A: Health effects of particulate air
pollution: a review of epidemiological evidence. Inhalation toxicology 2011, 23(10):555-592.
11. IARC: IARC: Outdoor air pollution a leading environmental cause of cancer deaths: International Agency for Research on Cancer; 2013.
12. Fajersztajn L, Veras M, Barrozo LV, Saldiva P: Air pollution: a potentially modifiable
24
13. OECD: OECD environmental outlook to 2050:[the consequences of inaction]: OECD; 2012.
14. Cristina G, Ortiz AG, Leeuw Fd, Viana M, Horálek J: Air quality in Europe — 2016
report. In. Luxembourg: European Environment Agency; 2016: 83.
15. Ferreira F, Seixas J, Barroso JE, Fortes P, Tente H, Monjardino J, Dias L, Gomes P, Miranda AI, Monteiro A et al: ESTRATÉGIA NACIONAL PARA O AR 2020 – Emissões
Atmosféricas e Qualidade do Ar Ambiente: Enquadramento e Diagnóstico. In.
Amadora: Agência Portuguesa do Ambiente; 2015.
16. Cogliano VJ, Baan R, Straif K, Grosse Y, Lauby-Secretan B, El Ghissassi F, Bouvard V, Benbrahim-Tallaa L, Guha N, Freeman C: Preventable exposures associated with
human cancers. Journal of the National Cancer Institute 2011, 103(24):1827-1839.
17. Agência Portuguesa do Ambiente: Emissões de Poluentes Atmosféricos por
Concelho 2009:Gases acidificantes e eutrofizantes, precursores de ozono, partículas, metais pesados e gases com efeito de estufa. In. Amadora: Agência
Portuguesa do Ambiente; 2011.
18. Guo Y, Zeng H, Zheng R, Li S, Barnett AG, Zhang S, Zou X, Huxley R, Chen W, Williams G: The association between lung cancer incidence and ambient air pollution in
China: A spatiotemporal analysis. Environmental research 2016, 144:60-65.
19. Jerrett M, Burnett RT, Beckerman BS, Turner MC, Krewski D, Thurston G, Martin RV, van Donkelaar A, Hughes E, Shi Y: Spatial analysis of air pollution and mortality in
California. American journal of respiratory and critical care medicine 2013, 188(5):593-599.
20. Fierens F, Vanpoucke C, Trimpeneers E, Peeters O, Quidé S, Vos Td, Maetz P, Hutsemékers V: Annual Report: Air Quality in Belgium 2015. In.: Belgian Interregional Environment Agency (IRCEL-CELINE); 2015.
21. Zhang J, Kai FY: What's the relative risk?: A method of correcting the odds ratio in
cohort studies of common outcomes. Jama 1998, 280(19):1690-1691.
22. Gerber F: Disease Mapping with the Besag-York-Mollié Model Applied to a Cancer
and a Worm Infections Dataset. Master’s thesis, University of Zurich, Switzerland;
2013.
23. Besag J, York J, Mollié A: Bayesian image restoration, with two applications in
spatial statistics. Annals of the institute of statistical mathematics 1991, 43(1):1-20.
24. López-Abente G, Aragonés N, García-Pérez J, Fernández-Navarro P: Disease mapping
and spatio-temporal analysis: importance of expected-case computation criteria.
Geospatial health 2014, 9(1):27-35.
25. Direcção Geral do Território: Especificações técnicas da Carta de uso e ocupação do
solo de Portugal Continental para 1995, 2007 e 2010: Relatório Técnico. In.:
Direção Geral do Território; 2016.
26. Getis A, Ord JK: The analysis of spatial association by use of distance statistics.
25
27. Bui DT, Do AN, Bui H-B, Hoang N-D: Advances and Applications in Geospatial
Technology and Earth Resources. In: Conference proceedings GTER: 2017; 2017: 3.
28. Gutierrez L, Sassi M: Spatial and non spatial approaches to agricultural convergence
in Europe. Economia e Diritto Agroalimentare 2012, 17(1):9.
29. Comber AJ, Brunsdon C, Radburn R: A spatial analysis of variations in health access:
linking geography, socio-economic status and access perceptions. International
journal of health geographics 2011, 10(1):44.
30. Mitchel A: The ESRI Guide to GIS analysis, volume 2: spartial measurements and
statistics. ESRI Guide to GIS analysis 2005.
31. Sassi M: OLS and GWR approaches to agricultural convergence in the EU-15.
International Advances in Economic Research 2010, 16(1):96-108.
32. Foody G: Geographical weighting as a further refinement to regression modelling:
An example focused on the NDVI–rainfall relationship. Remote sensing of
Environment 2003, 88(3):283-293.
33. Lu B, Harris P, Charlton M, Brunsdon C: Calibrating a geographically weighted
regression model with parameter-specific distance metrics. Procedia Environmental
Sciences 2015, 26:109-114.
34. Fotheringham AS, Brunsdon C, Charlton M: Geographically weighted regression: the
analysis of spatially varying relationships: John Wiley & Sons; 2003.
35. Charlton M, Fotheringham S, Brunsdon C: Geographically weighted regression.
White paper National Centre for Geocomputation National University of Ireland Maynooth 2009.
36. Levi F: Cancer prevention: epidemiology and perspectives. European Journal of
Cancer 1999, 35(14):1912-1924.
37. Riaz SP, Horton M, Kang J, Mak V, Lüchtenborg M, Møller H: Lung cancer incidence
and survival in England: an analysis by socioeconomic deprivation and urbanization.
Journal of Thoracic Oncology 2011, 6(12):2005-2010.
38. Singh GK, Siahpush M, Williams SD: Changing urbanization patterns in US lung
cancer mortality, 1950–2007. Journal of community health 2012, 37(2):412-420.
39. Hu Z, Baker E: Geographical Analysis of Lung Cancer Mortality Rate and PM2. 5
Using Global Annual Average PM2. 5 Grids from MODIS and MISR Aerosol Optical Depth. Journal of Geoscience and Environment Protection 2017, 5(06):183.
40. Ren H, Cao W, Chen G, Yang J, Liu L, Wan X, Yang G: Lung Cancer Mortality and
Topography: A Xuanwei Case Study. International journal of environmental research
and public health 2016, 13(5):473.
41. Fu J, Jiang D, Lin G, Liu K, Wang Q: An ecological analysis of PM 2.5 concentrations
and lung cancer mortality rates in China. BMJ open 2015, 5(11):e009452.
42. López-Cima MF, García-Pérez J, Pérez-Gómez B, Aragonés N, López-Abente G, Tardón A, Pollán M: Lung cancer risk and pollution in an industrial region of Northern Spain:
a hospital-based case-control study. International journal of health geographics