The application of a multi-wavelength Aethalometer to estimate iron
1dust and black carbon concentrations in the marine boundary layer of
2Cape Verde
34
P. Fialho
1*, M. Cerqueira
2, C. Pio
2, J. Cardoso
2,3, T. Nunes
2, D. Custódio
2, C. Alves
2,
5S. M. Almeida
4, M.Almeida-Silva
4, M. Reis
4, F. Rocha
5 61University of Azores, Rua Capitão João de Ávila, PT9700-042 Angra do Heroísmo, Portugal 7
2 Department of Environment and Planning & CESAM, University of Aveiro, 3810-193 Aveiro, 8
Portugal
9
3 University of Cape Verde, Campus do Palmarejo, CP-279, Praia, Cape Verde 10
4 Centro de Ciências e Tecnologias Nucleares, Instituto Superior Técnico, Universidade de 11
Lisboa, 2695-066 Bobadela LRS, Portugal
12
5Department of Geosciences, GeoBioTec – GeoBioSciences, Geotechnologies and Geoengineering 13
Research Center, University of Aveiro, 3810-193 Aveiro, Portugal
14 15 16 17 18 19 20 21 22 23 24 25 26
*Corresponding author: Telephone: +351 295 402 560; Fax: +351 295 402 205; Email address: 27
fialho.paulo@gmail.com 28
29 30
Abstract
31
The two-component model (Fialho et al., 2006) was used to decouple the contributions of black 32
carbon (BC) and iron oxides, present in dust, to the aerosol attenuation coefficient, measured with a 33
multi-wavelength Aethalometer. The model results were compared with the elemental carbon (EC) 34
and iron concentrations determined in the laboratory from the analysis of aerosol particles collected 35
with conventional samplers. The comparison was based on one year of data obtained at Praia, 36
Santiago Island, Cape Verde, after side by side operation of the aerosol monitoring instruments. The 37
linear regression equation that best describes the relationship between BC concentrations, derived 38
from the Aethalometer, and EC concentrations, derived from a PM10 high-volume sampler after
39
filter analysis with a thermal optical method, presents a slope of 1.01±0.05 and a correlation 40
coefficient (r) of 0.90, showing that the model worked as intended to describe BC concentrations 41
without interferences from iron dust. On the other hand, the linear regression equation that best 42
describes the relationship between the iron concentrations derived from the Aethalometer and 43
elemental iron concentrations, derived from a PM10 low-volume sampler after filter analysis by k0 -
44
Instrumental Neutron Activation Analysis, presents a slope of 0.495±0.014 and a correlation 45
coefficient (r) of 0.96. These results show that the two-component model underestimated the iron 46
concentrations in dust aerosol, which was explained by differences in the size range of particles 47
sampled with the Aethalometer and the PM10 low-volume sampler together with differences in the
48
size distribution of iron oxides. 49
Keywords: iron dust; black carbon; Aethalometer; two-component model; Cape Verde
50
1. Introduction
51
The African continent is an important source of mineral dust and biomass burning particles to the 52
global atmosphere (Prospero et al., 2002, Langmann et al., 2009). These particles are known to 53
affect the Earth’s radiative budget (Satheesh and Krishna Moorthy, 2005; Langmann et al., 2009), 54
to influence cloud formation and precipitation (DeMott et al., 2003; Lin et al., 2006; Petters et al., 55
2009) and to play an important role in biogeochemical cycles (Crutzen and Andreae, 1990; 56
Mahowald et al., 2005). The radiative effects of these particles are strongly related with their 57
chemical composition (Haywood and Boucher, 2000; Satheesh and Krishna Moorthy, 2005). Iron 58
oxides and black carbon (BC) are major light absorbing constituents, at visible wavelengths, of dust 59
and combustion particles, respectively, (Bohren and Huffman, 1998; Bond and Bergstrom, 2006; 60
Linke et al., 2006), thus contributing to the aerosol attenuation coefficient and affecting the 61
radiative transfer within the atmosphere. 62
BC in atmospheric sciences is operationally defined as the light absorbing fraction of 63
carbonaceous aerosols and is usually determined through the measurement of light attenuation by 64
particles collected on a filter. However, optical techniques can provide erroneous estimates of BC, 65
due to the presence of mineral dust. Previous studies dealing with this effect have shown that the 66
contribution of dust aerosol to optical absorption can be as great as 30% (Jennings et al., 1996; 67
Pinnick et al., 1993; Coen et al., 2003; Bodhaine, 1995; Hansen et al., 1993). 68
Previously, Fialho et al. (2005) proposed a two-component model to decouple the contribution of 69
BC and dust from the aerosol attenuation coefficient measured with the Aethalometer. 70
t BC
t dust
t aerosol ATN , , , (1.1) 71where ATN-aerosol(,t) is the Aethalometer aerosol attenuation coefficient, BC(,t) and dust(,t) are, 72
respectively, the BC and dust Aethalometer attenuation coefficients. 73
The two-component model was further developed by Fialho et al. (2006), after experimental 74
determination of the calibration coefficient for elemental iron (used as an indicator of light 75
attenuation due to the presence of iron oxide in dust aerosol and considering that dust color is the 76
result of the overwhelming abundance of hematite, Fe2O3 (red), and goethite, FeO(OH) (yellowish
77
brown), in soils with low concentrations of organic matter, such as deserts (Torrent et al., 1983). 78
t CBC
t CFe
t aerosol ATN , 14.625 1 0.234 4 (1.2) 79Where, CBC(t) and CFe(t) are, respectively, the concentrations of BC and elemental iron, and the 80
numbers are the calibration constants for BC (14.625 m.m2g-1, used by the Aethalometer (Hansen, 81
2003)) and elemental iron (0.234 m4m2g-1, estimated in Fialho et al. (2006)). 82
The purpose of this work is to test the two-component model described above by comparing the 83
BC and iron concentration results obtained with a multi-wavelength Aethalometer with the 84
elemental carbon (EC) and elemental iron concentrations determined in the laboratory from the 85
analysis of aerosol particles collected with conventional high and low volume filter samplers. 86
Although the operational definition of BC is different from that of EC, which is the aerosol carbon 87
fraction that is oxidized in combustion analysis above a certain temperature threshold (Andreae & 88
Gelencsér, 2006), both terms are often used interchangeably and are commonly well correlated 89
(Allen et al., 1999; Park et al., 2002). Therefore EC is assumed to be an appropriate parameter to 90
evaluate the Aethalometer performance. 91
This comparison study is based on one year of data obtained at Santiago Island (Cape Verde), 92
within the framework of CV-Dust research project, after side by side operation of the aerosol 93
monitoring and sampling instruments. Aerosol in the Cape Verde area has very often been observed 94
to be a mixture of dust particles transported from the Sahara desert and carbon particles resulting 95
from biomass burning practices in the region south of the Sahel (Lieke et al., 2011; Tesche et al., 96
2011) and from local traffic emissions (Gonçalves et al., 2014), and therefore the islands are ideally 97
located to explore the two-component model capabilities. 98
The present work assumes that the enhancement of the aerosol attenuation coefficient with the 99
wavelength was solely the result of iron in aerosol particles. Atmospheric “brown” carbon, which is 100
also known to enhance the Aethalometer attenuation signal (Andreae and Gelencsér, 2006), was 101
neglected considering the very low concentrations of levoglucosan (an acknowledged biomass 102
burning tracer) reported by Gonçalves et al. (2014) during the CV-Dust field experiment (2 to 10 103
ng/m3). 104
105
2. Experimental setup and working equations
106
2.1 Sampling site
107
Aerosol sampling was performed from January 12 through December 30, 2011, at the former 108
airport of Praia, in the south-eastern edge of Santiago Island, Cape Verde (14º 55’ N; 23º 29 ´W; 98 109
m a.s.l.). The site is located to the east of the urban settlement of Praia and prevalent winds are 110
north-easterlies (trade winds) transporting particles from mainland Africa. However, local 111
anthropogenic influences on aerosol composition cannot be precluded. 112
2.2 Aerosol attenuation coefficient measurements
113
A seven wavelength Aethalometer (Magee Scientific, model AE31, = 370, 470, 520, 590, 660, 114
880 and 950 nm) equipped with a “high sensitivity” circular spot size chamber was used to measure 115
the aerosol attenuation coefficient. Ambient air was sampled at a flow rate of 4.0 dm3/min, 116
measured with the internal Aethalometer mass flowmeter (Sierra Model 824), through a whole air 117
inlet without any specific cut-off size. The inlet setup consisted of one tube (length: 1.5 m; internal 118
diameter: 6.0 mm) extending horizontally from an open window, with the opening slightly falling 119
down. The inlet efficiency was estimated with the aerosol calculator program developed by Baron 120
(2001), assuming spherical particles with densities between 1 and 4 g/cm3 and diameters between 1 121
µm and 10 µm, and isokinetic sampling conditions (Table 1). 122
Table 1 – Inlet efficiency for an isoaxial horizontal tube and isokinetic sampling conditions (Baron,
123
2001). 124
Particle diameter (µm) Particle density (g/cm3) 1.0 2.0 4.0 1.0 0.97 0.96 0.93 2.5 0.91 0.85 0.76 5.0 0.77 0.64 0.47 10 0.48 0.29 0.12
Particulate matter accumulated in a quartz fibre filter tape (Q250F from Pallflex©) and the 125
instrument was setup to automatically advance the tape whenever the ATN (370 nm) sign was 126
higher than 50% to avoid significant overloading of the filter with aerosol. The impact of the 127
loading effect correction will be discussed below, in section 3.2. From January 12 to April 7, at 10 128
a.m., the sampling period was set to 5 minutes; after that, until the end of the experiment (December 129
30, at 12 a.m.) it was set to 2 minutes, in order to decrease the time gaps between the automatic 130
Aethalometer filter changes. The Aethalometer was setup to report the mass in g/m3 of equivalent 131
BC and the instrument detection limit was 0.1g/m3. The Aethalometer was removed from the
132
sampling site between December 13 and December 23, to be used in an intercomparison 133
experiment. Therefore, measurements are not available for that period. 134
2.3 EC and iron-containing aerosols measurements
135
Aerosol particles were collected simultaneously with a high-volume sampler (Tisch) and a low-136
volume sampler (TCR Tecora) both equipped with PM10 size selective inlets. Sampling periods
137
were irregular and dependent on the filter loading. During Saharan dust episodes dust accumulation 138
was faster and sampling periods were shorter than those of the non-dust episodes. The average 139
sampling period was of 2 days and 16 hours, with a sample range of 7 hours to 6 days and 22 hours, 140
depending on the mass of particles accumulated in the filters. Quartz fibre filters and Nuclepore 141
polycarbonate filters were used with the high-volume and the low-volume sampler, respectively. 142
Elemental carbon was analysed in the quartz filters using a home-made thermal-optical system,
143
based on the thermal desorption/oxidation of particulate carbon to CO2, that is subsequently
144
measured by non-dispersive infrared spectrophotometry (Castro et al., 1999; Pio et al, 2011). This
145
method was tested with the NIST (National Institute of Standards and Technology) 8785 filter
146
standard and in an intercomparison experiment with real aerosol samples (Schmid et al., 2001),
147
delivering results between those obtained by the NIOSH (National Institute for Occupational Safety
148
and Health) 5040 and the IMPROVE (Interagency Monitoring of Protected Visual Environments)
149
protocols, but closer to the latter. The method detection limit was 30 ng/m3. Iron was measured in 150
the polycarbonate filters by k0 - Instrumental Neutron Activation Analysis (k0-INAA) as described
151
by Almeida et al. (2008) and Almeida et al. (2013). Results obtained with k0-INAA were compared
152
with iron measurements performed in the same filters by particle induced X-ray emission (PIXE) 153
and revealed a good correlation between the two methods (regression coefficient of 0.97, with a 154
slope of 0.976 and an intercept of 0.18 g/m3; Almeida-Silva et al., 2014). The k0-INAA detection
155
limit was found to be 55 ng/m3.
156
2.4. Aethalometer working equations
157
The reported Aethalometer particle aerosol concentrations, CAE(, t), were averaged into the 10 158
minute interval, by calculating the moving averages of the 5 and 2 minute sampled data. 159
Application of Eq.(1.2), to these data, needs the calculation of the particle aerosol attenuation 160
coefficient, ATN-aerosol(, t), which is done by using equation (2), 161
1
2 1
1
3
. ; , ) ( 625 . 14 ; , aerosol t Mm mm g m CAE t gm ATN (2) 162Estimation of, CBC(t) and CFe(t), was done by considering only the particle aerosol attenuation 163
coefficient, ATN-aerosol(, t), at the visible wavelengths (0.47, 0.52, 0.59 and 0.66 m - as suggested 164
by Fialho et al. (2006)), and by linear fitting Eq.(1.2) rearranged in the forms, 165
1 . 3 1 . 3 3.1 1 . 3 3 intercept , 234 . 0 625 . 14 , x slope Fe BC t y aerosol ATN t C t C t (3.1) 166
2 . 3 2 . 3 3.2 2 . 3 intercept 3 slope , 4 234 . 0 625 . 14 ,t C t CFe t x BC t y aerosol ATN (3.2) 167From each fit the correlation coefficients, r3.1 and r3.2, were calculated and the following 168
considerations were made: 169
- if slope3.1 was positive and r3.1 greater than 0.7, or, slope3.2 was positive and r3.2 greater than 170
0.7, the two-component model given by Eq.(1) was adopted and, the best solution was 171
decided in favour of the one with the highest correlation coefficient, r3.1 or r3.2. 172
- in the other situations, the average value of CAE(, t), calculated from considering only the 173
visible wavelengths, was taken as the best estimation of CBC(t), and CFe(t) was assumed to 174
be zero. 175
The threshold of r > 0.7, is the limit at which the two-component model can explain at least 50% 176
of the experimental attenuation signal as being a contribution from the presence of at least one of 177
the two types of aerosol components (BC and/or iron oxides). The selection of Eq.(3.1) or Eq.(3.2) 178
is most significant when at least one of the aerosol constituents has concentrations near the limit of 179
detection of the method. Taking this under consideration, equation (3), which multiplies that aerosol 180
constituent concentration by the slope, should be disregarded in favour of the other. 181
When the Aethalometer aerosol attenuation coefficient is near the limit of detection, it is not 182
possible to get a good correlation coefficient for either one of the equations (3.1 or 3.2). The value 183
is then averaged and associated to BC aerosol concentration and the iron oxide contribution is 184
assumed to be zero. 185
To compare the Aethalometer CBC(t) and CFe(t) with the values obtained from the high-volume 186
(HV) and low-volume (LV) filter analysis, the Aethalometer data were averaged for the same time 187
period of those samplers and the corresponding overlap coverage (AE_HLV), was calculated by the 188 equation, 189 % 100 AE_HLV
period samping HLV period sampling er Aethalomet period sampling HLV end period sampling HLV start (4) 190where HLV stands for high and low volume. For the estimation of the correlation models only the 191
periods with more than 70% of overlap coverage were used. 192
In reality, the interval is in the range of 70% to 130%; values of AE_HLV larger than 100% 193
result from the fact that the HV and LV samplers have been operating with interruptions and in 194
some cases the effective sampling period for these instruments was shorter than the registered 195
sampling period of the Aethalometer filter tape (a consequence of power failures and restart of both 196
systems without synchronization); whenever we mention more than 70% along this paper, we are 197
referring to the ]70%,130%[ interval. 198
3. Results and discussion
199
3.1 Model performance for predicting BC and iron concentrations in aerosols
200
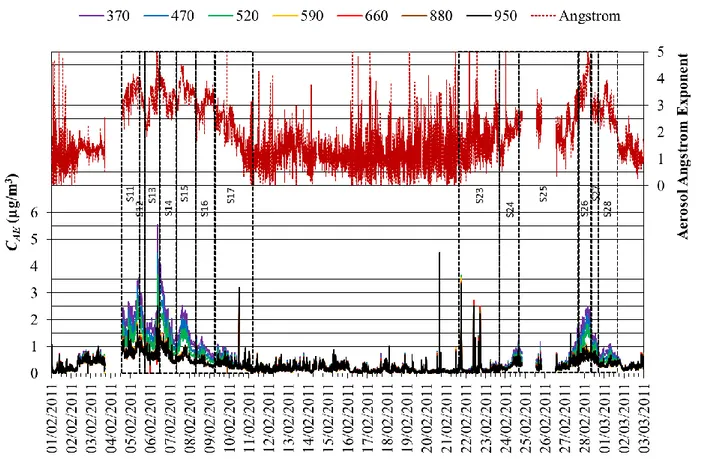
Figure 1 shows time series of Aethalometer particle aerosol concentrations, CAE(, t) and 201
respective angstrom exponents at the sampling site of Praia, during the month of February. 202
Angstrom exponents higher than 2.5 were observed during two periods in early and late February. 203
These maxima coincided with peak values of atmospheric dust (Pio et al., 2014) and were related 204
with air mass transport from Western Sahara (Figure 2). Dust episodes like these are common in the 205
Cape Verde islands and illustrate the importance of using a decoupling model to separate the 206
contributions of different species to the aerosol attenuation coefficient. 207
208
209
Figure 1 – Time series of 10 minute Aethalometer particle aerosol concentrations, CAE(, t) and 210
respective angstrom exponents obtained from the four visible wavelengths, during 211
February 2011. The coloured solid lines in the legend identify the seven wavelength 212
values and the red dotted line is the angstrom exponent. The black dotted boxes define 213
the HV and LV sampling periods (S11 to S17 and S23 to S28). 214
215
Figure 2 – Four-day back trajectories, arriving every hour at the sampling site, from February 5 to
216
February 10 (a) and from February 27 to March 3 (b), calculated with the HYSPLIT 217
model (Draxler and Rolph, 2013). The black triangles denote 6 h intervals. 218
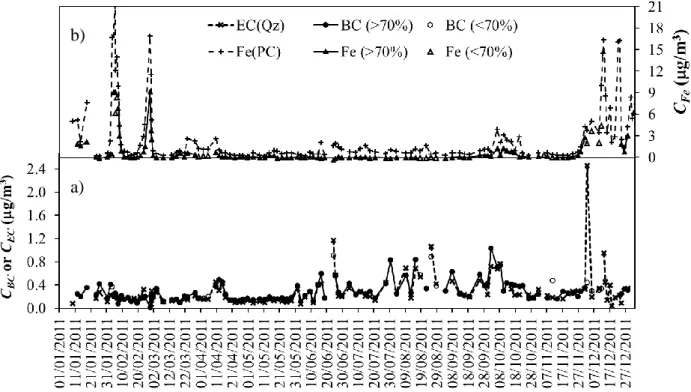
Figure 3-a) shows the black carbon concentrations obtained from the Aethalometer 219
measurements after applying the two-component model presented by Eq.3 and averaging the data 220
for the HV filter sampling interval, together with the elemental carbon determined in the laboratory 221
from the analysis of HV samples. Figure 3-b) shows the elemental iron concentrations obtained 222
from the Aethalometer measurements after applying the two-component model presented by Eq.3 223
and averaging the data for the LV filter sampling interval together with the elemental iron 224
determined in the laboratory from the analysis of the LV samples. 225
The time series of Figures 3a) and 3b) present all the data regardless of the gaps between the 226
sampling periods of the two instruments. The criterion of the 70% overlap seems to work well for 227
the majority of the data, although, for a few points, the deviations between the concentration values 228
obtained with both techniques could be significant. Those differences can be easily explained by the 229
fact that the ambient aerosol concentration was changing during the sampling period and 230
simultaneously one of the sampling instruments was not working. 231
232
Figure 3 – Time series of black carbon (CBC), elemental carbon (CEC) and elemental iron (CFe) 233
concentrations determined during 2011 at the outskirts of Praia, Santiago Island, in 234
Cape Verde. The concentration values are averages reported for the HLV sampling 235
periods. a) Black dots connected by a black solid line represent black carbon 236
concentrations, estimated with the Aethalometer, for periods where the overlapping with 237
the HLV sampling was greater than 70%. Empty circles represent black carbon 238
concentrations, estimated with the Aethalometer, for periods where the overlapping with 239
b)
the HLV sampling was less than 70%. Black crosses connected by a dotted black line 240
are elemental carbon concentrations estimated from the laboratory analysis of the HV 241
quartz filters (Qz). b) Black triangles connected by a black solid line represent elemental 242
iron concentrations, estimated with the Aethalometer, for periods where the overlapping 243
with the HLV sampling was greater than 70%. Empty triangles represent elemental iron 244
concentrations, estimated with the Aethalometer, for periods where the overlapping with 245
the HLV sampling was less than 70%. Black crosses connected by a dotted black line 246
are elemental iron concentrations estimated from the laboratory analysis of the LV 247
polycarbonate (PC) filters. 248
Analysis of Figure 3-a) shows that, CBC and CEC, present a similar behaviour. A linear regression 249
was performed to quantify this correlation (Figure 4), and only the pairs of points for which the 250
Aethalometer information overlapped the HV samples by at least 70% (84 - black dots) were used 251
for this purpose. Eq.(5) is the model that results from this correlation analysis with a standard error 252
of 0.08 g/m3 and a correlation coefficient, r, of 0.90. 253
3
3
/ 05 . 0 01 . 1 016 . 0 033 . 0 /m C g m g CBC EC (5) 254The slope of 1.01±0.05 is statistically not different from one, and considering the standard error 255
of the fitting, 0.08 g/m3, the intercept of the model (0.033±0.016 µg/m3) is statistically not 256
different from zero. 257
Figure 4 – Correlation plot for the concentration of black carbon (CBC) and elemental carbon (CEC). 259
Black dots represent CBC and CEC concentrations associated with sampling periods that 260
overlap more than 70%. Empty circles represent CBC and CEC concentrations associated 261
to sampling periods that overlap less than 70%. The solid black line is the correlation 262
model given by Eq.(5). The black dotted lines, identified as () and (+), are, 263
respectively, the lower and upper limits of one standard deviation predicting interval. 264
The dashed black line represents the 1:1 relation; 265
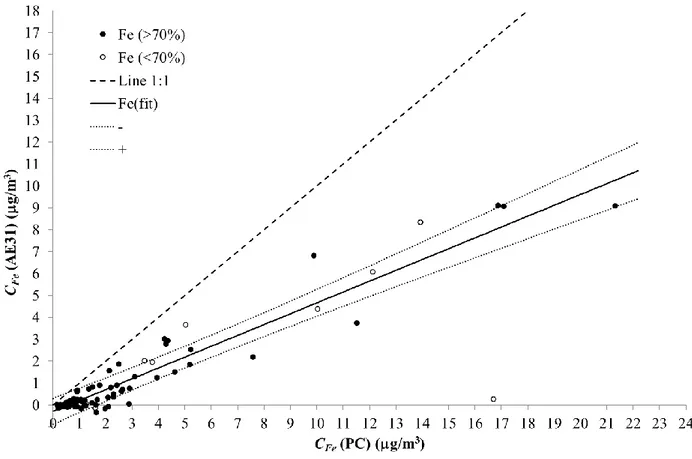
Analysis of Figure 3-b) shows that, CFe, estimated from the LV samples and from the 266
Aethalometer show a similar behaviour, although the concentrations reported by the LV samples are 267
systematically higher. A linear regression was performed to quantify this correlation (Figure 5) and 268
only the pairs of points for which the Aethalometer information overlapped the LV samples by at 269
least 70% (104 - black dots) were used for this purpose. Eq.(6) shows the model that results from 270
this correlation analysis, with a standard error of 0.5 g/m3 and a correlation coefficient, r, of 0.96. 271
3
3
/ ; PC 014 . 0 495 . 0 06 . 0 29 . 0 /m C g m g CFe Fe (6) 272The slope of 0.495±0.014 suggests that the application of the two-component model 273
underestimates the results given by the low volume aerosol sampler for the elemental iron by a 274
factor of about 2. Considering the standard error of the fitting, 0.5 g/m3, the intercept (0.29±0.06 275
g/m3) of the model is statistically not different from zero. 276
277
Figure 5 – Correlation plot for the concentration of elemental iron, CFe(AE31) calculated with the 278
Aethalometer and elemental iron, CFe(PC) calculated from the analysis of the LV 279
samples. Black dots correspond to CFe(AE31) and CFe(PC) concentrations associated 280
with sampling periods that overlap more than 70%. Empty circles represent CFe(AE31) 281
and CFe(PC) concentrations associated to sampling periods that overlap less than 70%. 282
The solid black line is the correlation model given by Eq.(6). The black dotted lines, 283
identified as () and (+), are, respectively, lower and upper limits of one standard 284
deviation predicting interval. The dashed black line represents the 1:1 relation. 285
The good correlation presented for the two-component model estimation of the black carbon 286
concentration (r = 0.90) and the elemental iron concentration (r = 0.96) indicates that the two-287
component model, proposed in Eq.(1), is a good approximation for the binary interaction of these 288
two types of aerosol, since it is able to uncouple and describe the behaviour of the two optically 289
absorbing components present in the sampled aerosol. 290
Black carbon (or elemental carbon) particles are known to be associated with the aerosol fine 291
fraction (e.g. Hitzenberger and Tono, 2001; Soto-García et al., 2011). On the other hand, the 292
Aethalometer was found to be an efficient sampler for particles with an aerodynamic diameter 293
smaller than 2.5 m (Table 1). Therefore, the instruments were appropriate to measure the total 294
concentrations of black carbon and elemental carbon, respectively, in ambient air. The slope of one 295
(1.01±0.05) given by (Eq.(5)) suggests that both the Aethalometer and the high volume sampler 296
provide similar results and that the two-component model is able to estimate the black carbon 297
concentration in a mixed aerosol containing iron dust. 298
Two iron classes are usually distinguished in African dust: “structural iron”, mainly in the form 299
of alumino-silicate minerals, and “free iron”, in the form of oxide (hematite, Fe2O3) or hydroxide
300
(goethite, FeO(OH)) discrete particles (Lafon et al., 2004). Both iron oxides and hydroxides are 301
commonly referred to as “iron oxides” and absorb significantly in the UV-visible region (Bohren 302
and Huffman, 1998; Linke et al., 2006). Studies performed near the northern African dust sources 303
as well as in the Canary Islands have shown that iron oxides are more abundant in the aerosol fine 304
fraction (Chou et al., 2008; Kandler et al., 2007). This means that during the CV-Dust field work 305
the Aethalometer and the low volume sampler might have been collecting samples with a different 306
proportion of iron oxides. Since the Aethalometer is sensitive to the presence of iron oxides and the 307
iron measurements performed on the low-volume polycarbonate filters quantified total iron, it is not 308
surprising to find a slope less than one (0.495±0.014) for Eq.6. In addition, as stated before, the 309
low-volume sampling system was configured to collect aerosol particles with an aerodynamic 310
diameter smaller than 10 m and the Aethalometer was operated under efficient conditions for 311
particles with an aerodynamic diameter smaller than 2.5 m (Table 1). This suggests that the air 312
reaching the filter of the Aethalometer had a lower iron concentration than the air reaching the filter 313
of the low-volume sampler. 314
3.2 Influence of the loading effect on the model performance
315
The influence of loading effects on the performance of the two component model was evaluated 316
with the algorithm proposed by Weingartner et al. (2003), 317
f t ATN R t t W aerosol ATN correct ATN , , , , (7) 318 where, 319
1 % 10 ln % 50 ln % 10 ln , ln 1 1 , , ATN t f f t ATN RW (8) 320The application of the above algorithm requires information about the aerosol scattering properties 321
for the sampling site. Given that these measurements were not available for the Cape Verde 322
atmosphere, a value of 1.203±0.031 was estimated for, by averaging, the f() values reported by 323
Weingartner et al. (2003), for an aged external mixture of diesel soot and ammonium sulphate 324
particles (considering the small wavelength dependence reported, f() was assumed constant and is 325
denoted by f). 326
The application of the two-component model to ATN-correct resulted in correlation plots similar to 327
the ones shown in figures 4 and 5, with a small enhancement on the higher concentrations, 4% for 328
BC (1.03 to 1.07 µg/m3) and 13% for iron (9.1 to 10.3 µg/m3). The new BC correlation is given by
329
Eq.(9) and both parameters, intercept and slope, do not show any statistical difference from those 330 given by Eq.(5), 331
3
3
/ 06 . 0 02 . 1 017 . 0 025 . 0 /m C g m g CBC EC (9) 332with a correlation coefficient, r, of 0.89 and a standard error of 0.08 g/m3, for the iron, the new 333
correlation, given in Eq.(10), show a slight increase in the slope parameter by comparing with the 334
one given by Eq.(6), 335
3
3
/ ; PC 015 . 0 562 . 0 06 . 0 21 . 0 /m C g m g CFe Fe (10) 336with a similar correlation coefficient, r = 0.96, and a standard error of 0.5 g/m3. 337
These results show that the use of a loading effect correction enhances the estimation of 338
concentrations, and that the impact of this correction is more significant for the iron present in dust 339
than for the BC. Although the f value used for the model was not the most appropriate for the type 340
of aerosol sampled in Cape Verde, it is clear that the filter loading was not responsible for the 2 341
factor difference in the estimation of the iron concentration. 342
4. Conclusions
343
The simple two-component model, presented by Fialho et al. (2006), was used to remove the 344
interference of dust (iron mineral dust) in the calculation of the BC concentrations measured with 345
the Aethalometer. The linear regression equation that describes the relationship between BC 346
concentrations, obtained after removing that interference, from the Aethalometer measurements and 347
the EC concentrations that resulted from the analysis of quartz fibre filters with the thermal optical 348
method has a slope of 1.01±0.05 and a correlation coefficient (r) of 0.90, suggesting that the two-349
component model provides reliable BC concentrations without interferences from iron dust. 350
The application of the two-component model allowed the calculation of the elemental iron 351
concentrations in the fine particles (< 5 µm) of aerosol dust. A comparison of these concentrations 352
with the elemental iron concentrations obtained after analysing the low-volume polycarbonate 353
filters with the k0-INAA technique shows a linear correlation with a slope of 0.495±0.014, an
354
intercept of 0.29±0.06 g/m3 and a correlation coefficient (r) of 0.96. These results show that the 355
application of the two-component model to the Aethalometer data underestimated the iron 356
concentrations in dust aerosol, which was most likely a consequence of differences in the size range 357
of particles sampled with the Aethalometer (fine fraction) and the low-volume sampler (<10 m) 358
used for data comparison together with differences in the size distribution of iron oxides, which is 359
mostly concentrated in fine particles. The high correlation obtained suggests that the assumption 360
made before, that the enhancement of the aerosol attenuation coefficient with the wavelength was 361
related with the iron presence in dust, is valid. If the presence of “brown” carbon was significant, 362
this correlation coefficient would be much lower or even not significant 363
Finally, this study shows that the two-component model can be used as a valuable tool to remove 364
the enhancement of the attenuation coefficient due to the presence of iron oxides in aerosol 365
particles, and, if the presence of “brown” carbon can be neglected, at the same time, allow the 366
estimation of the elemental iron concentration in the fine dust particles (< 5 µm). 367
368
Acknowledgements
369
This study was financially supported by the Portuguese Science Foundation through the project 370
CV-Dust - Atmospheric aerosol in Cape Verde region: seasonal evaluation of composition, sources 371
and transport (PTDD/AAC-CLI/100331/2008). The authors gratefully acknowledge the NOAA Air 372
Resources Laboratory (ARL) for the provision of the HYSPLIT transport and dispersion model 373
and/or READY website (http://www.ready.noaa.gov) used in this publication. Two anonymous 374
reviewers are also acknowledged for their constructive comments and suggestions. 375
References
376
Allen, G.A., Lawrence, J., Koutrakis, P. (1999) Field validation of a semi-continuous method for 377
aerosol black carbon (aethalometer) and temporal patterns of summertime hourly black carbon 378
measurements in southwestern PA. Atmospheric Environment, 33, 817-823. 379
Almeida, S.M., Freitas, M.C., Pio, C.A, (2008). Neutron Activation Analysis for Identification of 380
African Mineral Dust Transport, Journal of Radioanalytical and Nuclear Chemistry, 276, 161-381
165, http://dx.doi.org/10.1007/s10967-007-0426-4. 382
Almeida, S.M., Freitas, M.C., Pio, C.A., Pinheiro, M.T., Felix, P., (2013). Fifteen years of nuclear 383
techniques application to suspended particulate matter studies. Journal of Radioanalytical and 384
Nuclear Chemistry, 297, 347-356, http://dx.doi.org/10.1007/s10967-012-2354-1. 385
Almeida-Silva, M., Almeida, S.M., Cardoso, J., Nunes, T., Reis, M.A., Chaves, P.C., Pio, C.A., 386
(2014) Characterization of the aeolian aerosol from Cape Verde by k0-INAA and PIXE, Journal 387
of Radioanalytical and Nuclear Chemistry, 300, 629-635, 388
http://dx.doi.org/10.1007/s10967-014-2957-9. 389
Andreae, M.O., Gelencsér, A. (2006) Black carbon or brown carbon? The nature of light-absorbing 390
carbonaceous aerosols. Atmospheric Chemistry and Physics, 6, 3131-3148. 391
Baron, P.A. (2001). Aerosol Calculator Program. 392
(http://www.tsi.com/uploadedFiles/Product_Information/Literature/Software/Aerocalc2001.xls) 393
Bodhaine, B. A. (1995). Aerosol absorption measurements at Barrow, Mauna Loa and the South 394
Pole. Journal of Geophysical Research, 100(D5), 8967 – 8975. 395
Bohren C.F., Huffman D.R. (1998). Absorption and scattering of light by small particles. Wiley 396
Interscience, Paperback Edition, New York, pg. 436-439. 397
Bond, T.C., Bergstrom, R.W. (2006) Light absorption by carbonaceous particles: an investigative 398
review. Aerosol Science and Technology, 40, 27-67, 399
http://dx.doi.org/10.1080/02786820500421521. 400
Castro, L.M., Pio, C.A., Harrison, R.M., Smith, D.J.T., (1999). Carbonaceous aerosol in urban and 401
rural European atmospheres: estimation of secondary organic carbon concentrations. 402
Atmospheric Environment 33, 2771-2781, http://dx.doi.org/10.1016/S1352-2310(98)00331-8. 403
Chou, C., Formenti, P., Maille, M., Ausset, P., Helas, G., Harrison, M., Osborne, S. (2008) Size 404
distribution, shape, and composition of mineral dust aerosols collected during the African 405
Monsoon Multidisciplinary Analysis Special Observation Period 0: Dust and Biomass-Burning 406
Experiment field campaign in Niger, January 2006 (2008) Journal of Geophysical Research, 113 407
D00C10, http://dx.doi.org/10.1029/2008JD009897. 408
Coen, M.C., Weingartner, E., Schaub, D., Hueglin, C., Corrigan, C., Schwikowski, M. and 409
Baltensperger, U. (2003). Saharan dust events at the Jungfraujoch: detection by wavelength 410
dependence of the single scattering albedo and analysis of the events during the years 2001 and 411
2002. Atmospheric Chemistry and Physical Discussion, 3, 5547 –5594. 412
Crutzen, P.J., Andreae, M.O. (1990) Biomass burning in the tropics: impact on atmospheric 413
chemistry and biogeochemical cycles. Science, 250, 1669-1678, 414
http://dx.doi.org/10.1126/science.250.4988.1669.
415
DeMott, P.J., Sassen, K., Poellot, M.R., Baumgardner, D., Rogers, D.C., Brooks, S.D., Prenni, A.J., 416
Kreidenweis, S.M. (2003) African dust aerosols as atmospheric ice nuclei, Geophysical Research 417
Letters, 30 (14), 1732, http://dx.doi.org/10.1029/2003GL017410. 418
Draxler, R.R. and Rolph, G.D., (2013) HYSPLIT (HYbrid Single-Particle Lagrangian Integrated 419
Trajectory) Model access via NOAA ARL READY Website 420
(http://www.arl.noaa.gov/HYSPLIT.php). NOAA Air Resources Laboratory, College Park, MD. 421
Fialho, P., Hansen, A.D.A., Honrath, R.E. (2005) Absorption coefficients by aerosols in remote 422
areas: a new approach to decouple dust and black carbon absorption coefficients using seven-423
wavelength Aethalometer data. Journal of Aerosol Science, 36, 267-282, 424
http://dx.doi.org/10.1016/j.jaerosci.2004.09.004. 425
Fialho, P., Freitas, M.C., Barata, F., Vieira, B., Hansen, A.D.A., Honrath, R.E., (2006). The 426
Aethalometer calibration and determination of iron concentration in dust aerosols. Journal of 427
Aerosol Science, 37, 1497-1506, http://dx.doi.org/10.1016/j.jaerosci.2006.03.002. 428
Gonçalves, C., Alves, C., Nunes, T., Rocha, S., Cardoso, J., Cerqueira, M., Pio, C., Hillamo, R., 429
Teinilä, K. (2014) Organic characterisation of PM10 in Cape Verde under Saharan dust influxes.
430
Atmospheric Environment, 89, 425-432, http://dx.doi.org/10.1016/j.atmosenv.2014.02.025. 431
Hansen, A.D.A., Kapustin, V.N., Kopeikin, V.M., Gillette, D.A., Bodhaine, B.A. (1993). Optical 432
absorption by aerosol black carbon and dust in a desert region of central Asia. Atmospheric 433
Environment, 27A (16), 2527 – 2531. 434
Hansen, A. D. A. (2003). The Aethalometer Manual. Berkeley, CA, USA: Magee Scientific. 435
Haywood, J.; Boucher, O. (2000) Estimates of the direct and indirect radiative forcing due to 436
tropospheric aerosols: a review. Reviews of Geophysics, 38, 513-543. 437
http://dx.doi.org/10.1029/1999RG000078. 438
Hitzenberger, R., Tohno, S. (2001) Comparison of black carbon (BC) aerosols in two urban areas – 439
concentrations and size distributions. Atmospheric Environment, 35, 2153-2167. 440
Jennings, S.G., Spain, T.G., Doddridge, B.G., Maring, H., Kelly, B.P., Hansen, A.D.A. (1996). 441
Concurrent measurements of black carbon aerosol and carbon monoxide at Mace Head. Journal 442
of Geophysical Research, 101(D14), 19447 – 19454. 443
Journet, E., Balkanski, Y., Harrison, S.P., (2013). A new data set of soil mineralogy for dust-cycle 444
modeling, Atmospheric Chemistry and Physics Discussions, 13, 23943-23993, 445
http://dx.doi.org/10.5194/acpd-13-23943-2013. 446
Kandler, K., Benker, N., Bundke U., Cuevas, E., Ebert, M., Knippertz, P., Rodríguez S., Schütz, L. 447
and Weinbruch, S., (2007). Chemical composition and complex refractive index of Saharan 448
Mineral Dust at Izaña, Tenerife (Spain) derived by electron microscopy. Atmospheric 449
Environment, 41, 8058-8074, http://dx.doi.org/10.1016/j.atmosenv.2007.06.047. 450
Lafon, S., Rajot, J.-L., Alfaro, S.C., Gaudichet, A. (2004) Quantification of iron oxides in desert 451
aerosol. Atmospheric Environment, 38, 1211-1218, 452
http://dx.doi.org/10.1016/j.atmosenv.2003.11.006. 453
Langmmann, B., Duncan, B., Textor, C., Trentmann, J., van der Werf, G.R. (2009) Vegetation fire 454
emissions and their impact on air pollution and climate. Atmospheric Environment, 43, 107-116, 455
http://dx.doi.org/10.1016/j.atmosenv.2008.09.047. 456
Lieke, K., Kandler, K., Scheuvens D., Emmel, C., Von Glahn, C., Petzold, A., Weinzierl, B., Veira 457
A., Ebert, M., Weinbruch, S., Schütz, L. (2011) Particle chemical properties in the vertical 458
column based on aircraft observations in the vicinity of Cape Verde Islands, Tellus B, 63, 497-459
511, http://dx.doi.org/10.1111/j.1600-0889.2011.00553.x. 460
Lin, J.C., Matsui, T., Pielke Sr., R.A., Kummerow, C. (2006) Effects of biomass-burning-derived 461
aerosols on precipitation and clouds in the Amazon Basin: a satellite-based empirical study. 462
Journal of Geophysical Research, 111, D19204, http://dx.doi.org/10.1029/2005JD006884. 463
Linke, C., Möhler, O., Veres, A., Mohácsi, Á., Bozóki, Z., Szabó, G., Schnaiter M.(2006) Optical 464
properties and mineralogical composition of different Saharan mineral dust samples: a laboratory 465
study. Atmospheric Chemistry & Physics, 6, 3315-3323, 466
http://dx.doi.org/10.5194/acp-6-3315-2006. 467
Mahowald, N.M., Baker A.R., Bergametti, G., Brooks, N., Duce, R.A., Jickells, T.D., Kubilay, N., 468
Prospero, J.M., Tegen, I. (2005) Atmospheric global dust cycle and iron inputs to the ocean. 469
Global Biogeochemical Cycles, 19, GB4025, http://dx.doi.org/10.1029/2004GB002402. 470
Park, S.S., Kim, Y.J., Fung, K. (2002) PM2.5 carbon measurements in two urban areas: Seoul and 471
Kwangju, Korea. Atmospheric Environment, 36, 1287-1297. 472
Petters, M.D., Parsons, M.T., Prenni, A.J., DeMott, P.J., Kreidenweis, S.M., Carrico, C.M., 473
Sullivan, A.P., McMeeking, G.R., Levin, E., Wold, C.E., Collet Jr., J.L., Moosmüller, H. (2009) 474
Ice nuclei emissions from biomass burning. Journal of Geophysical Research, 114, D07209, 475
http://dx.doi.org/10.1029/2008JD011532. 476
Pinnick, R.G., Fernandez, G., Andazola, E.M., Hinds, B.D., Hansen, A.D.A. and Fuller, K. (1993). 477
Aerosol in the arid southwestern United States: measurements of mass loading, volatility, size 478
distribution, absorption characteristics, black carbon content, and vertical structure to 7 km 479
above see level. Journal of Geophysical Research, 98(D2), 2651 – 2666. 480
Pio, C.A., Cardoso, J.G., Cerqueira, M.A., Calvo, A., Nunes, T.V., Alves C.A., Custódio, D., 481
Almeida, S.M., Almeida-Silva, M. (2014) Seasonal variability of aerosol concentration and size 482
distribution in Cape Verde using a continuous aerosol optical spectrometer. Frontiers in 483
Environmental Science, 2:15. http://dx.doi.org/10.3389/fenvs.2014.00015
Pio, C., Cerqueira, M., Harrison, R.M., Nunes, T., Mirante, F., Alves, C., Oliveira, C., Sanchez de 485
la Campa, A., Artíñano, B., Matos, M. (2011). OC/EC ratio observations in Europe: Re-thinking 486
the approach for apportionment between primary and secondary organic carbon. Atmospheric 487
Environment 45, 6121-6132, http://dx.doi.org/10.1016/j.atmosenv.2011.08.045. 488
Prospero, J.M., Ginoux, P., Torres, O., Nicholson S.E., Gill, T.E. (2002) Environmental 489
characterization of global sources of atmospheric soil dust identified with the Nimbus 7 total 490
ozone mapping spectrometer (TOMS) absorbing aerosol product, Review of Geophysics, 40(1), 491
1002, http://dx.doi.org/10.1029/2000RG000095. 492
Rolph, G.D., (2013) Real-time Environmental Applications and Display sYstem (READY) Website 493
(http://www.ready.noaa.gov). NOAA Air Resources Laboratory, College Park, MD. 494
Satheesh, S.K., Krishna Moorthy, K. (2005) Radiative effects of natural aerosols: a review. 495
Atmospheric Environment, 39, 2089-2110, http://dx.doi.org/10.1016/j.atmosenv.2004.12.029. 496
Schmid, H., Laskus, L., Abraham, H. J., Baltensperger, U., Lavanchy, V., Bizjak, M., Burba, P., 497
Cachier, H., Crow, D., Chow, J., Gnauk, T., Even, A., ten Brink, H. M., Giesen, K., 498
Hitzenberger, R., Hueglin, C., Maenhaut, W., Pio, C., Carvalho, A., Putaud, J.-P., Toom-499
Sauntry, D. & Puxbaum, H. (2001). Results of the “carbon conference” international aerosol 500
carbon round robin test stage I, Atmospheric Environment, 35, 2111-2121. 501
Soto-García, L.L., Andreae, M.O., Andreae, T.W., Artaxo, P., Maenhaut, W., Kirchstetter, T., 502
Novakov, T., Chow, J.C., Mayol-Bracero, O.L. (2011) Evaluation of the carbon content of 503
aerosols from the burning of biomass in the Brazilian Amazon using thermal, optical and 504
thermal-optical analysis methods. Atmospheric Chemistry and Physics, 11, 4425-4444. 505
Tesche, M., Gross, S., Ansmann, A., Müller D., Althausen, D., Freudenthaler, V., Esselborn, M. 506
(2011) Profiling of Saharan dust and biomass-burning smoke with multiwavelength polarization 507
Raman lidar at Cape Verde, Tellus B, 63, 649-676, 508
http://dx.doi.org/10.1111/j.1600-0889.2011.00548.x. 509
Torrent, J., Schwertmann, U., Fechter, H., Alferez, F. (1983) Quantitative relationships between soil 510
color and hematite content, Soil Science, 136(6), 354-358. 511
Weingartner, E., Saathoff, H., Schnaiter, M., Streit, N., Bitnar, B., Baltensperger, U. (2003) 512
Absorption of light by soot particles: determination of the absorption coefficient by means of 513
aethalometers, Journal of Aerosol Science, 34, 1445-1463. 514