Tests to evaluate the physiological potential of Mombasa grass seeds
1Testes para avaliação do potencial fisiológico de sementes de capim-mombaça
Francisco Elder Carlos Bezerra Pereira2*, Cibele Chalita Martins2, Tatiane Sanches Jeromini2, FranciscoGuilhien Gomes-Junior3 and Salvador Barros Torres4
ABSTRACT - Identifying fast and efficient tests to evaluate the vigor of forage grass seed lots is desirable in the quality
control programs of the companies in this sector. Thus, the objective was to evaluate the efficiency of vigor tests on the physiological quality of seeds of Panicum maximum, cv. Mombasa, for the differentiation of lots and prediction of seedling emergence in the field. Nineteen seed lots were subjected to evaluations of moisture content, germination, first count, germination speed index, seedling emergence in sand, first count of seedling emergence in sand, seedling root and shoot lengths, seedling emergence in the field and computerized analysis of seedling images obtained through SVIS® software. The experimental design was completely randomized for the tests performed in the laboratory and
randomized blocks for the emergence test in the field. The data were subjected to analysis of variance and the means were compared by Scott-Knott test at 5% probability level. Cluster analysis of seed lots and principal component analysis were performed. The uniformity index, evaluated by image analysis and by the root length test, is efficient in evaluating the physiological potential of seeds of Panicum maximum, cv. Mombasa, providing information similar to those obtained with the test of seedling emergence in the field.
Key words: Panicum maximum. SVIS®. Principal component. Vigor. Image analysis.
RESUMO - A identificação de testes rápidos e eficientes para a avaliação do vigor de lotes de sementes de gramíneas
forrageiras são desejáveis nos programas de controle de qualidade das empresas deste setor. Sendo assim, objetivou-se avaliar a eficiência de testes de vigor na qualidade fisiológica de sementes de Panicum maximum, cv. Mombaça, para a diferenciação dos lotes e previsão de emergência de plântulas em campo. Dezenove lotes de sementes foram submetidos às avaliações de teor de água, germinação, primeira contagem, índice de velocidade de germinação, emergência de plântulas em areia, primeira contagem de emergência de plântulas em areia, comprimento de raiz e parte aérea de plântulas, emergência de plântulas em campo e análise computadorizada de imagens de plântulas obtidas por meio do Software SVIS®.
O delineamento experimental utilizado foi o inteiramente casualizado para os testes realizados em laboratório e blocos ao acaso para o teste de emergência em campo. Os dados foram submetidos à análise de variância e as médias comparadas pelo teste de Scott Knott a 5% de probabilidade. Realizou-se a análise de agrupamento dos lotes de sementes, e de componentes principais. O índice de uniformidade, avaliado por meio da análise de imagens e pelo teste de comprimento de raiz, é eficiente na avaliação do potencial fisiológico de sementes de P. maximum, cv. Mombaça, fornecendo informações semelhantes à emergência de plântulas em campo.
Palavras-chave: Panicum maximum. SVIS®. Componente principal. Vigor. Análise de imagens.
DOI: 10.5935/1806-6690.20200009 *Author for correspondence
Received for publication 31/07/2018; approved on 24/06/2019
1Parte da Tese do primeiro autor apresentada ao programa de Pós-Graduação em Agronomia (Produção Vegetal) da Faculdade de Ciências
Agrárias e Veterinárias/UNESP/FCAV
2Departamento de Produção Vegetal, Faculdade de Ciências Agrárias e Veterinárias/FCAV, Universidade de São Paulo/UNESP, Jaboticabal-SP, Brasil,
eldercarlos12@gmail.com (ORCID ID 0000-0001-7444-8543), cibele.chalita@unesp.br (ORCID ID 0000-0002-1720-9252), tatiane_jeromini@ hotmail.com (ORCID ID 0000-0003-0810-3111)
3Departamento de Produção Vegetal, Escola Superior de Agricultura Luiz de Queiroz/ESALQ, Universidade de São Paulo/USP, Piracicaba-SP, Brasil,
francisco1@usp.br (ORCID ID 0000-0001-9620-6270)
4Departamento de Ciências Agronômicas e Florestais, Universidade Federal Rural do Semi-Árido/UFERSA, Mossoró-RN, Brasil, sbtorres@ufersa.
INTRODUCTION
Panicum maximum Jacq. cv. Mombasa is a forage
grass used for the formation of pastures in tropical regions of Brazil and other countries of America and Africa (MENDONÇA et al., 2014). According to these authors, this cultivar is used because of its high capacity for dry matter production, vigorous tillers, easy establishment, forage quality, acceptance by animals and drought tolerance. Due to these characteristics, there has been a great demand for high quality seeds of the cultivar Mombasa (MELO et al., 2016).
Seed vigor tests are used by the companies in the sector, along with the germination test, in the quality control of the lots. However, the germination test may overestimate the physiological potential of seeds because it is performed under ideal conditions of laboratory environment (MARCOS-FILHO, 2015; TOMAZ et al., 2016). Thus, vigor tests provide additional information to those obtained in the germination test and that allows assisting in the differentiation of lots and internal decision-making by the companies regarding the priorities of commercialization and storage (SILVA et al., 2017).
Studies carried out using different vigor tests for seeds of other forage species, such as forage turnip (Raphanus sativus L. var. oleiferus Metzg.) (OLIVEIRA
et al., 2017), ‘BRS Piatã’ palisade signal grass (Brachiaria brizantha) (SILVA et al., 2017) and ryegrass (Lolium multiflorum L.) (LOPES; FRANKE, 2010), have found
that the most promising tests to evaluate the physiological potential were those of first count of germination, emergence and first count of seedlings in sand.
Analysis of digital images of seedlings is a relatively recent alternative to evaluate the vigor of seed lots and has been used in order to obtain information rapidly, consistently and objectively, because it is a procedure that does not involve the analyst directly. One of the software programs that has been used is the Seed Vigor Imaging
System (SVIS®), developed by the Ohio State University
(OSU) for lettuce seeds (SAKO et al., 2001). This program performs the digital processing of scanned images of seedlings and establishes indices of vigor and uniformity (values from 00 to 1000, directly proportional to vigor), besides providing average values of seedling length (cm) (KIKUTI; MARCOS-FILHO, 2013).
It is worth pointing out that, in order to compare the information provided by the image analysis method with the results obtained by the vigor tests and adjust this new methodology for seeds of different species, it is necessary to conduct further studies, such as those with promising results for peanut seeds (MARCHI; CÍCERO; GOMES-JUNIOR, 2011), maize (ALVARENGA; MARCOS-FILHO; GOMES-JUNIOR, 2012) and sunflower
(ROCHA; SILVA; CÍCERO, 2015). For these species, it was found that SVIS® software has been an efficient tool
for analyzing seed vigor. However, similar studies with P.
maximum seeds have not yet been found.
In view of the above, the objective was to evaluate the efficiency of vigor tests on the physiological quality of seeds of Panicum maximum, cv. Mombasa.
MATERIAL AND METHODS
The 19 commercial lots of seeds of P. maximum, cv. Mombasa, used in the study were mechanically harvested by ground sweeping in the 2015 season.
Subsequently, the lots were placed in a single-layer paper package and sent to the Seed Analysis Laboratory of the Plant Production Department belonging to the Faculty of Agrarian and Veterinary Sciences of the Jaboticabal Campus - UNESP. The seed lots were stored in cold chamber (9 ± 2 ºC and RH 45 ± 5%) To avoid loss of quality during the experimental period (CARVALHO; NAKAGAWA, 2012).
The physiological potential of each lot was evaluated by means of the tests and determinations described below.
Moisture content: two subsamples of 2.0 g of seeds per lot were placed in an oven at 105 ± 3 ºC for 24 hours (BRASIL, 2009). The results were expressed in percentage.
Germination test: four subsamples of 100 seeds were distributed on two sheets of blotting paper moistened with a volume of water equivalent to 2.5 times their dry weight, within transparent plastic boxes (11.0 x 11.0 x 3.5 cm), at 20-30 °C and 8-h photoperiod for 28 days. At the end of this period, the normal seedlings were counted and the results were expressed in percentage (BRASIL, 2009).
First count of germination: determined jointly with the germination test in the counting performed on the third day after installation and with results expressed in percentage of normal seedlings (TOMAZ et al., 2010).
Germination speed index: determined by daily counting the normal seedlings obtained in the germination test from the 3rd to the 28th day after sowing and calculated
according to the formula proposed by Maguire (1962). Seedling emergence in sand: the sand was washed and sterilized at 120 °C for 120 minutes, placed in plastic boxes (30.2 x 20.8 x 6.3 cm) and moistened with 60% of the water holding capacity (BRASIL, 2009). The test evaluated four subsamples of 50 seeds sown at 1 cm
depth, kept in laboratory environment (26 ± 3 ºC and RH 70 ± 10%) for 30 days, when the emerged seedlings were counted. The results were expressed in percentage (SILVA
et al., 2017).
First count of emergence: performed in conjunction with the test of seedling emergence in sand boxes, by counting the percentage of seedlings emerged on the fifth day after sowing (MELO et al., 2016).
Root and shoot lengths: performed with four subsamples of 10 seeds sown in paper towel roll moistened with a volume of water equivalent to 2.5 times its dry weight and kept at 25 °C. On the 10th day after installing
the test, the normal seedlings were measured from the collar to the tip of the root and from the collar to the end of the plumule, using a ruler graduated in millimeters, and the results were expressed in centimeters per seedling (OLIVEIRA et al., 2014).
Seedling emergence in the field: carried out with four replicates of 50 seeds for each lot, sown at 1 cm depth in 1.0-m-long furrows spaced by 0.3 m, with counts of emerged seedlings performed on the 35th day after sowing,
and the results were expressed in percentage (MELO et al., 2016). During the test period, the daily average maximum and minimum temperatures of the field environment were 31 ± 3 and 18 ± 3 ºC, respectively, with mean relative humidity of 79.5% and rainfall of 135.2 mm.
Computerized analysis of seedlings: eight replicates of 25 seeds were sown on paper towel previously moistened with a volume of water equivalent to 2.5 times its dry weight and kept at 25 ºC for 7 days. The largest
P. maximum seedling found in the test was identified and
measured. This seedling had length of 15.24 cm from the root tip to the apex of the plumule, and this value was used to adjust the software program for evaluating the uniformity and vigor indices.
Then, all seedlings were transferred to a black cardboard sheet and the images were captured using the HP Scanjet 2004 scanner, mounted upside down within an aluminum box (60 x 50 x 12 cm) and operated by Photosmart software, with 300 DPI resolution. The images of the seedlings were analyzed using the SVIS®
(Seed Vigor Image System) software program installed in Pentium IV computer, with 2.0 GHz CPU, 768 MB RAM and 40 Gb HD. Uniformity and growth parameters were generated as described by Hoffmaster et al. (2003).
The experimental design was completely randomized for the tests performed in the laboratory and randomized blocks with four replicates for the seedling emergence test conducted in the field. The tests evaluated with SVIS® used a completely randomized design with eight
replicates. Data from each test were previously tested for
normality by the Shapiro-Wilk test and homoscedasticity by the Cochran test. The analysis of variance and means were compared by the Scott-Knott test (p ≤ 0.05).
Multivariate analyses were carried out after standardizing the variables and each one had mean 0 and variance 1. The analysis by the hierarchical method was processed by calculating the Euclidean distance between the lots for the set of eleven variables and using Ward’s algorithm to obtain the groups of similar lots (SNEATH; SOKAL, 1973). Principal component analysis was based on Ward’s groups (HAIR et al., 2005). All multivariate analyses were processed in the program STATISTICA version 7.0.
RESULTS AND DISCUSSION
The values referring to the initial moisture content of Mombasa grass seeds were similar for the 19 lots studied, ranging from 8.9 to 11.0%. Therefore, it could be inferred that seed moisture content did not interfere with the results obtained in the vigor tests studied (SILVA; BARBOSA VIEIRA, 2017; SILVA et al., 2017).
Seedling emergence in the field was used as a reference for selecting the vigor tests (OLIVEIRA et al., 2017; SILVA et al., 2017). The lots were classified into four classes of vigor: high (lots 1 and 2), medium-high (lots 3 to 11), medium-low (lots 12 to 18) and low vigor (lot 19) (Table 1). This criterion was used because one of the purposes of the vigor tests is to evaluate the physiological quality of the seeds in order to differentiate lots regarding the level of vigor and predict seedling emergence in the field (MARCOS-FILHO, 2015; OLIVEIRA et al., 2017; SILVA et al., 2017).
Although the studies on vigor tests for seeds of cereals such as maize (GRZYBOWSKI; VIEIRA; PANOBIANCO, 2015) and millet (MACHADO et al., 2012) recommend that these tests have the function of differentiating seed lots with similar percentages of germination, this premise is difficult to be fulfilled for tropical forage grasses because the lots of seeds of these species have greater differences of germination than those of seeds of major crops (LAURA et al., 2009). In addition, it is common to find lots of seeds of tropical forage grasses with low purity levels, thus contributing to a lower percentage of germination.
The standards recommend values above 40% of germination for the commercialization of Mombasa grass seeds (BRASIL, 2008), whereas for maize, soybean and rice these values should be above 80 or 85%, comprising lots of more similar physiological quality (BRASIL, 2013). The lots of Mombasa grass seeds used in the present study
Lots EF G FCG GSI ES FCE SHL RTL SDL cm Indexes --- % --- --- % --- cm seedling-1 VI UI 1 60 a* 83 a 47 b 22.74 a 83 a 79 a 5.8 a 2.9 b 6.4 b 784 c 827 a 2 59 a 62 c 53 a 19.32 b 83 a 68 b 5.6 a 3.8 a 7.2 a 876 a 820 a 3 52 b 75 b 60 a 22.62 a 85 a 73 a 5.6 a 3.6 a 7.0 a 812 b 842 a 4 51 b 65 c 26 c 16.92 b 76 b 67 b 5.4 a 3.1 b 5.9 b 780 c 788 b 5 48 b 65 c 44 b 18.09 b 75 b 61 c 5.0 a 4.0 a 3.7 d 583 f 823 a 6 47 b 66 c 50 b 17.36 b 82 a 57 c 5.4 a 3.1 b 6.2 b 754 c 819 a 7 46 b 68 c 62 a 21.69 a 84 a 66 b 5.1 a 3.9 a 4.3 c 702 d 695 c 8 46 b 56 d 41 b 16.45 b 70 c 59 c 4.9 a 3.5 a 6.7 a 868 a 789 b 9 45 b 55 d 35 c 15.78 b 76 b 58 c 5.5 a 4.5 a 7.7 a 865 a 843 a 10 44 b 54 d 40 b 16.44 b 60 d 51 d 4.3 b 3.4 a 2.1 e 485 f 702 c 11 43 b 54 d 41 b 16.43 b 65 c 48 d 4.7 a 3.5 a 6.1 b 827 b 767 b 12 41 c 60 c 32 c 18.01 b 82 a 63 c 3.4 b 2.6 b 3.9 e 556 f 716 c 13 41 c 53 d 20 d 12.92 c 66 c 42 d 4.7 a 3.2 b 4.5 c 722 d 697 c 14 36 c 53 d 32 c 14.62 c 71 c 59 c 4.7 a 2.9 b 5.5 b 765 c 736 c 15 31 c 54 d 36 c 15.56 b 79 b 46 d 5.3 a 4.0 a 5.5 b 724 d 794 b 16 39 c 48 e 27 c 12.68 c 71 c 44 d 4.7 a 4.3 a 4.2 c 657 e 720 c 17 37 c 43 e 27 c 11.44 c 71 c 49 d 5.5 a 3.8 a 4.8 c 662 e 796 b 18 36 c 40 e 14 d 10.43 c 53 d 35 d 3.1 b 1.6 c 3.7 d 634 e 640 d 19 21 d 45 e 18 d 12.17 c 69 c 46 d 4.3 b 2.8 b 4.6 c 748 c 697 c CV% 12.23 8.37 16.32 10.83 7.42 12.82 18.91 21.36 15.15 7.03 5.34
Table 1 - Seedling emergence in the field (EF), germination (G), first count of germination (FCG), germination speed index (GSI),
seedling emergence in sand (ES), first count of seedling emergence in sand (FCE), shoot length (SHL), root length (RTL), analysis of images for seedling length (SDL), vigor index (VI) and uniformity index (UI) of 19 lots of seeds of Panicum maximum, cv. Mombasa could be marketed, as they meet the official seed standards
(BRASIL, 2008).
For all 19 lots evaluated in the univariate analysis, the most promising vigor tests were the first count of germination and germination speed index, as they had 63% and 68%, respectively, of the results similar to those obtained in the emergence of seedlings in the field.
The first count of germination is based on the principle that the samples with highest percentages of normal seedlings in this count, established by the Rules for Seed Analysis (BRASIL, 2009), are more vigorous (SENA; ALVES; MEDEIROS, 2015).
The germination test and all vigor tests used were able to detect differences in the physiological potential of the seeds, but the ranking of the lots was not similar in all tests. Some were sensitive, classifying the lots in more than three classes of vigor, as in the case of
seedling emergence in the field, germination, first count of germination, seedling emergence in sand, first count of seedling emergence in sand and image analysis (seedling length, vigor index and uniformity index). Other vigor tests were less rigorous, classifying the lots into three classes of vigor or less, such as: germination speed index, shoot length and root length.
However, depending on the test adopted, the ranking of the lots with respect to vigor had divergences, which makes it difficult to interpret the results. Additionally, the large number of lots and quality parameters evaluated also hampered their ranking. For these reasons, studies on seed vigor tests performed by Barbosa et al. (2013) and Silva et al. (2017), in which more than 10 lots and quality parameters were compared, used cluster analysis as statistical tool and found better results than those obtained through univariate analysis.
Figure 1 shows that, due to the substantial variation in the values of Euclidean distance between the seed lots for the set of variables considered, it was possible to divide the original set into three groups, adopting the Euclidean distance 7 (HAIR et al., 2005). Group I comprised the variables uniformity index, root length and seedling emergence in the field. Therefore, the image analysis for uniformity index and root length by the traditional method were the best tests of vigor, because in the joint analysis of the lots there were high agreement in their classification and similarity with the reference test, seedling emergence in the field.
Shoot length, seedling emergence in sand, first count of germination, first count of seedling emergence in sand, germination speed index and percentage of germination comprised group II, meaning that these variables were less efficient in the classification of the lots compared to those in group I (Figure 1). Group III was composed of the variables of image analysis for vigor index and seedling length, which were not similar to the others and were less efficient as vigor tests.
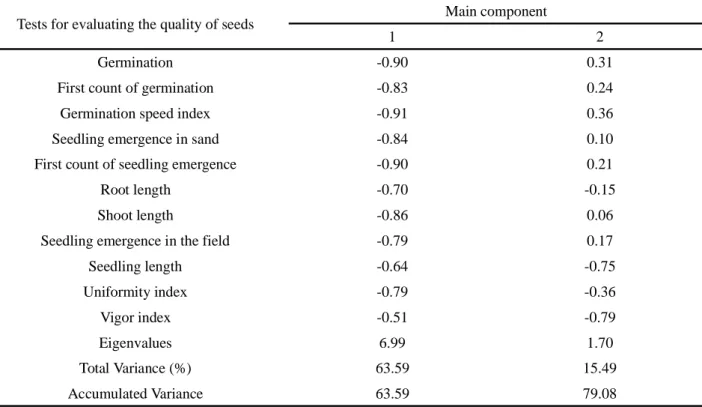
Two components with total variances of 63.59% and 15.49% (Table 2) were required to explain the variability of the data in the principal component analysis of the 19 lots of Mombasa grass seeds. The sum of these values totaled the accumulated variance of 79.08%, which
means that two components were sufficient to discriminate approximately 80% of the evaluated parameters.
Similarly, studies on vigor tests for seeds of soybean (BARBOSA et al., 2013) and palisade signal grass cv. ‘BRS Piatã’ (SILVA et al., 2017) have also found that two principal components were sufficient to explain 65.86% and 74.23%, respectively, of the variance in the discrimination of variables. However, Lorentz and Nunes (2013) observed that for rice seeds it was necessary to use three principal components, which explained 80.42% of the variability of the evaluated data.
According to Hongyu, Sandanielo and Oliveira-Júnior (2015), the discriminatory power of the variables in each principal component is measured by the value of the correlation. Therefore, it was possible to infer that there were high correlations between all variables in the principal components 1 or 2, because in at least one of them the values were higher than 0.7 (HAIR et al., 2005). The values of correlation for the variables germination percentage (-0.90), first count of germination (-0.83), germination speed index (-0.91), emergence 0.84) and first count of seedling emergence in sand (-0.90), root length (-0.70), shoot length (-0.86), seedling emergence in the field (-0.79) and image analysis for uniformity indices (-0.79) were related to the principal component 1.
Figure 1 - Dendrogram resulting from the hierarchical cluster analysis by the Ward method with the formation of groups based on the
data of germination (G), first count of germination (FCG), germination speed index (GSI), seedling emergence in sand (ES), first count of seedling emergence in sand (FCE), root length (RTL), shoot length (SHL) and image analysis for seedling length (SDL), vigor index (VI) and growth uniformity index (UI) and seedling emergence in the field (EF) of 19 lots of seeds of Panicum maximum, cv. Mombasa
Table 2 - Correlation between each principal component and the tests used to evaluate the physiological quality of 19 lots of seeds of Panicum maximum, cv. Mombasa
Tests for evaluating the quality of seeds Main component
1 2
Germination -0.90 0.31
First count of germination -0.83 0.24
Germination speed index -0.91 0.36
Seedling emergence in sand -0.84 0.10
First count of seedling emergence -0.90 0.21
Root length -0.70 -0.15
Shoot length -0.86 0.06
Seedling emergence in the field -0.79 0.17
Seedling length -0.64 -0.75 Uniformity index -0.79 -0.36 Vigor index -0.51 -0.79 Eigenvalues 6.99 1.70 Total Variance (%) 63.59 15.49 Accumulated Variance 63.59 79.08
The tests of image analysis for seedling length and vigor index were better correlated with the principal component 2, with correlations of -0.75 and -0.79, respectively. The principal component 1 should be considered more relevant than the principal component 2, because it was able to explain 63.59% of the total data variability (HAIR et al., 2005).
Thus, the tests of image analysis for seedling length and vigor index showed lower variance than the others. In addition, the latter tests showed significant correlation in the principal component 2, which was able to explain only 15.49% of the total data variability (Table 2).
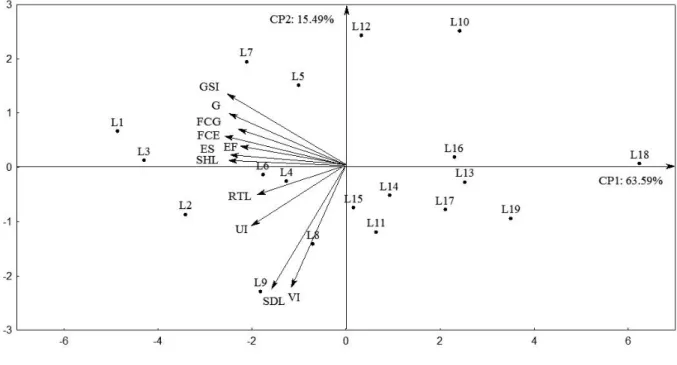
Therefore, based on the principal component analysis (Figure 2), it was possible to state that the tests located in the principal component 1 (germination, germination speed index, emergence in sand, first count of seedling emergence in sand, root length, shoot length and uniformity index) were promising in the evaluation of lots of Mombasa grass seeds aiming to rank them with respect to vigor and emergence of seedlings in the field, since the eigenvectors of these tests were close, forming an angle between them and the seedling emergence in the field in the dispersion plane.
Although all vigor tests showed correlation above 0.7 in the principal component 1 or 2, it is worth pointing
out that the tests of images analysis for growth uniformity index, root length by the traditional method and seedling emergence in the field showed greater similarity to one another, since they belong to the same group by the cluster analysis (Figure 1).
Seed vigor tests must be able to rank the lots in different classes of physiological potential and present results correlated with the emergence of seedlings in the field (OLIVEIRA et al., 2014; MARCOS-FILHO, 2015; SILVA et al., 2017; OLIVEIRA et al., 2017).
These results confirmed those observed in the comparison of means in Table 1, but in a more simplified and evident manner. Barbosa et al. (2013), Lorentz and Nunes (2013) and Silva et al. (2017), in studies on seed vigor tests, also found the efficiency and better adequacy of multivariate analysis compared to univariate analysis for identifying more promising tests of vigor when a large number of lots and parameters are compared.
Therefore, the test of root length by the traditional method and uniformity index by image analysis (SVIS®)
were the most efficient tests in the evaluation of the physiological potential of Mombasa grass seeds, aiming the selection of lots with better performance in the emergence of seedlings in the field.
Figure 2 - Eigenvectors, dispersion plane through the principal component analysis of the tests of germination (G), first count of
germination (FCG), germination speed index (GSI), seedling emergence in sand (ES), first count of seedling emergence in sand (FCE), root length (RTL), shoot length (SHL) and image analysis for seedling length (SDL), vigor index (VI), uniformity index (UI) and seedling emergence in the field (EF) of 19 lots of seeds of Panicum maximum, cv. Mombasa
CONCLUSION
The uniformity index, evaluated by image analysis, and the test of root length are efficient in evaluating the physiological potential of seeds of P. maximum, cv. Mombasa, providing information similar to that obtained with the emergence of seedlings in the field.
REFERÊNCIAS
ALVARENGA, R. O.; MARCOS-FILHO, J.; GOMES-JUNIOR, F. G. Avaliação do vigor de sementes de milho super doce por meio da análise computadorizada de imagens de plântulas.
Revista Brasileira de Sementes, v. 34, n. 3, p. 488-494, 2012.
BARBOSA, R. M. et al. Discrimination of soybean seed lots by multivariate exploratory techniques. Journal of Seed Science, v. 35, n. 3, p. 302-310, 2013.
BRASIL. Ministério da Agricultura, Pecuária e Abastecimento. Instrução Normativa n° 30, de 21 de maio de 2008. Diário Oficial
da União, Brasília, DF, 23 de maio de 2008. Seção 1, 45 p.
BRASIL. Ministério da Agricultura, Pecuária e Abastecimento. Regras para Análise de Sementes. Brasília, DF: MAPA/ACS, 2009. 395 p.
BRASIL. Ministério da Agricultura, Pecuária e Abastecimento. Instrução Normativa nº 45, de 17 de setembro de 2013. Diário
Oficial da União, Brasília, DF, 23 de maio de 2013, Seção 1,
p. 16.
CARVALHO, N. M.; NAKAGAWA, J. Sementes: ciência, tecnologia e produção. Jaboticabal: FUNEP, 2012. 590 p. GRZYBOWSKI, C. R. S.; VIEIRA, R. D.; PANOBIANCO, M. Testes de estresse na avaliação do vigor de sementes de milho.
Revista Ciência Agronômica, v. 46, n. 3, p. 590-596, 2015.
HAIR, J. F. et al. Análise multivariada de dados. 5.ed. Porto Alegre: Bookman, 2005. 593 p.
HOFFMASTER, A. L. et al. An automated system for vigour testing three-day-old soybean seedlings. Seed Science and
Technology, v. 31, n. 3, p. 701-713, 2003.
HONGYU, K.; SANDANIELO, V. L. M.; OLIVEIRA JUNIOR, G. J. Análise de componentes principais: resumo teórico, aplicação e interpretação. Engineering and Science, v. 1, n. 5, p. 83-90, 2015.
KIKUTI, A. L. P.; MARCOS-FILHO, J. Seedling imaging analysis and traditional tests to assess okra seed vigor. Journal
of Seed Science, v. 35, n. 4, p. 443-448, 2013.
LAURA, V. A. et al. Qualidade física e fisiológica de sementes de braquiárias comercializadas em Campo Grande - MS. Ciência
e Agrotecnologia, v. 33, n. 1, p. 326-332, 2009.
LOPES, R. R.; FRANKE, L. B. Teste de condutividade elétrica para avaliação da qualidade fisiológica de sementes de azevém
(Lolium multiflorum L.). Revista Brasileira de Sementes, v. 32,
LORENTZ, L. H.; NUNES, U. R. Relações entre medidas de qualidade de lotes de sementes de arroz. Revista Ciência
Agronômica, v. 44, n. 4, p. 798-804, 2013.
MACHADO, C. G. et al. Precocidade na emissão da raiz primária para avaliação do vigor de sementes de milheto. Semina:
Ciências Agrárias, v. 33, n. 2, p. 499-506, 2012.
MAGUIRE, J. D. Speed of germination aid in selection and evaluation for seedling and vigour. Crop Science, v. 2, n. 2, p. 176-177, 1962.
MARCHI, J. L.; CICERO, S. M.; GOMES-JUNIOR, F. G. Utilização da análise computadorizada de plântulas na avaliação do potencial fisiológico de sementes de amendoim tratadas com fungicida e inseticida. Revista Brasileira de
Sementes, v. 33, n. 4, p. 652-662, 2011.
MARCOS-FILHO, J. Fisiologia de sementes de plantas
cultivadas. 2. ed. Londrina: ABRATES, 2015. 660 p.
MELO, L. F. et al. Beneficiamento na qualidade física e fisiológica de sementes de capim-mombaça. Revista Ciência
Agronômica, v. 47, n. 4, p. 667-674, 2016.
MENDONÇA, V. Z. et al. Corn production for silage intercropped with forage in the farming-cattle breeding integration. Engenharia Agrícola, v. 34, n. 4, p. 738-745, 2014.
OLIVEIRA, S. S. C. et al. Seleção de progênies de nabo-forrageiro para germinação sob altas temperaturas. Ciência
Rural, v. 44, n. 2, p. 217-222, 2014.
OLIVEIRA, S. S. C. et al. Tests for the selection of forage turnip progeny to order the vigor and longevity of seeds. Revista
Caatinga, v. 30, n. 1, p. 230-236, 2017.
ROCHA, C. R. M.; SILVA, V. N.; CÍCERO, S. M. Avaliação do vigor de sementes de girassol por meio de análise de imagens de plântulas. Ciência Rural, v. 45, n. 6, p. 970-976, 2015. SAKO, Y. et al. A system for automated seed vigour assessment.
Seed Science and Technology, v. 29, n. 3, p. 625-636, 2001.
SENA, D. V. A.; ALVES, E. U.; MEDEIROS, D. S. Vigor de sementes de milho cv. ‘Sertanejo’ por testes baseados no desempenho de plântulas. Ciência Rural, v. 45, n. 11, p. 1910-1916, 2015.
SNEATH, P. H. A.; SOKAL, R. R. Numerical taxonomy. San Francisco: W. H. Freeman, 1973. 573 p.
SILVA, C. B.; BARBOSA, R. M.; VIEIRA, R. D. Accelerated aging as vigor test for sunn hemp seeds. Ciência Rural, v. 47, n. 1, p. 2015-1527, 2017.
SILVA, G. Z. et al. Evaluation the phisiological quality of
Brachiaria brizantha cv. BRS ‘Piatã’ seeds. Bioscience Journal,
v. 33, n. 3, p. 572-580, 2017.
TOMAZ, C. A. et al. Duração do teste de germinação do capim-tanzânia. Revista Brasileira de Sementes, v. 32, n. 4, p. 80-87, 2010.
TOMAZ, C. A. et al. Duração do teste de germinação de sementes de Brachiaria humidicola (Rendle) Schweick. Semina: Ciências
Agrárias, v. 37, n. 20, p. 693-700, 2016.