The influence of economic incentives and regulatory factors on
the adoption of treatment technologies: a case study of
technologies used to treat heart attacks
1. Introduction
The adoption and rapid diffusion of medical technology is argued to be a major contributory factor to the rising cost of health care services across health care systems (Cutler &
McClellan 1998; Newhouse 1992; Okunade & Murthy 2002; Weisbrod 1991), accounting for 30 – 70 % of health expenditure growth (Australian Productivity Commission, 2005; Barros, 1998; Congressional Budget Office, 2008; Pestieau, 2006; Newhouse, 1992). Such cost pressures have been attributed to costly new technologies rather than increasing costs of existing ones (Cutler et al. 1998; Cutler, McClellan, & Newhouse 1998; Cutler & McClellan 1996). Advances in medical technologies generally expand what is possible, resulting in higher total expenditure even when new technologies are associated with lower unit costs (Cutler & Huckman 2003; Weisbrod 1991).
Despite the importance of technological change, little work has been devoted to exploring how and why the adoption of medical technologies differs across health care systems (Bech et al. 2006; Dickson & Jacobzone 2003; Escarce 1996; Gratwohl et al. 2002; Lazaro & Fitch 1995; McPherson et al. 1982; Moïse 2003a; Moïse 2003b; Nystedt & Lyttkens 2003; Oh et al. 2005; Rublee 1989; Rublee 1994; Slade & Andersen 2001). Initial studies from the TECH research network provided suggestive evidence that the variability in diffusion of high-tech procedures (such as CABG and PTCA) primarily is associated with the remuneration of providers (TECH research network 2001).
Not only is there relatively little comparative empirical evidence on technology adoption across health care systems, but the evidence that exists is heavily reliant on aggregate data and only in few cases explicitly considers the role of incentives and regulations factors. The present study, based on utilisation rates aggregated from patient level data, explicitly investigates the effect of economic incentives and regulatory factors on the propensity to adopt technologies, by comparing the trends in the management of acute myocardial infarction (AMI, heart attack) in 17 countries around the world. We do, however, not consider optimal diffusion rates for any of the technologies discussed.
We analyse the adoption of three specific procedures applied to AMI patients: cardiac catheterization (CATH); coronary artery bypass grafting (CABG); percutaneous
transluminal coronary angioplasty (PTCA). The TECH investigators chose to study AMI and these three procedures for several reasons. First, AMI is a relatively common and well-defined clinical condition worldwide allowing clear international comparison of diagnostic work-up and treatment. Secondly, most AMI patients are initially hospitalised providing reliable inpatient data across countries. Thirdly, care of AMI patients has changed rapidly in recent years allowing exploration of the diffusion patterns. Fourthly, the three technologies analysed are prevalent procedures involving high fixed and marginal costs with each use. CATH is used for primarily diagnostic purposes and is a normal prerequisite to treatment
NIH Public Access
Author Manuscript
Health Econ. Author manuscript; available in PMC 2010 October 1.
Published in final edited form as:
Health Econ. 2009 October ; 18(10): 1114–1132. doi:10.1002/hec.1417.
NIH-PA Author Manuscript
NIH-PA Author Manuscript
with CABG or PTCA. Finally, the utilisation of these technologies has proven impacts on health outcomes (Hoffman et al. 2003).
The specific purpose of the present study is to identify variables that capture economic and regulatory modulators of technological change with respect to the care of AMI patients, and to explore the association between these factors and the adoption of the new technologies. The analysis is based on a unique data set containing age and gender standardised utilisation rates for the three procedures which is then merged with specifically collected data on health care system characteristics across 17 counties. This collation of primary data allows a longitudinal cross-country comparison of the diffusion of AMI procedures as it relates to specific economic incentives and regulatory factors across countries, as the degree of variation in these dimensions is much greater across countries rather than within countries, while also detecting any time trends.
The remainder of this paper is organised as follows. The data sources are described in section 2 and the econometric approach in section 3. Section 4 provides our results in two steps: first, the three AMI technologies are analysed as independent procedures, and secondly, the interdependence between them is modelled in a pseudo 2SLS procedure. The results are extensively discussed in Section 5, while the main conclusions are summarised in Section 6.
2. Data and methods
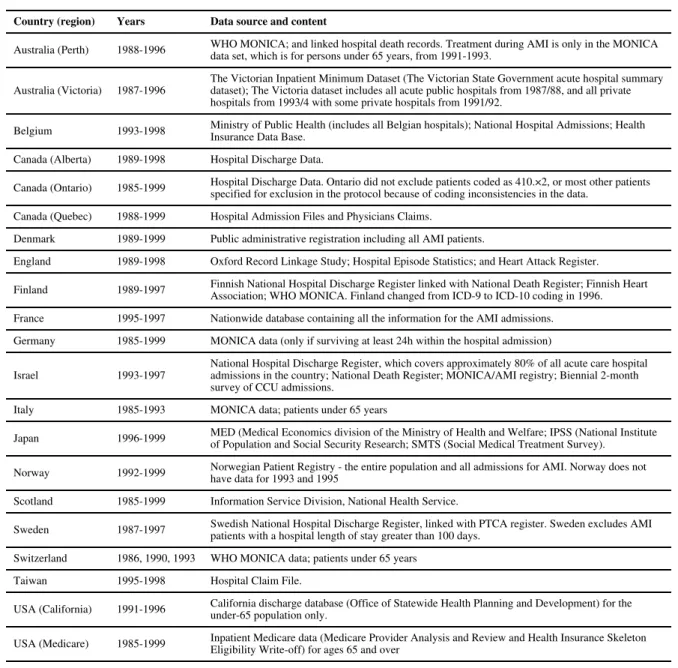
Data were collected from 17 countries for this analysis and include Australia, Belgium, Canada, Denmark, England, Finland, France, Germany, Israel, Italy, Japan, Norway, Scotland, Sweden, Switzerland, Taiwan and USA. A number of countries are represented by more than one region as data were available regionally. Thus Australia is represented by two regions: Victoria and Perth; Canada is represented by three regions: Alberta, Ontario and Quebec; and the USA is represented by data from California and from the Medicare system, respectively. Data from these 17 countries represent a wide range of health care systems in terms of their arrangements for funding, provision, reimbursement and regulation and form an unbalanced panel as not all countries have data on procedure rates for the whole period 1985-1999.
Data from a number of sources were collected for this study. The dependent variables, the proportion of AMI patients undergoing one of the procedures (CATH, CABG, PTCA), are aggregated proportions calculated from unique micro level data collected at the individual patient level on hospitalised AMI patientsc over the period 1985-1999 and standardised to ensure consistency. The TECH central coordinating centre distributed a protocol and programs to aggregate the data consistently into subgroups for use in further analyses. The consistent aggregation served two purposes: 1) it allowed data sharing among countries subject to severe confidentiality requirement about releasing individual data outside of the country's investigative team, and 2) it allowed data analysis identical to that which would have been achieved with pooling of individual patient level data. The nationally or regionally representative micro-data were aggregated into age and gender rates for all variables of interest by taking the weighted-mean of country-specific data. The data sources for the procedure rates are presented in Table 1.d
cAn AMI hospitalised patient was defined exactly and standardised according to a pre-agreed protocol. For specific definitions see TECH Research Network (2001) and McClellan & Kessler (2002).
dThe data used here include the proportion of patients receiving one of the procedures at the hospital admission in which AMI is diagnosed. A sub-set of the countries provided linked patient data where the proportion of patients undergoing one of the procedures was recorded within a predefined period (365 days) after the admission. The original data sets upon which the TECH data are based are documented as are a fuller set of results in Bech et al. (2006).
NIH-PA Author Manuscript
NIH-PA Author Manuscript
In this study, the dependent variable is taken to be an indicator of the degree of
technological adoption and diffusion and is defined as the proportion of the AMI population in each of the countries and regions undergoing one of the three procedures by year during the time period 1985-1999. These dependent variables are defined as procedure rates and are calculated as the number of AMI patients receiving one of the three procedures divided by the number of patients diagnosed with AMI by year and are calculated for each procedure. The procedure rates are age and gender adjusted and standardised to the AMI population in United States in 1995 (see McClellan and Kessler (2002) for full definitions).
Data collection as it related to the explanatory variables was primarily intended to capture the measurable impact that incentive and regulatory characteristics had on the three technologies under study: CATH, CABG and PTCA. Given that interest is primarily in the role of country level institutions and regulation on technological up-take and diffusion a general heuristic model was developed to allow the greatest degree of comparison across countries. While it has been argued, for example by Barros (1998), that health care
technology is an exogenous force in determining health care expenditure, the supposition in this paper is that different country-level structures affect the rate of up-take and diffusion and hence expenditure. Acknowledging that institutions and regulations evolve in different ways in different countries over time, the empirical models developed below nevertheless seek to determine broad relationships between different regulatory regimes and technology diffusion. Accepting the argument that health care technology does play a major role in explaining health care expenditure growth, the empirical models provide evidence on the responses of technology diffusion to various system characteristics and the role that regulation has on diffusion and thus, indirectly, health care expenditure.
The data for the explanatory variables were collected from two sources, the most important of which was a questionnaire defining vital institutional parameters that describe the economic and regulatory incentives embodied in health care systems. The survey was distributed to TECH research members in 2004.e The aim of this questionnaire was to characterise the various health care systems by a number of institutional characteristics relevant to the adoption and diffusion of the procedures under study. All TECH members were surveyed regarding the situation in their own country or region. Inevitably, as those familiar with the problems of classifying health care systems will immediately recognise, such depiction entails a series of generalisations which nevertheless allow a health care system to be characterised in a meaningful manner for econometric analysis. To ease both data collection issues and avoid a minefield of transitory data precisely tracking system changes in each country over the period 1985-1999, the data on economic incentives and regulatory frameworks were necessarily crude, somewhat static and aggregate. The guiding objective for classifying the various health care systems was to discern broad trends associated with specific characterisations, such that findings at this level would be accepted as relatively strong indication of specific, non-trivial impact. To enable quantitative analysis, most institutional variables are coded as dichotomies, resulting in further simplifications in the classification of a country's health care system. The second main data source, the OECD Health Database (2003), was used to collect data on GDP and the proportion of health care expenditure based on public financingf. Note that a time trend is also included in the econometric specifications below.
eThe survey included 12 questions. Respondents are members of the TECH research group comprised of experienced medical, health services, and economics researchers. Each country (regional) team responded to the survey. At least one individual from each country answered the survey and in most cases more than one member of research group validated the information. The authors categorised the information into dichotomous variables, and this categorisation was validated by all respondents by email and by the members of the TECH research group attending two meetings.
fOECD data were not available for Israel and Taiwan, as these countries are not members of OECD, so GDP and public finance share data for those countries were collected from national sources.
NIH-PA Author Manuscript
NIH-PA Author Manuscript
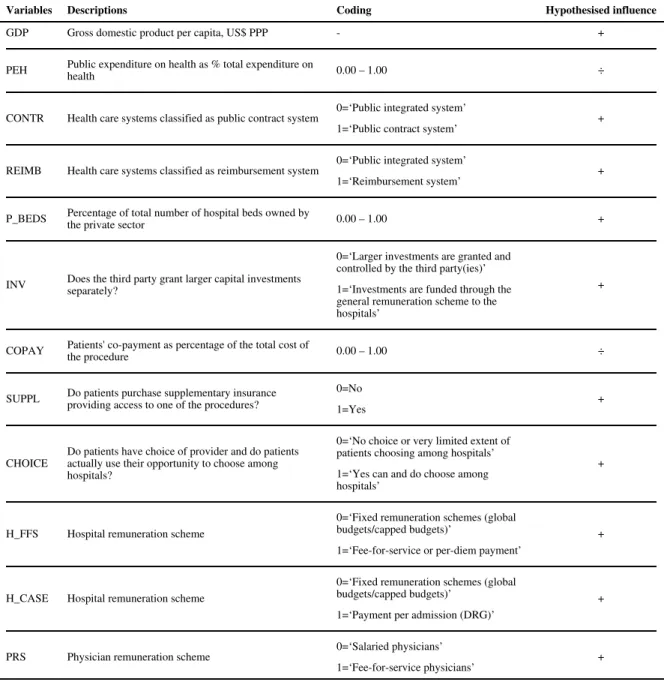
The explanatory variables are listed in Table 2 where their hypothesised influence on the adoption and diffusion of CATH, CABG and PTCA are also indicated. For example, increasing GDP per capita is expected to have a positive sign indicating a greater willingness by wealthier countries to adopt and to diffuse health care technology. On the basis that the higher the proportion of total health expenditure being publicly financed (PEH), the greater the level of regulatory constraints, a negative relationship is expected.
The overall organisation of any individual health care system was classified into three categories: the reimbursement, the public contract, and the public integrated system (Hurst 1991; OECD 1994) represented by two dummy variables either indicating a reimbursement model (REIMB), e.g. Israel, Switzerland, USA, or a contract model (CONTR), e.g. France, Italy, Taiwan, with countries having an integrated health care system, e.g. England, Scotland, the Nordic countries, being the reference category.g Both the above models are expected to have increased adoption and diffusion as compared to this reference case. The regulatory environment is described by two elements. The percentage of total hospital beds owned by the private sector (P_BEDS) is used as a proxy for the public authorities' (lack of) direct influence over the providers and a higher percentage is hypothesised to be associated with a higher utilisation rate. The second measure of the regulatory environment is whether the payer(s) control larger investments (INV) directly through separate granting
arrangements. For example, a provider receiving a global budget may - or may not – be allowed to chose to allocate part of the budget to investments in facilities for high-tech procedures. INV takes the value 1 if larger investments are funded through the general remuneration scheme in this or other ways (e.g. investments are covered through general overheads on fee-for-service changes or DRG changes). A positive relationship is hypothesised, indicating that funding of capital-investments from general hospital remuneration have a positive influence on uptake and diffusion compared to when large investments are granted and controlled through a separate process by one or more third parties.
The demand side of the health care systems as it relates to technology uptake and diffusion is described by three variables. Patients' co-payment (COPAY) for the specific procedures varies widely between health care systems and is hypothesised to be negatively associated with utilisation rates. The existence of supplementary insurance to cover the cost of the specific procedures (SUPPL) in some health care systems may, on the other hand, encourage the adoption of new expensive technology. If patients are given the opportunity to choose provider (CHOICE), providers may also be encouraged to compete for patients and may attract patients with new and expensive technologies, although arguably general competition may also reduce uptake of new technologies if unit costs are higher. As discussed in a number of studies, health care providers' remuneration systems provide incentives with respect to the adoption of various technologies (Greenberg et al. 2001; Moïse 2003b; Okunade & Miles 1999; Slade & Anderson 2001). Given the potential importance of these variables, the hospitals' remuneration scheme is described by two dummy variables: H_FFS where health care systems applying fee-for-service (FFS) remuneration systems and H_CASE where health care systems applying per case remuneration (e.g. DRG-based) are compared to countries applying fixed remuneration schemes, (i.e. global budgets and capitation) with the latter being the reference category. Fee-for-service (FFS) and per case
gCountries categorised in the reimbursement model are dominated by competing health insurers and no direct connection between insurers and competing providers. Countries categorised in the contract model are dominated by one health insurer who contracts with (competing) providers which are not typically vertically integrated with the insurer. Countries categorised in the public integrated model are dominated by direct payment of providers in a vertically integrated organization of providers and third-party payer. Inevitably classification of health care systems entails a series of generalisations and most countries have a “mixed” system. Each country was placed in the category which is dominant or valid for the majority of the AMI patients in the country, during the specified time period.
NIH-PA Author Manuscript
NIH-PA Author Manuscript
remuneration systems are hypothesised to have a higher utilisation rate than systems applying fixed remuneration schemes. Physicians' incentives are described by their
remuneration scheme (PRS), with fee-for-service physicians (PRS=1) hypothesised to imply a higher utilisation rate than salaried physicians. The categorisations of the country on the above dichotomous variables are listed in Table 3. Obviously, some of the cross-cells for these categorisations contain only few observations. Thus, while it may be theoretically relevant to enhance the specification, in particular with interactions among these categories, the outcome of such an exercise would be questionable. We therefore refrain from such enhancement.
3. Econometric model
Two types of analyses are performed. First, the determinants of the utilisation of specific procedures are analysed in a number of models in which the procedure rates are assumed to be independent of each of other. Secondly, the analysis takes the interdependence of the procedures into account in a simultaneous equations system using a two-stage least square (2SLS) estimator.
Assuming independent procedure rates estimation is based on the dependent variable, specified as the proportion of patients in country n at time t receiving one of the three procedures i, and can thus be thought of as the unconditional probability that a patient receives the procedure in question. Assuming a logistic distribution over these probabilities, the model is given as:
(1)
where yint is the proportion of acute myocardial infarction cases that received the specific procedure i in country n in the year t. Analyses are made separately for i=1 (CATH), i=2 (CABG), and i=3 (PTCA). The vector of explanatory variables xnt includes K characteristics for each country during each year. A simple time trend as well as interactions between the time trend and the explanatory variables are included but not spelled out in equation (1). The model was estimated through applying Weighted Least Squares (WLS), to account for heterogeneity, due to a logit transform of equation (1). The marginal effect mi of the k
variable as reported in the result section is defined terms of the marginal change in the procedure rate yi as a result of a one unit increase in xint kh.
As an alternative to the above model, it may be assumed that the utilisation rates of the three procedures are not independent, but rather determined sequentially (Cutler & Huckman 2003). The diagnostic procedure, CATH, is normally a prerequisite for CABG and PTCA. Increasing the utilisation of CATH enables higher utilisation of CABG and PTCA and intentions to increase CABG and PTCA necessitates increasing rate of CATH. The two treatment procedures, CABG and PTCA, are (partially) substitutes, so that the signs of the effect of CABG on PTCA and vice versa are ambiguous, as these effects are composed of negative substitution effects plus an expected positive association caused by “economy of
hAs a result of the logit transformation of (1), βi represents the marginal effect on the logit of yint, which is not easily interpreted.
Rather, the marginal effect on yint itself is interesting. This is derived as . Thus, the interpretation of the marginal effect mik of the k'th explanatory variable, xint k, is that if xint k is increased one unit, then the procedure rate yi is increased mik units.
NIH-PA Author Manuscript
NIH-PA Author Manuscript
scope” effects (i.e. the build-up of technology, know-how and capacity caused by increasing one procedure rate also facilitates increases in the other procedure rate).
The three procedure rates may thus be specified through a simultaneous system of three equations. For identification and consistent two-stage estimation, it is necessary to identify instrumental variables within this system of equations. Specifically, letting i=1 refer to CATH, i=2 to CABG and i=3 to PTCA, and suppressing for ease of notation the subscript
nt, the system may be written as
(3)
(4)
(5)
where refers to the coefficient for yh in the equation for yi, X to the exogenous variables entering all three equations, to the exogenous variables which enters the equation for yi
but not the equation for yh, and to the relevant partitioning of the coefficient vector βi.
The key for identification and (pseudo-)consistent estimation of the equation for yi are the exogenous variables , which can be used as instruments for yh (h≠i) with the restriction that the used as instruments are correlated with yh but not with yi. Obvious candidates are variables which are found to be significant for the former but insignificant for the latter in one or more of the WLS logit regressions without interdependence or the instrumentalised WLS logit regression.
Thus a 2SLS approach for (pseudo-)consistent estimation of the equation for procedure rate i
is suggested as follows: Step 1, perform a WLS logit estimation of yh on (i.e. on those explanatory variables that enter the equation for technology yh but not the equation for
technology yi) and obtain the estimated procedure rates (h≠i); Step 2 perform a WLS logit estimation of yi on y̑h, (h≠i), and X. This procedure is deemed
“pseudo-consistent” in the sense that although consistently instrumentalises Λ−1 (yh), it is not formally guaranteed that this consistency ensures consistent instrumentalisation of
yh by , this is merely assumed to be the case. The final instrumental variables used are listed in Table 8.
4. Results
The simple descriptive statistics in Table 4 reveal major differences in the level of the utilisation rates across countries, although these should be compared with caution as the observations from each country originate from different time periods (cf. Table 1). The mean utilisation rate of the diagnostic procedure CATH varies from 1.22% (Finland) up to
NIH-PA Author Manuscript
NIH-PA Author Manuscript
76.82% (Japan) in this sample of AMI patients. For CABG the mean utilisation rate varies from 0.08% (Norway) up to 11.79% (US-California). The utilisation rate of PTCA varies from 1.06% (Finland) up to 52.57% (Japan). This descriptive information indicates that countries categorised by the health care system variable as public integrated systems have a much lower adoption rate compared to countries categorised as reimbursement systems. Note that not all AMI patients are expected to receive one of the procedures since some are too sick to undergo a procedure and are better candidates for thrombolytic as opposed to invasive procedures.
Results from three regression models will be presented. The first model includes only a simple time trend (t) as an explanatory variable. The second model includes a simple time trend (t) and the K explanatory variables in Table 2. The third model further adds the K
explanatory variables interacted with a time trend. The coefficient on the simple time trend model presents the unconditional increase in the utilisation of the three technologies over time. The βi coefficients (reported as the marginal effects mi) generally relate to the impact of the economic and institutional variables on the level of the utilisation of the three technologiesi. The coefficients of the interaction terms present information on whether the variables have an increasing or decreasing impact over time on the utilisation rate.
Assuming the three technologies to be independent, results from the three types of models are presented separately for the three technologies in Tables 5-7. Assuming interdependence, inclusion of the utilisation rates of the two procedures directly in the regression as
determinants of the third procedure is pursued through the use of instrumental variables as explained above. The results from the simultaneous equation system with instrumental variables are reported in Table 8. The first three rows of results in Table 8 report the impact of the utilisation rates of the two other procedures.
A log-likelihood test is performed to examine the performance of the various models. These results are also reported in Tables 5-8.j With the exception of the analyses relating to catheterisation (CATH), the models including the institutional and economic incentives and interaction terms (Model 3) seem to better explain the diffusion rates than the model with institutional and economic factors alone (Model 2).
Tables 5-8 report the marginal effects. In general, the majority of the dependent variables have the expected sign (when they are significant), but there are several notable exceptions. For ease of interpretation, the average rates of the dependent variables have been inserted in the first row in the tables. The simple time trend (t) is, as expected, positive in nearly all models meaning that the utilisation of the three procedures is increasing over time.
The association with GDP per capita is positive and significant in most analyses. Hence GDP had the expected sign in 7 out of 9 results presented in Tables 5–8, and was particularly robust in the 2SLS analyses (Table 8) with two significant results having the expected sign. As an example of interpretation, a 1 percent increase in GDP results in an increase in the CATH rate by 0.0731 according to model 2 in Table 5. Moreover, the interaction terms in model 3 have a negative sign implying that while the impact of GDP per capita is positive with regards to the adoption of the medical technologies under study, this association generally decreases over time. While most other variables show no consistent
iOne should note that the various independent variables are measured in different units. The variables PEH, P_BEDS, and COPAY are measured in percentages while the rest are dummy variables, except for t and ln(GDP).
jThe log likelihood tests are based on comparing the constrained models with the unconstrained models where LogL is the model's log-likelihood, and Log0 is the likelihood that would be obtained in the absence of any explanatory variables. The LRI statistics for the analyses is an index which is calculated as 1 minus (LogL/Log0). The index is not necessarily restricted to the range 0 - 1. The higher the index, the more preferred is the full (unconstrained) model at the pre-specified significance level.
NIH-PA Author Manuscript
NIH-PA Author Manuscript
time pattern, the association with physician remuneration scheme (PRS) diminishes over time as do the variables depicting the type of health care system with regards to form of contracting (CONTR) and reimbursement (REIMB) in the 2SLS analyses reported in Table 8.
Both variables representing the type of system (contract systems (CONTR) and
reimbursement systems (REIMB)) have the expected positive effects on the utilisation of all three procedure rates of CATH and PTCA. The coefficients defining the type of system are positive when significant, indicating that countries with publicly integrated systems (the reference category) have lower utilisation rates compared to other institutional
arrangements. Furthermore, it was expected that countries characterised as a reimbursement system would have the highest utilisation rates (REIM) and the results indicate that this appears to be the case, as the coefficient for REIMB is almost invariably larger than that for CONTR, although looking specifically at the results in Table 8 this impact seems to diminish over time, (cf. the negative signs of t×CONTR and t×REIMB). To investigate whether the differences between the coefficients for CONTR and REIMB are significant, we calculated Wald tests for each technology. It was found that the difference is strongly significant for CATH (p=0.009) but not for CABG (p=0.189) and only weakly significant for PTCA (p=0.074).
Higher proportions of private hospital beds (P_BEDS) to total beds were expected to be positively associated with procedure rates, but the results reveal an ambiguous effect. The lack of a direct control of funding for investments (INV) is significant and has the expected positive association to utilisation rates with one exception. Thus, the level of utilisation of these procedures seems higher in countries in which the funding of investments is included in the general remuneration scheme for hospitals (INV=1) compared to countries where the funding is controlled directly and separately from the general remuneration. This association also appears to diminish over time. Health care systems allowing patients to make a choice of hospital (CHOICE) were expected to be positively associated with procedure rates, but again the impact is ambiguous. The same was true of the variables relating to the presence of co-payment (COPAY) and supplementary insurance (SUPPL) which were generally of ambiguous sign. The impact of the remuneration of hospitals (H_FFS & H_CASE) and the remuneration of physicians by fee-for-service (PRS) were expected to be positive. Again, the results are ambiguous and there appears to be no consistent change over time.
Turning to the interdependent relationship between CATH, CABG and PTCA (Table 8), the results seem consistent with expectations. There is a positive association between CATH on the one hand and CABG/PTCA on the other (column with headline CATH), and overall CABG and PTCA are substitutes for each other (cf. columns with headlines CABG and PTCA, respectively). This means that the utilisation of CATH is, as expected,
complementary to the utilisation of CABG and PTCA. This positive relationship between CATH and the other procedures is confirmed in the regressions with CABG and PTCA as dependent variables. In the regression of the utilisation of CABG (cf. column 2), the utilisation of PTCA seems negatively associated with CABG, implying that these are substitutes. This is confirmed in the regression of the utilisation of PTCA (cf. column 3).
In summary, procedure rates increase over time. General system characteristics, indicating whether there is a public contract system or reimbursement system versus a public integrated system, also behave according to expectations. A number of other regulatory and economic characteristics behave according to expectations with a few exceptions. Moreover, the dynamic associations, i.e. the interactions with the time trend, of income and investment characteristics decrease over time. CATH and CABG or PTCA appear to be complementary while CABG and PTCA appear to be substitutes.
NIH-PA Author Manuscript
NIH-PA Author Manuscript
5. Discussion
Despite the importance of technological change in determining health care expenditure globally, there is strikingly little empirical evidence on the role that economic incentives and regulatory factors embodied in individual health care systems have on the patterns of technological adoption and diffusion. While substantial difficulties exist in quantifying their effect, as seen even in the present analysis, the understanding of the role of economic and regulatory influences on technological change has often been no more than speculative. The present econometric analysis of longitudinal cross-country data, aggregated from patient level data, provides unique insights into the impact of such institutional factors for a range of major technological procedures in a major disease area.
No country has a health care system that can be easily described by few characteristics as most countries are characterised by a mix of features. Consequently, our classification of health care systems by using dichotomized variables entails considerable simplifications. Although this would tend to weaken the significance of our findings, we did find significant results for most of these variables indicating non-rival associations.
The different technologies that were studied have different time-pattern of diffusion as can be inferred from the marginal effects of time, and of the interaction terms with time in the models. Moreover, the three technologies are either substitutes or complementary so that the diffusion of one procedure depends on the diffusion of another. Still, we were able to disentangle some general tendencies across technologies. Obviously, the relationship between the explanatory variables and the utilization rate will vary across technologies.
The number of AMI facilities and physicians would probably have been very good predictors for the utilisation rates. However, these factors are considered to be fully endogenous results of the economic incentives and regulatory factors that define any health care system and are therefore not included in our analysis. Arguably, some of the included variables could also have been considered as endogenous, e.g. choice of hospital
reimbursement system.
One of the major conclusions is that the institutional factors characterising health care systems do have an impact on the uptake and diffusion of new and expensive medical technologies. The countries' economic capability measured by GDP seemed in previous studies to have a positive impact on the adoption of new and expensive technologies and this was confirmed in the present study. However the coefficients on the interaction terms defined across time and GDP (t×ln(GDP)) are negative for all three procedures, implying that the positive impact of GDP on the level of utilisation of these cardiac procedures diminishes over time, implying that the positive impact of GDP on the level of utilization of these cardiac procedures diminishes over time. It is tempting to interpret this levelling-off of the rate of diffusion as an indication that the diffusion is approaching a natural upper ceiling. The diminishing impact of GDP may be caused by decreasing unit costs of the technologies, but it may also be caused by the effect of the other institutional factors mitigating the influence of the GDP as discussed below.
Our findings on the variables used as overall classifications of health care systems into public integrated, public contract and reimbursement system are consistent with earlier analyses which have shown that countries with different types of health care system do indeed have different rates of utilisation of new technologies, e.g. (Rublee 1989; Rublee 1994). The results from this study indicate that countries classified as public integrated are the most restrictive, followed by public contract and reimbursement health care systems. The public contract and reimbursement systems each have a higher level of utilisation of CATH and PTCA compared to public integrated systems but again the impact diminishes
NIH-PA Author Manuscript
NIH-PA Author Manuscript
over time, as indicated by the time interaction terms used with these system dummies. One interpretation of the coefficients on the public contract and reimbursement variables is that new and expensive technologies are adopted and diffused faster in health care systems where there is competition between providers (public contract system and reimbursement system) and competition between third party payers (reimbursement system).
Remuneration of providers has previously been indicated to have an impact on the utilisation rates in the more descriptive analysis in the earlier investigation of these data (McClellan & Kessler 1999; McClellan & Kessler 2002; Tech Research Network 2001) and in other studies (Escarce 1996; Oh, Imanaka, & Evans 2005; Okunade & Miles 1999; Slade & Anderson 2001). These indications are not confirmed here, and at best the results were ambiguous.
Perhaps the most striking result is the positive effect on utilisation rates associated with systems where it is not common for providers to apply directly from purchasers for large investment funding. This is apparently an important and perhaps sometimes overlooked parameter in the discussion of technology diffusion. The effect of having investments funded through general hospital revenue is almost invariably significantly positively related to technology uptake in this study. Furthermore, the size of the effect is comparable to that of having a reimbursement system rather than a publicly integrated system. It should perhaps come as no surprise that regulating the actual physical capacity to perform procedures is a strong determinant of technology use, whereas regulation of financial capacity still leaves considerable leeway for decisions at the micro level, even if these decisions may in the aggregate lead to budget deficits.
Three variables describe conditions concerning patients' demand. All three variables, patients' possibility to choose hospital, the presence of supplementary insurance and the magnitude of co-payment have ambiguous effects. In any case, revealed effects on utilisation are small. Given the severity of AMI as a health problem, it is perhaps not surprising that supply side variables seem to explain procedure rates better (more in accordance with theoretical expectations) than demand side variables, and hence that variables such as patients' choice and co-payment levels show very mixed results. Indeed, they may unintentionally capture other aspects of the health care system. For example, in a public health care system, the purchase of supplementary insurance would probably become more prevalent the more difficult it is to get access to new technologies from public
providers. Otherwise, one would intuitively, expect the presence of supplementary insurance to be the largest demand side influence since the decision to purchase supplementary insurance is taken beforehand and by healthy persons and not when someone has already experienced a heart attack. However, the specific coverage provided by the supplementary insurance would matter and this information is not available for analysis. Despite the ambiguity, four out of the five times when supplementary insurance is significant, it has the expected sign.
One of the important findings in this study is that the inclusion of interactions between time and the explanatory variables provide important insights into the diffusion of medical technologies. Almost consistently, the time interactions of income, system characteristics and direct funding of investments reveal that the main effect of these explanatory variables seems to diminish over time or reverse the main effect. This finding is consistent with the general diffusion dynamics of technology where the spread of knowledge of use, experience and updates to health care practice guidelines play a significant role on adoption,
particularly as the technology matures.
NIH-PA Author Manuscript
NIH-PA Author Manuscript
This analysis provides insights also for policy makers wishing to influence the adoption of new technologies. However, it does not answer the normative question whether adoption tends to be too slow or too quick in a particular country. The adoption process is
conceptually linked to but different from the appropriate level of use in a steady-state setting. The latter is the domain of economic evaluation in health care, which has provided evidence on the incremental cost-effectiveness of some but not nearly all medical
procedures. In the present context, it is worth emphasizing that the appropriate level of use is likely to vary across countries, as it depends on patient characteristics, income, within-country relative prices, the opportunity cost of people being on sick-leave etc. The adoption process determines the rate at which we approach this desired level of use, but the speed of adoption also involves a system's attitude towards the inevitable uncertainty regarding the effects of a new technology.
While the introduction of new pharmaceuticals is extensively regulated, this is much less true for the introduction of non-pharmaceutical technology. For example, some operating equipment may be subject to safety standards, but the use of a new surgical procedure is often only implicitly regulated (it should, e.g., represent “best practice” or be based on “well-founded experience”).
When there is no explicit regulation of technologies, and no time consuming regulatory procedure, the regulatory trade-off that has been extensively debated with respect to pharmaceuticals has not come to the fore; this is the trade-off between, on the one hand, allowing early/quick adoption of a welfare-enhancing technology (the opportunity cost of delaying use) and, on the other hand, the risk associated with introducing a procedure that might ex post turn out to be detrimental to the health and welfare of patients (Scherer 2000). The issues arising from this dilemma is equally relevant for the case of non-pharmaceutical technology; a quick process of diffusion in not unproblematic, as the experience with carotid endarterectomy demonstrates (Nystedt & Lyttkens; 2003), and a slower process arguably increases the probability that any disadvantages are detected before a technology becomes widely used.
One of the main limitations of this study is that although the data are longitudinal cross-sectional observations of the utilisation rates, the panel structure cannot be fully exploited because it is an unbalanced panel data set and because most of the explanatory variables are time invariant. The loss in the number of degrees of freedom by the use of a fixed effects regression model would have been too extensive due to the limited data (even though more data were assembled than has usually been available for such analyses). The main reason for not applying a fixed effects regression is, however, due to insufficient ‘within’ variation across time and due to the potentially high correlation between the country-specific fixed effects and the explanatory variables. Due to time invariance of most of the explanatory variables, many of the explanatory variables would have dropped out of the regressions and the country-specific fixed effects would have picked up most of the variation in the data set providing no insights to the impact of economic incentives and regulatory factors.
The study suffers from a number of other limitations which should be briefly mentioned; 1) some countries provided data for more than ten years whereas others provided data for three years only, 2) the data are on an aggregate level disabling inclusion of patient characteristics beyond age and gender in the regression models, and 3) the categorisation of countries entails simplifications with the risk of misclassifications.
NIH-PA Author Manuscript
NIH-PA Author Manuscript
6. Conclusion
Technological change is regarded as a major explanatory factor in driving health care expenditure growth. While technology does have certain public good characteristics different countries do appear to experience different up-take and diffusion rates. This study has not considered the relationship between technology diffusion and health outcome, which is the ultimate judge of how technology impacts on welfare. Although no optimal rate of diffusion is discussed the paper does have implications for the efficiency of various regulatory structures. Using rigorous econometric analyses of longitudinal cross-country data, this study shows that differences in the utilisation rates of three technologies for managing AMI can be explained by country income and a number of institutional factors. Health care systems being characterised as public contract or reimbursement systems have generally higher utilisation compared to public integrated systems. Funding of investments through a general remuneration scheme rather than through investment funds granted by third party payers is associated with higher utilisation rates. The main effects of these variables seem, however, almost consistently to diminish through time. Thus, a positive main effect will typically have a negative interaction with the time trend which means that income and institutional variables explain less and less of the variation as technologies mature. These empirical findings suggest that while different regulatory structures can impact on technology diffusion their influence is weakened over time. One implication is that technology diffusion adapts to the regulatory structure and that, if control of technology diffusion is used as an indirect control of expenditure level, optimal regulation ought to encompass some dynamic element, as is occurring with the various “risk-sharing”
agreements being used to regulate drug prices in a number of countries, where price setting is examined at different points in time. Such regulatory lag would enhance the incentive to reduce costs through innovation, although this may be offset by delaying benefits to consumers of course. Moreover the results also suggest that the impact of system regulation is different for different technologies. The adaptive nature of optimal regulation of health technology is further emphasised by this finding. Even though the data for the present project are unique, there are still important limitations. Future work may involve collecting longer time series for each country enabling application of more advanced econometric methods.
Supplementary Material
Refer to Web version on PubMed Central for supplementary material.
References
Australian Productivity Commission. Impacts of Advances in Medical Technology in Australia. Melbourne: APC; 2005.
Barros. The black box of health care expenditure growth determinants. Health Economics. 1998; 7(6): 165–181.
Bech, M.; Christiansen, T.; Dunham, K.; Lauridsen, J.; Lyttkens, CH.; McDonald, K.; McGuire, A. How do economic incentives and regulatory factors influence adoption of cardiac technologies? Result from the TECH project. Working Papers, Department of Economics, Lund University; 2006:15
Congressional Budget Office. Technological Change and the Growth of Health Care Spending. Washington DC: CBO, Congress of the USA; 2008.
Cutler DM, Huckman RS. Technological development and medical productivity: the diffusion of angioplasty in New York state. Journal of Health Economics. 2003; 22(2):187–217. [PubMed: 12606143]
NIH-PA Author Manuscript
NIH-PA Author Manuscript
Cutler, DM.; McClellan, M. What is Technological Change?. In: Wise, DA., editor. Inquires in the Economics of Aging. University of Chicago Press; Chicago: 1998. p. 51-81.
Cutler DM, McClellan M, Newhouse JP. What Has Increased Medical-Care Spending Bought? American Economic Review. 1998; 88(2):132–136.
Cutler DM, McClellan MB. The Determinants of Technological Change in Heart Attack Treatment. NBER Working Paper No w5751. 1996
Cutler DM, McClellan MB, Newhouse JP, Remler D. Are Medical Prices Declining? Evidence for Heart Attack Treatment. Quarterly Journal of Economics. 1998; 113(4):991–1024.
Dickson, M.; Jacobzone, S. Health Working Papers. OECD; 2003. Pharmaceutical Use and Expenditure for Cardiovascular Disease and Stroke: A Study of 12 OECD Countries. Escarce J. Externalities in hospitals and physician adoption of a new surgical technology: An
exploratory analysis. Journal of Health Economics. 1996; 15(6):715–734. [PubMed: 10165265] Gerdtham, UG.; Jönsson, B. International comparison of health expenditure: theory, data and
econometric analysis. In: Culyer, AJ.; Newhouse, JP., editors. Handbook of Health Economics. Elsevier; Amsterdam: 2000. p. 11-53.
Greenberg D, Peiser JG, Peterburg Y, Pliskin JS. Reimbursement policies, incentives and disincentives to perform Iaparoscopic surgery in Israel. Health Policy. 2001; 56(1):49–63. [PubMed: 11230908] Hall RE, Tu JV. Hospitalization rates and length of stay for cardiovascular conditions in Canada, 1994
to 1999. Canadian Journal of Cardiology. 2003; 19(10):1123–1131. [PubMed: 14532937] Hoffman SN, TenBrook JA, Wolf MP, Pauker SG, Salem DN, Wong JB. A meta-analysis of
randomized controlled trials comparing coronary artery bypass graft with percutaneous
transluminal coronary angioplasty: One- to eight-year outcomes. Journal of the American College of Cardiology. 2003; 41(8):1293–1304. [PubMed: 12706924]
Hurst JW. Reforming health care in seven European nations. Health Affairs. 1991; 10(3):7–21. [PubMed: 1748392]
Lazaro P, Fitch K. The Distribution of Big Ticket Medical Technologies in Oecd Countries.
International Journal of Technology Assessment in Health Care. 1995; 11(3):552–570. [PubMed: 7591552]
McClellan M, Kessler DP. A Global Analysis of Technological Change in Health Care: The Case of Heart Attacks. Health Affairs. 1999; 18(3):250–255.
McClellan, MB.; Kessler, DP. Technological Change in Health Care - A Global Analysis of Heart Attack. The University of Michigan Press; Ann Arbor: 2002.
Mcpherson K, Wennberg JE, Hovind OB, Clifford P. Small-Area Variations in the Use of Common Surgical-Procedures - An International Comparison of New-England, England, and Norway. New England Journal of Medicine. 1982; 307(21):1310–1314. [PubMed: 7133068]
Moïse, P. A Disease-based Comparison of Health Systems: What is Best and at What Cost?. OECD; Paris: 2003a. The Heart of the Health Care System: Summary of the Ischaemic Heart Disease Part of the OECD Ageing-Related Diseases Study; p. 27-52.
Moïse, P. A Disease-based Comparison of Health Systems: What is Best and at What Cost?. OECD; Paris: 2003b. The Technology-Health Expenditure Link: A Perspective from the Ageing-Related Diseases Study; p. 195-218.
Newhouse JP. Medical Care Costs: How Much Welfare Loss? Journal of Economic Perspectives. 1992; 6(3):3–21. [PubMed: 10128078]
Nystedt P, Lyttkens CH. Age diffusion never stops? Carotid endarterectomy among the elderly. Applied Health Economics and Health Policy. 2003; 2(1):3–7. [PubMed: 14619268]
OECD. Health Policy Studies. 5. OECD; Paris: 1994. The Reform of Health Care Systems - A Review of Seventeen OECD Countries.
Oh EH, Imanaka Y, Evans E. Determinants of the diffusion of computed tomography and magnetic resonance imaging. International Journal of Technology Assessment in Health Care. 2005; 21(1): 73–80. [PubMed: 15736517]
Okunade AA, Murthy VNR. Technology as a ‘major driver’ of health care costs: a cointegration analysis of the Newhouse conjecture. Journal of Health Economics. 2002; 21(1):147–159. [PubMed: 11852912]
NIH-PA Author Manuscript
NIH-PA Author Manuscript
Okunade AA, Miles AP. Medicare Physician Payment Reform and the Utilization of Cardiovascular Procedures. Journal of Health and Social Policy. 1999; 11(1):37–52. [PubMed: 10538429] Pestieau, P. The Welfare State in the European Union: Economic and Social Perspectives. Oxford
University Press; Oxford: 2006.
Rublee DA. Medical Technology in Canada, Germany, and the United-States. Health Affairs. 1989; 8(3):178–181. [PubMed: 2793043]
Rublee DA. Medical Technology in Canada, Germany, and the United-States - An Update. Health Affairs. 1994; 13(4):113–117. [PubMed: 7988987]
Scherer, FM. The pharmaceutical industry. In: Culyer; Newhouse, editors. Handbook of Health Economics. Vol. 1b. Elsevier Science, North-Holland; Amsterdam: 2000. p. 1197-1236. Slade EP, Anderson GF. The relationship between per capita income and diffusion of medical
technologies. Health Policy. 2001; 58(1):1–14. [PubMed: 11518598]
Tech Research Network. Technological Change Around The World: Evidence From Heart Attack Care. Health Affairs. 2001; 20(3):25–42. [PubMed: 11585174]
Van Den Brand, The European Angioplasty Survey Group. Utilization of Coronary Angioplasty and Cost of Angioplasty Disposables in 14 Western-European Countries. European Heart Journal. 1993; 14(3):391–397. [PubMed: 8458360]
Weisbrod BA. The Health Care Quadrilemma: An Essay on Technological Change, Insurance, Quality of Care, and Cost Containment. Journal of Economic Literature. 1991; 29(2):523–552.
NIH-PA Author Manuscript
NIH-PA Author Manuscript
NIH-PA Author Manuscript
NIH-PA Author Manuscript
NIH-PA Author Manuscript
Table 1 Data sources of the procedure rates
Country (region) Years Data source and content
Australia (Perth) 1988-1996 WHO MONICA; and linked hospital death records. Treatment during AMI is only in the MONICAdata set, which is for persons under 65 years, from 1991-1993.
Australia (Victoria) 1987-1996
The Victorian Inpatient Minimum Dataset (The Victorian State Government acute hospital summary dataset); The Victoria dataset includes all acute public hospitals from 1987/88, and all private hospitals from 1993/4 with some private hospitals from 1991/92.
Belgium 1993-1998 Ministry of Public Health (includes all Belgian hospitals); National Hospital Admissions; HealthInsurance Data Base.
Canada (Alberta) 1989-1998 Hospital Discharge Data.
Canada (Ontario) 1985-1999 Hospital Discharge Data. Ontario did not exclude patients coded as 410.×2, or most other patientsspecified for exclusion in the protocol because of coding inconsistencies in the data.
Canada (Quebec) 1988-1999 Hospital Admission Files and Physicians Claims.
Denmark 1989-1999 Public administrative registration including all AMI patients.
England 1989-1998 Oxford Record Linkage Study; Hospital Episode Statistics; and Heart Attack Register.
Finland 1989-1997 Finnish National Hospital Discharge Register linked with National Death Register; Finnish HeartAssociation; WHO MONICA. Finland changed from ICD-9 to ICD-10 coding in 1996.
France 1995-1997 Nationwide database containing all the information for the AMI admissions. Germany 1985-1999 MONICA data (only if surviving at least 24h within the hospital admission)
Israel 1993-1997
National Hospital Discharge Register, which covers approximately 80% of all acute care hospital admissions in the country; National Death Register; MONICA/AMI registry; Biennial 2-month survey of CCU admissions.
Italy 1985-1993 MONICA data; patients under 65 years
Japan 1996-1999 MED (Medical Economics division of the Ministry of Health and Welfare; IPSS (National Instituteof Population and Social Security Research; SMTS (Social Medical Treatment Survey).
Norway 1992-1999 Norwegian Patient Registry - the entire population and all admissions for AMI. Norway does nothave data for 1993 and 1995
Scotland 1985-1999 Information Service Division, National Health Service.
Sweden 1987-1997 Swedish National Hospital Discharge Register, linked with PTCA register. Sweden excludes AMIpatients with a hospital length of stay greater than 100 days.
Switzerland 1986, 1990, 1993 WHO MONICA data; patients under 65 years Taiwan 1995-1998 Hospital Claim File.
USA (California) 1991-1996 California discharge database (Office of Statewide Health Planning and Development) for theunder-65 population only.
NIH-PA Author Manuscript
NIH-PA Author Manuscript
NIH-PA Author Manuscript
Table 2 Explanatory variables
Variables Descriptions Coding Hypothesised influence
GDP Gross domestic product per capita, US$ PPP - +
PEH Public expenditure on health as % total expenditure onhealth 0.00 – 1.00 ÷
CONTR Health care systems classified as public contract system 0=‘Public integrated system’ + 1=‘Public contract system’
REIMB Health care systems classified as reimbursement system 0=‘Public integrated system’ + 1=‘Reimbursement system’
P_BEDS Percentage of total number of hospital beds owned bythe private sector 0.00 – 1.00 +
INV Does the third party grant larger capital investmentsseparately?
0=‘Larger investments are granted and controlled by the third party(ies)’
+ 1=‘Investments are funded through the
general remuneration scheme to the hospitals’
COPAY Patients' co-payment as percentage of the total cost ofthe procedure 0.00 – 1.00 ÷
SUPPL Do patients purchase supplementary insuranceproviding access to one of the procedures? 0=No + 1=Yes
CHOICE
Do patients have choice of provider and do patients actually use their opportunity to choose among hospitals?
0=‘No choice or very limited extent of patients choosing among hospitals’
+ 1=‘Yes can and do choose among
hospitals’
H_FFS Hospital remuneration scheme
0=‘Fixed remuneration schemes (global
budgets/capped budgets)’ + 1=‘Fee-for-service or per-diem payment’
H_CASE Hospital remuneration scheme
0=‘Fixed remuneration schemes (global
budgets/capped budgets)’ + 1=‘Payment per admission (DRG)’
NIH-PA Author Manuscript
NIH-PA Author Manuscript
NIH-PA Author Manuscript
Table 3
Categorisation of the countries by dichotomous variables
Variables Categorisation
Health care system
CONTR=0, REIMB=0: Alberta, Denmark, England, Finland, Norway, Ontario, Quebec, Scotland,Sweden
CONTR=1, REIMB=0: France, Italy, Perth, Taiwan, US (Medicare), Victoria CONTR=0, REIMB=1: Belgium, Germany, Israel, Japan, Switzerland, US (California)
INV
=0: Denmark, England, Finland (1988-1992), Germany, Italy, Norway, Scotland,Sweden, Switzerland
=1: Alberta, Belgium, Finland (1993-1997), France, Israel, Japan, Ontario, Perth,Quebec, Taiwan, US (California), US (Medicare), Victoria
SUPPL
0=No:
Alberta, Belgium, Denmark, England, Finland, France Germany, Israel (1993-1994), Italy, Japan, Norway, Ontario, Quebec, Scotland, Sweden, Switzerland, Taiwan, US (California), US (Medicare)
1=Yes: Israel (1995-1998), Perth, Victoria
CHOICE
0=‘No choice or very limited choice’:
Alberta, Denmark, England, Finland, France, Israel, Italy, Norway, Ontario, Perth, Quebec, Scotland, Sweden, Switzerland, Victoria
1=‘Yes’: Belgium, Germany, Japan, Taiwan, US (California), US (Medicare)
Hospital remun. scheme
H_FFS=0, H_CASE=0: Alberta, Denmark, England, Finland (1988-1992), France, Italy, Norway(1992-1996), Ontario, Quebec, Scotland, Sweden
H_FFS=1, H_CASE=0¥: Belgium, Germany, Japan, Switzerland, Taiwan
H_FFS=0, H_CASE=1: Finland (1993-1997), Israel, Norway (1997-1999), Perth, US(California), US(Medicare), Victoria
PRS
0=‘Salaried physicians’: Denmark, England, Finland, France, Germany, Israel, Italy, Japan, Norway,Scotland, Sweden, Taiwan
1=‘FFS physicians’: Alberta, Belgium, Ontario, Perth, Quebec, Switzerland, US(California), US(Medicare), Victoria
Notes:
¥
NIH-PA Author Manuscript
NIH-PA Author Manuscript
NIH-PA Author Manuscript
Table 4
Simple descriptive statistics of the dependent variables – mean (standard deviation)
Country CATH CABG PTCA
Alberta 0.2354 (0.0357) 0.0181 (0.0056) 0.0763 (0.0313) Belgium 0.2186 (0.0498) 0.0119 (0.0026) 0.0633 (0.0298) Denmark - - 0.0025 (0.0019) 0.0348 (0.0251)
England 0.0253 (0.0135) 0.0022 (0.0009) 0.0127 (0.0124) Finland 0.0122 (0.0152) 0.0023 (0.0014) 0.0106 (0.0051) France 0.3201 (0.0294) 0.0285 (0.0096) 0.1223 (0.0376)
Germany 0.4149 (0.1567) 0.0624 (0.0393) 0.1444 (0.0959) Israel 0.3587 (0.0567) 0.0098 (0.0055) 0.3556 (0.0562) Italy 0.1779 (0.0795) 0.0200 (0.0147) 0.0188 (0.0222)
Japan 0.7682 (0.0576) 0.0637 (0.0127) 0.5257 (0.0540) Norway 0.0177 (0.0196) 0.0008 (0.0004) 0.0124 (0.0109) Ontario 0.0387 (0.0142) 0.0040 (0.0019) 0.0121 (0.0065)
Perth 0.1412 (0.0649) 0.0110 (0.0086) 0.0430 (0.0302) Quebec 0.2206 (0.0637) 0.0088 (0.0039) 0.0772 (0.0499) Scotland 0.0459 (0.0394) 0.0044 (0.0029) 0.0127 (0.0124)
Sweden - - 0.0049 (0.0032) 0.0265 (0.0282) Switzerland 0.3542 (0.1236) 0.0488 (0.0028) 0.1239 (0.0431) Taiwan 0.2175 (0.0389) 0.0297 (0.0070) 0.1498 (0.0397)
US – California 0.5232 (0.0333) 0.1179 (0.0194) 0.2498 (0.0329) Victoria 0.1162 (0..0618) 0.0146 (0.0082) 0.0212 (0.0218) US - Medicare 0.2535 (0.1113) 0.0569 (0.0270) 0.0855 (0.0518)
Overall 0.1988 (0.1807) 0.0219 (0.0309) 0.0842 (0.1108)
et al.
Page 19
Table 5
Marginal effects (mi) of the determinants for the utilisation of CATH
Model 1 Model 2 Model 3
mi s.e. mi s.e. mi s.e.
Average rate 0.1988 0.1988 0.1988
t 0.0239*** 0.0001 0.0076*** 0.0002 0.1760*** 0.0018
ln(GDP) - - 0.0731*** 0.0041 0.01464*** 0.0057
PEH - - -0.2220*** 0.0036 -0.1742*** 0.0200
CONTR - - 0.1567*** 0.0025 0.5518*** 0.0076
REIM - - 0.2349*** 0.0028 0.6508*** 0.0078
P_BEDS - - 0.0145** 0.0061 -0.6765*** 0.0178
INV - - 0.0239*** 0.0018 0.0192*** 0.0070
H_FFS - - -0.0775*** 0.0034 -0.4420*** 0.0134
H_CASE - - -0.0472*** 0.0017 -0.1734*** 0.0099
PRS - - 0.0385*** 0.0018 0.2640*** 0.0072
SUPPL - - 0.0087*** 0.0015 0.0753*** 0.0137
COPAY - - -0.0398*** 0.0074 0.0704** 0.0308
CHOICE - - -0.0906*** 0.0052 0.2371*** 0.0175
t×ln(GDP) - - - - -0.0160*** 0.0002
t×PEH - - - - 0.0129*** 0.0019
t×CONTR - - - - -0.0356*** 0.0008
t×REIM - - - - -0.0396*** 0.0008
t×P_BEDS - - - - 0.0537*** 0.0018
t×INV - - - - 0.0021*** 0.0007
t×H_FFS - - - - 0.0207*** 0.0011
t×H_CASE - - - - 0.0076*** 0.0009
t×PRS - - - - -0.0219*** 0.0007
Health Econ
et al.
Page 20
Model 1 Model 2 Model 3
mi s.e. mi s.e. mi s.e.
t×SUPPL - - - - -0.0042*** 0.0013
t×COPAY - - - - 0.0141*** 0.0031
t×CHOICE - - - - -0.0099*** 0.0016
Constant -0.4070*** 0.0005 -0.8759*** 0.0375 -1.8430*** 0.0612
Nit 163 163 163
LRI -0.0397 0.9938 1.0468
LogL/Log0 76,724,416 / 73,811,753 455,100 / 73,811,753 -3,565,355 / 73,811,753
Notes:
*
denotes significance at the 10% level.
**
denotes significance at the 5% level.
***
denotes significance at the 1% level.
Health Econ
et al.
Page 21
Table 6
Marginal effects (mi) of the determinants for the utilisation of CABG
Model 1 Model 2 Model3
mi s.e. mi s.e. mi s.e.
Average rate 0.0219 0.0219 0.0219
t 0.0029*** 0.0000 0.0003*** 0.0000 0.0083*** 0.0003
ln(GDP) - - 0.0039*** 0.0005 -0.0002 0.0007
PEH - - 0.0007*** 0.0005 -0.0042* 0.0025
CONTR - - -0.0111 0.0004 -0.0006 0.0012
REIM - - -0.0083*** 0.0004 0.0043*** 0.0012
P_BEDS - - 0.0332*** 0.0008 0.0998*** 0.0031
INV - - 0.0089*** 0.0004 0.0039*** 0.0013
H_FFS - - -0.0107*** 0.0008 0.0057** 0.0029
H_CASE - - -0.0100*** 0.0005 -0.0105*** 0.0021
PRS - - -0.0060*** 0.0003 0.0032** 0.0013
SUPPL - - 0.0145*** 0.0005 0.0031 0.0031
COPAY - - 0.0031** 0.0015 -0.0579*** 0.0057
CHOICE - - 0.0007 0.0011 -0.0695*** 0.0038
t×ln(GDP) - - - - -0.0008*** 0.0000
t×PEH - - - - 0.0004* 0.0002
t×CONTR - - - - 0.0003** 0.0001
t×REIM - - - - 0.0000 0.0001
t×P_BEDS - - - - -0.0084*** 0.0003
t×INV - - - - -0.0001 0.0001
t×H_FFS - - - - -0.0022*** 0.0002
t×H_CASE - - - - 0.0003 0.0002
t×PRS - - - - -0.0003** 0.0001
t×SUPPL - - - - -0.0001 0.0003
Health Econ
et al.
Page 22
Model 1 Model 2 Model3
mi s.e. mi s.e. mi s.e.
t×COPAY - - - - 0.0076*** 0.0006
t×CHOICE - - - - 0.0073*** 0.0003
Constant -0.1232*** 0.0003 -0.0657*** 0.0049 -0.0299*** 0.0077
Nit 185 185 185
LRI 0.0300 0.1714 0.1729
LogL/Log0 -1,206,570 / -1,243,914 -1,030,690 / -1,243,914 -1,028,802 / -1,243,914
Notes:
*
denotes significance at the 10% level.
**
denotes significance at the 5% level.
***
denotes significance at the 1% level.
Health Econ
et al.
Page 23
Table 7
Marginal effects (mi) of the determinants for the utilisation of PTCA
Model 1 Model 2 Model 3
mi s.e. mi s.e. mi s.e.
Average rate 0.0842 0.0842 0.0842
t 0.0106*** 0.0000 0.0064*** 0.0001 0.0769*** 0.0013
ln(GDP) - - -0.0087*** 0.0024 0.0067** 0.0033
PEH - - -0.1092*** 0.0024 -0.2050*** 0.0119
CONTR - - 0.0845*** 0.0014 0.1373*** 0.0063
REIM - - 0.1258*** 0.0016 0.1819*** 0.0066
P_BEDS - - -0.1058*** 0.0038 -0.3122*** 0.0124
INV - - 0.0105*** 0.0012 0.0377*** 0.0056
CHOICE - - 0.0588*** 0.0036 0.1559*** 0.0124
H_FFS - - -0.0949*** 0.0025 -0.1793*** 0.0091
H_CASE - - -0.0263*** 0.0010 -0.0319*** 0.0056
PRS - - -0.0050*** 0.0012 0.0294*** 0.0053
SUPPL - - 0.0011 0.0008 -0.0251*** 0.0067
COPAY - - 0.0582*** 0.0052 0.1889*** 0.0218
t×ln(GDP) - - - - -0.0076*** 0.0002
t×PEH - - - - 0.0158*** 0.0011
t×CONTR - - - - -0.0052*** 0.0006
t×REIM - - - - -0.0068*** 0.0006
t×P_BEDS - - - - 0.0189*** 0.0011
t×INV - - - - -0.0034*** 0.0005
t×CHOICE - - - - -0.0046*** 0.0011
t×H_FFS - - - - 0.0046*** 0.0007
t×H_CASE - - - - -0.0004 0.0005
Health Econ
et al.
Page 24
Model 1 Model 2 Model 3
mi s.e. mi s.e. mi s.e.
t×PRS - - - - -0.0018*** 0.0005
t×SUPPL - - - - 0.0029*** 0.0007
t×COPAY - - - - -0.0043** 0.0020
Constant -0.2620*** 0.0004 0.0028 0.0224 -0.1745*** 0.0331
Nit 162 162 162
LRI 0.0724 0.2979 0.2981
LogL/Log0 -2,348,125 / -2,531,460 -1,777,281 / -2,531,460 -1,776,899 / -2,531,460
Notes:
*
denotes significance at the 10% level.
**
denotes significance at the 5% level.
***
denotes significance at the 1% level.
Health Econ
et al.
Page 25
Table 8
Marginal effects (mi) in the 2 SLS regression models
CATH# CABG¥ PTCA§
mi s.e. mi s.e. mi s.e.
Average rate 0.1988 0.0219 0.0842
CATH - - 0.0404 0.0365 0.0927 0.0576
CABG 1.8951*** 0.5121 - - -1.9036*** 0.2516
PTCA 1.4424*** 0.1526 0.0085 0.0516 -
-t 0.2301*** 0.0025 0.0101*** 0.0004 0.0743*** 0.0013
ln(GDP) 0.3356*** 0.0077 0.0004 0.0011 0.0376*** 0.0037
PEH - - - - -0.1593*** 0.0128
CONTR 0.4666*** 0.0101 -0.0011 0.0014 0.1247*** 0.0064
REIM 0.6068*** 0.0104 0.0038*** 0.0015 0.1669*** 0.0069
P_BEDS -0.5551*** 0.0145 0.1101*** 0.0031 -0.3102*** 0.0111
INV -0.1293*** 0.0076 0.0094*** 0.0009 0.0425*** 0.0056
CHOICE - - -0.0691*** 0.0019 0.1704*** 0.0109
H_FFS -0.3048*** 0.0087 - - -0.1781*** 0.0071
H_CASE 0.0329*** 0.0099 -0.0175*** 0.0013 -
-PRS 0.2827*** 0.0084 - - 0.0304*** 0.0057
SUPPL - - -
-COPAY - - -0.0367*** 0.0031 0.1838*** 0.0205
t×ln(GDP) -0.0204*** 0.0003 -0.0009*** 0.0000 -0.0070*** 0.0002
t×PEH -0.0184*** 0.0008 0.0004** 0.0002 0.0086*** 0.0012
t×CONTR -0.0209*** 0.0010 0.0005*** 0.0001 -0.0031*** 0.0006
t×REIM -0.0256*** 0.0010 0.0003* 0.0002 -0.0044*** 0.0006
t×P_BEDS 0.0367*** 0.0015 -0.0093*** 0.0004 0.0182*** 0.0010
t×INV 0.0137*** 0.0008 -0.0006*** 0.0001 -0.0033*** 0.0005
Health Econ
et al.
Page 26
CATH# CABG¥ PTCA§
mi s.e. mi s.e. mi s.e.
t×CHOICE 0.0038*** 0.0003 0.0074*** 0.0003 -0.0092*** 0.0010
t×H_FFS 0.0066*** 0.0007 -0.0019*** 0.0001 0.0072*** 0.0006
t×H_CASE -0.0124*** 0.0010 0.0008*** 0.0001 -
-t×PRS -0.0253*** 0.0008 - - -0.0017*** 0.0005
t×SUPPL - - -
-t×COPAY - - 0.0062 0.0004 -0.0076*** 0.0019
Constant -5.4609*** 0.1791 -0.0720 0.0171 0.4129*** 0.1241
Nit 149 149 148
LRI 1.0572 0.1307 0.2869
LogL/Log0 -3,656,577 / 63,959,281 -1,017,289 / -1,170,280 -1,745,838 / -2,448,400
Notes:
*
denotes significance at the 10% level.
**
denotes significance at the 5% level.
***
denotes significance at the 1% level.
#
The instrumental variables are PEH, SUPPL, COPAY, t×SUPPL and t×COPAY
¥
The instrumental variables are PEH, H_FFS, PRS, SUPPL, t×PRS and t×SUPPL
§
The instrumental variables are H_CASE, SUPPL, t×H_CASE and t×SUPPL
Health Econ