REM WORKING PAPER SERIES
Efficiency of the European banks in the aftermath of the
financial crisis: A panel stochastic frontier approach
Cândida Ferreira
REM Working Paper 084-2019
May 2019
REM – Research in Economics and Mathematics
Rua Miguel Lúpi 20,
1249-078 Lisboa,
Portugal
ISSN 2184-108X
Any opinions expressed are those of the authors and not those of REM. Short, up to two paragraphs can be cited provided that full credit is given to the authors.
1
Efficiency of the European banks in the aftermath of the financial crisis: A
panel stochastic frontier approach
Cândida Ferreira
ISEG, UL – Lisbon School of Economics and Management of the Universidade de Lisboa
UECE - Research Unit in Complexity and Economics
REM – Research in Economics and Mathematics
R. Miguel Lupi, 20, 1249-078 - LISBOA, PORTUGAL
e-mail: [email protected]
Financial support by FCT (Fundação para a Ciência e a Tecnologia), Portugal is gratefully
acknowledged. This article is part of the Strategic Project (UID/ECO/00436/2019).
Abstract
Using panel estimates and Stochastic Frontier Analysis this paper aims to contribute to
the analysis of bank efficiency of the European banks in the aftermath of the international
financial crisis and the sovereign crisis that seriously affected many EU countries. It also
considers hypothetical scenarios of exit from the EU of some of the particularly relevant
member-states, including the Brexit scenario. The results obtained very clearly
demonstrate the existence of statistically significant technical inefficiencies in all
considered scenarios. Nevertheless, the results reveal that the exclusion of the Italian
banks and of the UK banks from our estimates would be more beneficial to the decrease
of the banks’ cost inefficiencies than the exclusion of the French and the German banks.
Moreover, the worst scenario in terms of the decrease of the EU banks’ cost inefficiencies
would be the exclusion of the banks from the five EU countries that were deeply affected
by the international financial and sovereign crises and were obliged to restructure their
bank systems, that is, Cyprus, Greece, Ireland, Portugal and Spain.
Keywords: Bank efficiency; Stochastic Frontier Analysis; EU banking sector; Brexit.
JEL Classification: C33; D24; F36; G21
2
Efficiency of the European banks in the aftermath of the financial crisis:
A panel stochastic frontier approach
1. Introduction
Banks are in general supposed to manage risks and to help solving potential adverse selection and moral hazard problems caused by imperfect information between borrowers and lenders. However, banks also have incentives to maximize high-valued investment opportunities, and sometimes they don’t prevent risks and contribute to financial distresses and insolvencies that can lead to financial crisis.
During the last decades the banking institutions have been exposed to new challenges, such as increased liberalisation, deregulation, technological changes and internationalisation. The challenges were particularly evident in the European Union (EU) after the implementation of the Single Market Programme and the introduction of the single currency that were supposed to remove barriers, increasing competition and contributing to bank efficiency.
In recent years the EU banking institutions have been experiencing the phenomena related to the European integration as well as the consequences of the strong turbulences caused by the international financial crisis that started in the United States. Some EU countries had to face not only financial imbalances but also imbalances in their public budgets and were obliged to request international financial assistance to overcome the financial and sovereign crises.
Nowadays, the EU is overcoming these crises but, at the same time, it is experiencing new challenges, namely those related to the possibility of the exit of one member-state, the UK, which is particularly relevant in terms of the EU financial and banking systems.
In this context, two main questions are addressed in this study:
1) How efficient revealed to be the EU banks in the aftermath of the international financial crisis? Aiming to answer to this question we apply Stochastic Frontier Analysis to a panel
3 including a relatively high sample of banks from all EU countries for the period 2011-2017.
2) How would the EU banks perform in the hypothesis of exit from the EU of some particularly relevant member-states, including the scenario of the Brexit? To answer to this question, we consider some hypothetical scenarios, represented by six specific panels: besides the panel including the banks from all current EU countries, four panels considering the exclusion of the banks from some financially relevant countries: France, Germany, Italy and the UK. The sixth panel excludes the banks from 5 EU countries that were mostly affected by the financial and sovereign crises and were obliged to request international financial assistance (Cyprus, Greece, Ireland, Portugal and Spain).
The results obtained reveal the existence of statistically significant technical inefficiencies in all panels. Moreover, in our sample of EU banks, there is no clear correspondence between the relevance of each of the considered sub-samples in terms of the number of included banks and the provided loans in 2017 and the results regarding bank cost inefficiency. The results also reveal that, in general, the exclusion of the Italian banks or of the UK banks would be more beneficial to the variation of the banks’ cost inefficiencies than the exclusion of the French or German banks. The worst scenario would be the exclusion of the 5 EU countries that were deeply affected by the international financial and the sovereign crises and were obliged to restructure their bank systems (Cyprus, Greece, Ireland, Portugal and Spain).
The paper is organized as follows: Section 2 presents a brief literature review; the methodology and the data are presented in Section 3; Section 4 reports the results obtained; Section 5 concludes.
4
2. Brief literature review
The concept of efficiency, including bank efficiency, have been widely studied mostly since the pioneer contribution of Farrell (1957). In general, these studies consider the possibility to use the available data of the firms’ inputs and outputs to define the efficiency frontier as the best combination of these inputs and outputs, and then measuring the firms’ efficiency with the deviations from the efficiency frontier.
Bank efficiency has been analysed with non-parametric approaches, namely with the Data Envelopment Analysis (DEA) that was first developed by Charnes et al. (1978) and since then has been extensively used.
Recent examples of the use of DEA techniques to analyse the efficiency of the European banks are to be found, for example, in Tuskan and Stojanovic (2016) and in Kocisova (2017). Tuskan and Stojanovic (2016) study the efficiency of the banking industry, for the period 2008–2012 on a sample of 28 European banking systems, suggesting that, in general, banking systems in post-transition countries have a higher cost efficiency. Kocisova (2017) analyses revenue efficiency of the banking sectors in the European Union countries in 2015 and mostly concluded that the large banking sectors appear to be most efficient.
Bank efficiency has also been extensively analysed with parametric methods, namely with the Stochastic Frontier Analysis (SFA), that was first proposed by Aigner et al (1977) and later developed by Battese and Coelli (1988, 1995).
Several studies have used SFA to analyse the efficiency of the European banks. For example, Resti, A. (1997) use both SFA and non-parametric techniques to test the efficiency of a panel of 270 Italian banks concluding that the efficiency of these banks did not increase over the period 1988–1992.
Altunbas et al (2001) using a large sample of European banks between 1989 and 1997 show that banks of all sizes can obtain greater cost savings if they are able to reduce managerial and other kind of inefficiencies.
Bikker (2003) empirically analyses the evolution of the efficiency of the different categories of banks of 16 European countries during the period 1990-1997, revealing that inefficiencies in 1997
5 were nearly 45% lower than in 1990 and explaining it with the financial and monetary integration in the EU that increased competitive pressures and enforced European banks to operate more economically.
Casu et al (2004) compare parametric and non-parametric estimates of productivity change in European banking between 1994 and 2000 suggesting that (where found) productivity growth has mainly been brought about by improvements in the performance of best practice banks.
Bos and Schmiedel (2007) using a data set of more than 5000 large commercial banks from all major European banking markets over the period 1993-2004 find evidence in favour of a single European banking market characterized by cost and profit meta-frontiers.
Yildirim and Philippatos (2007) using the stochastic frontier approach and the distribution-free approach examine the cost and profit efficiency of banking sectors in twelve transition economies of Central and Eastern Europe over the period 1993–2000 and found evidence of significant managerial inefficiencies.
Delis et al (2009) estimate cost and profit stochastic frontiers based on a panel dataset of Greek commercial banks over the period 1993 to 2005 and found lower levels of cost efficiency than profit efficiency, although both measures reveal an improving trend over the sample period. Weill (2009) use a stochastic frontier approach to analyse the cross-country differences of bank cost efficiency in all EU countries between 1994 and 2005, concluding that there is an improvement in cost efficiency for all EU countries as well as a process of convergence in cost efficiency between EU countries,
Lozano-Vivas et al (2011) use SFA and reveal the cost efficiency improvement and the effectiveness of merger processes and consolidations in Europe from 1998 to 2004.
Aiello and Bonanno (2013) evaluate the cost and the profit efficiency of the Italian banking sector over the period 2006-2011 concluding that, in general, Italian banks perform well but there is high heterogeneity in the results.
Vozková and Kuc (2017) analyse the recent trends in bank cost efficiency with SFA using data between 2006 and 2015 and a sample of 649 European cooperative banks, mostly showing that average inefficiency of European cooperative banks is increasing since 2008 and that smaller
6 cooperative banks are significantly more efficient than the bigger ones over the whole considered time period.
Kuc (2018) also employs the SFA on the set of 183 cooperative banks from 12 European countries to investigate the size–efficiency relation of European cooperative banks during the 2006-2015 period, showing that smaller European cooperative banks are significantly more cost efficient than their bigger peers.
Oliveira (2017) analyses the efficiency of the European banks with SFA and a set of 122 institutions representing the largest banks from a group of 15 EU member-states for the 2000−2013 period and find that in 2013 the median European bank operated with costs 25 to 100% above the efficient level; moreover, the paper concludes that there is ambiguous evidence on productivity growth, although the inefficiency of financial intermediation has been increasing over time, possibly driven by the least efficient banks.
Despite the validity of all these results, it also worthwhile mentioning that authors such as Aiello and Bonanno (2015) documented the heterogeneity in results of banking efficiency literature. More precisely, they perform a meta-regression analysis examining 1661 efficiency scores retrieved from 120 papers published over the period 2000–2014 and conclude not only that parametric methods yield lower levels of banking efficiency than non-parametric studies but also that efficiency scores are determined by the quality of the studies, as well as the number of observations and the variables used in the efficiency estimates.
3. Methodology and data
The analysis of bank efficiency is usually based on the assumption that the performance of the banks can be described by a production function linking the provided banking outputs to the necessary banking inputs. However, there is no clear consensus regarding the definition of the banking outputs and inputs.
7 The literature has identified two main approaches to analyse bank efficiency: the intermediation approach and the production approach. The intermediation approach considers that banks are mostly financial intermediaries using deposits and other borrowed funds as well as the traditional factors of production to provide loans and other earning assets. The production approach considers that banks are mostly producers of a number of financial services, including deposits, loans and different kinds of financial transactions, using the traditional factors of production, labour and capital. However, empirically, the concrete definition of the banks’ outputs and inputs is often restricted by the availability of the required data.
In general, the research into efficiency, including into bank efficiency, in based on the estimation of an efficiency frontier with the best combinations of the different inputs and outputs of the production process. The deviations of the individual bank performances from the “optimal” frontier provide the measure of the losses of bank efficiency.
One of the tested methods to estimate empirically the potential inefficiencies of the banks is the Stochastic Frontier Analysis (SFA), a parametric method developed among others by Aigner et
al (1977), Battese and Coelli (1988, 1995) and Altunbas et al (2001).
The SFA is based on a problem of economic optimisation, more precisely, the maximisation of profits or the minimisation of costs, given the assumption of a stochastic optimal frontier. Following Altunbas et al (2001) we can consider that the stochastic cost function is represented with the expression TC = TC (Qi, Pj)+ε, where TC is the total cost, Q is the vector of the i outputs, P is the vector of the prices of the j inputs and ε is the error term.
This error term of the cost function can be decomposed into ε = u + v; where u and v are
independently distributed. The first part of this sum, u, is assumed to be a positive disturbance, representing the effects of the inefficiency or the weaknesses in managerial performance. This part is also supposed to be distributed as half-normal as well as truncated at zero, [𝑢~𝑁+(𝜇, 𝜎𝑢2)],
with non-zero μ mean, as each unit´s production must lie on or below its production frontier, but above zero. The second part of the error, v, represents the random disturbances and is assumed to be distributed as two-sided normal, with zero mean and variance 𝜎𝑣2.
8 Since the estimation of the cost function provides only the value of the error term, ε, we need to find a way to estimate the value of the inefficiency part, u. Following Jondrow et al (1982) and Greene (1990) we can decompose the total variance into 𝜎2= 𝜎𝑢2+ 𝜎𝑣2 , where 𝜎𝑢2=
𝜎22 1+2 is
the contribution of the inefficiency term; 𝜎𝑣2=
2
1+2 , is the contribution of the noise, and
=𝑢
𝑣 represents the relative contribution of the inefficiency term. Moreover, the variability
of the inefficiency term, u, to the total variability can be represented with = 𝜎𝑢2
𝜎𝑢2+𝜎𝑣2 or = 2
1+2
where 0 ≤≤ 1. Therefore, if is close to zero the deviations of the costs will be mostly due to statistical noise; and if is close to one, the deviations will be mostly related to the existence of technical inefficiencies.
This possibility to differentiate the statistical noises (v) from the inefficiency deviations (u) is one of the recognised advantages of the SFA. Another important advantage of this method is that it is not sensitive to outliers, meaning that, if we include in our estimations a variable that is not clearly relevant, this variable will have a very low weighting in the measure of the efficiency scores, and the impact of this non-relevant variable will be considered as negligible.
Despite the lack of consensus regarding the precise definition of the banking outputs and inputs, there is a general view considering that banks attract deposits and other funds and, using labour and other types of inputs such as buildings, equipment and technology, they transform the funds into loans and other assets or securities.
The data used in this paper are sourced from the Moody’s Analytics BankFocus database that has the advantage of combining the well-known data content of the Bureau van Dijk and the Moody’s Investors Services with the expertise from Moody’s Analytics. Despite the comprehensive information provided by this database we still had to deal with the lack of information for some of the considered years and/or indicators for the universe of the European banks and this restricted our choices in terms of the banks included in our sample as well as the definition of the banks’ outputs and inputs.
9 We will follow the intermediation approach and we will use the natural logarithms of the chosen variables to estimate a function considering the Total Cost (defined as the sum of the interest expenses and the non-interest expenses) as the dependent variable. We will consider two models, one including three outputs: Total Loans, Other Earning Assets and Non-Earning Assets (Model
1) and another model only including Total Loans and Other Earning Assets as outputs (Model 2).
In both models we will consider two inputs: the price of the borrowed funds (defined as the ratio of the Interest Expenses to the Deposits and Short-Term Funding) and the price of capital and labour (proxied by the ratio of the Non-Interest Expenses to the Total Assets).
In our models we will also include some other control variables that are supposed to represent banks’ performance and to influence banks’ cost: the ratio of Bank Equity to Total Assets, the ratio of Off-Balance Sheet Items to Total Assets, the ratio of Non-Performing Loans to Gross Loans, and the ratio of Profit Before Tax to Average Assets. The ratio of Equity to Total Assets is included as a proxy for leverage, representing the risk preferences across banking institutions (see, among others, Bikker et al, 2012; Apergis and Alevizopoulou, 2011; Apergis, 2015). The inclusion of the ratio Off-Balance Sheet Items to Total Assets and Non-Performing Loans to Gross Loans takes into consideration the non-traditional bank activities and the risks inherent to banking operations (following, authors such as Chiu et al., 2011; Guarda et al., 2013; Mamatzakis, 2015; Hughes and Moon, 2018). Several recent papers opt to include the Non-Performing Loans as undesired output when estimating their efficiency frontiers (for instance, Matthews, 2010; Maggi, 2016; Boussemart et al., 2017; Colesnic et al., 2018).
In our estimations we also include the ratio Profit Before Tax to Average Assets as a control variable, aiming to analyse the influence of banks’ profitability (extensively discussed, for example, in Athanasoglou et al., 2008; Albertazzi and Gambacorta, 2009; Kok et al., 2015; Martinho et al., 2017).
As we want not only to measure the efficiency of the EU banking sector but also to analyse the effects of the eventual exit of some relevant countries, in our estimates we will consider six panels. First, we include the whole sample of the banks from all current EU member-states. Then we consider 4 panels, each of them excluding the banks of 4 relevant EU countries: France, Germany,
10 Italy and the UK. Finally, we consider a panel excluding the banks of the five countries that were deeply affected by the international financial and sovereign crisis, countries that had to overcome very challenging problems, some of them related to the performance of their banking institutions: Cyprus, Greece, Ireland, Portugal and Spain.
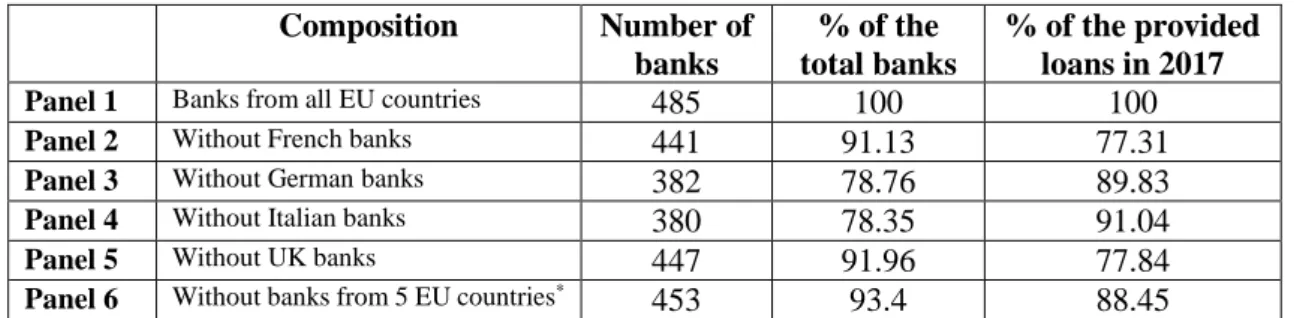
Table 1 presents the six balanced panels used in our estimates, mostly restricted by the available data in the Moody’s Analytics BankFocus database over the period from 2011 to 2017. The presented information documents the relevance of the banks of the countries excluded from the whole sample in each of our sub-samples in terms of the percentage of the total banks as well as the percentage of the loans provided in 2017. According to this information, for example, the UK banks represent 8% of the banks included in our sample but in 2017 provided more than 22% of the loans provided by our whole sample of EU banks. On the other side, the Italian banks represent almost 22% of the banks included in the whole sample but in 2017 they provided only 9% of the loans provided by all the considered banks from the 28 EU countries (the number of banks by each of the EU member-states and their representativeness in our sample are presented in Annex I).
Table 1 - Composition and relevance of the six panels considered in the estimations
Composition Number of banks % of the total banks % of the provided loans in 2017
Panel 1 Banks from all EU countries 485 100 100
Panel 2 Without French banks 441 91.13 77.31
Panel 3 Without German banks 382 78.76 89.83
Panel 4 Without Italian banks 380 78.35 91.04
Panel 5 Without UK banks 447 91.96 77.84
Panel 6 Without banks from 5 EU countries*
453 93.4 88.45
*EU countries non-included in Panel 6: Cyprus, Greece, Ireland, Portugal and Spain.
4. Results obtained
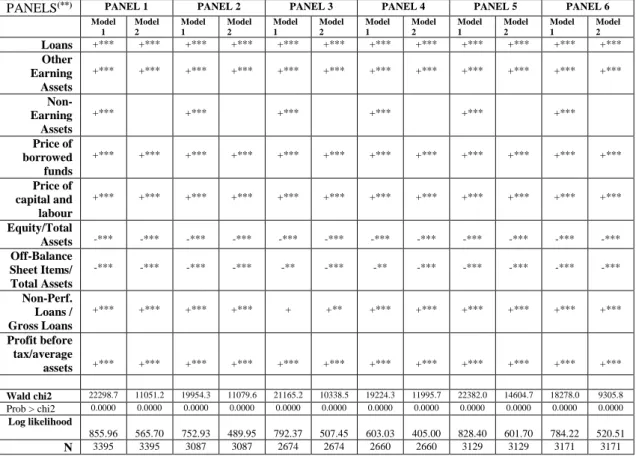
Table 2 summarises the results obtained with panel Stochastic Frontier estimates in the two models and the six considered panels (see Annex II for detailed information about the results
11 obtained with SFA). According to Table 2, the results obtained for the Wald tests and the log of the likelihood allow us to conclude that, in both models, the specified cost functions fit the data well and, in all situations, the null hypothesis that there is no inefficiency is rejected.
The robustness of the results obtained with Model 1 (including as outputs the Loans, the Other Earning Assets and the Earning Assets) is fully confirmed with Model 2 (excluding the Non-Earning Assets from the outputs).
Not surprisingly, in all situations, the elasticity of the cost relative to each of the considered outputs is positive, meaning that an increase in the production results contributes to the growth of the costs. Moreover, and as expected, the higher are the costs of the considered production inputs (that is, the price of the borrowed funds and the price of capital and labour) the higher will also be the Total Cost.
Table 2 - Summary of the results obtained with panel Stochastic Frontier estimates (*)
PANELS(**) PANEL 1 PANEL 2 PANEL 3 PANEL 4 PANEL 5 PANEL 6
Model 1 Model 2 Model 1 Model 2 Model 1 Model 2 Model 1 Model 2 Model 1 Model 2 Model 1 Model 2 Loans +*** +*** +*** +*** +*** +*** +*** +*** +*** +*** +*** +*** Other Earning Assets +*** +*** +*** +*** +*** +*** +*** +*** +*** +*** +*** +*** Non-Earning Assets +*** +*** +*** +*** +*** +*** Price of borrowed funds +*** +*** +*** +*** +*** +*** +*** +*** +*** +*** +*** +*** Price of capital and labour +*** +*** +*** +*** +*** +*** +*** +*** +*** +*** +*** +*** Equity/Total Assets -*** -*** -*** -*** -*** -*** -*** -*** -*** -*** -*** -*** Off-Balance Sheet Items/ Total Assets -*** -*** -*** -*** -** -*** -** -*** -*** -*** -*** -*** Non-Perf. Loans / Gross Loans +*** +*** +*** +*** + +** +*** +*** +*** +*** +*** +*** Profit before tax/average assets +*** +*** +*** +*** +*** +*** +*** +*** +*** +*** +*** +*** Wald chi2 22298.7 11051.2 19954.3 11079.6 21165.2 10338.5 19224.3 11995.7 22382.0 14604.7 18278.0 9305.8 Prob > chi2 0.0000 0.0000 0.0000 0.0000 0.0000 0.0000 0.0000 0.0000 0.0000 0.0000 0.0000 0.0000 Log likelihood 855.96 565.70 752.93 489.95 792.37 507.45 603.03 405.00 828.40 601.70 784.22 520.51 N 3395 3395 3087 3087 2674 2674 2660 2660 3129 3129 3171 3171
(*) Dependent variable: Total Cost
(**) Panel 1: Banks from all EU countries; Panel 2: Without France; Panel 3: Without Germany; Panel 4: Without Italy;
12 In what regards to the control variables, the results presented in Table 2 indicate that the elasticity of the Total Cost relative to the ratio of the Non-Performing Loans to the Gross Loans is always positive, meaning that the effect in the Total Cost of the performing and non-performing loans is similar, although not with the same statistical significance (as presented in this Table 2 and more clearly documented in Annex II). In addition, the growth of the ratio of the Profit before Tax to the Average Assets is always statistically significant and in line with the growth of the Total Cost. On the other side, the elasticity of the Total Cost relative to the ratio Equity to Total Assets and to the ratio Off-Balance Sheet to Total Assets is always negative and statistically significant, revealing that the Total Cost does not increase with the growth of the banks’ Equity nor with the banks’ activities that are not included in the banks’ Balance Sheets.
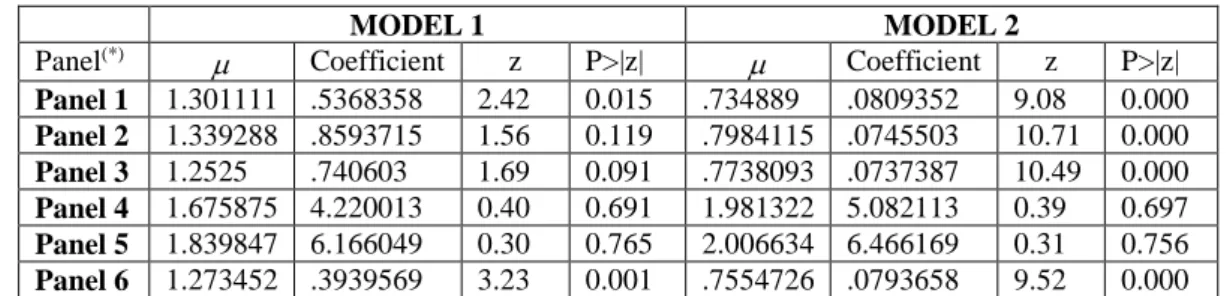
Table 3 presents the values of the mean, , of the first part of the cost function’s error that capture the effects of inefficiency. The results obtained reveal the existence of technical inefficiencies and that they are almost always statistically significant, more evidently in Model 2, where we only consider two outputs: Loans and Other Earning Assets.
Table 3 – Values of the mean of first part of the cost’s function error ()
MODEL 1 MODEL 2
Panel(*) Coefficient z P>|z| Coefficient z P>|z|
Panel 1 1.301111 .5368358 2.42 0.015 .734889 .0809352 9.08 0.000 Panel 2 1.339288 .8593715 1.56 0.119 .7984115 .0745503 10.71 0.000 Panel 3 1.2525 .740603 1.69 0.091 .7738093 .0737387 10.49 0.000 Panel 4 1.675875 4.220013 0.40 0.691 1.981322 5.082113 0.39 0.697 Panel 5 1.839847 6.166049 0.30 0.765 2.006634 6.466169 0.31 0.756 Panel 6 1.273452 .3939569 3.23 0.001 .7554726 .0793658 9.52 0.000 (*)Panel 1: Banks from all EU countries; Panel 2: Without France; Panel 3: Without Germany; Panel 4: Without Italy;
13 The existence of inefficiencies is confirmed in Table 4 by the very high (all between 0.8 and 0.9) and statistically significant values of the gammas (= 𝜎𝑢2
𝜎𝑢2+𝜎
𝑣2 ), which represent the contribution
of the inefficiency term (u) to the total error.
The results obtained clearly demonstrate that the inefficiencies are still higher in Model 2, revealing that the consideration of three outputs (Loans, Other Earning Assets and Non-Earning Assets) in Model 1 decreases the relevance of the bank cost inefficiency term in the total error. Furthermore, a careful analysis of the gamma () values, presented in Table 4, shows that in both models the inefficiency error terms are lower in Panel 4 and higher in Panel 6. These results reveal that the exclusion of the Italian banks (our Panel 4) looks like being more beneficial to the banks’ cost efficiency; and the worse scenario for banks’ efficiency is represented by Panel 6, that is, the exclusion of the banks of the 5 EU countries that were deeply affected by the international financial and the sovereign crises and were obliged to restructure their bank systems (Cyprus, Greece, Ireland, Portugal and Spain).
Table 4 – Summary of the values of the contribution of the inefficient error term to total variance ()
MODEL 1 MODEL 2
Panel(*) Coefficient Standard error Coefficient Standard error Panel 1 .8149317 .0129716 .8875373 .0117008 Panel 2 .803966 .0143326 .8790965 .0130558 Panel 3 .8051674 .0155383 .8853834 .0137433 Panel 4 .7999936 .0148083 .8351319 .0145627 Panel 5 .8105175 .0130569 .8454453 .012305 Panel 6 .8225118 .0133963 .8980313 .0113594
(*)Panel 1: Banks from all EU countries; Panel 2: Without France; Panel 3: Without Germany; Panel 4: Without Italy;
Panel 5: Without UK; Panel 6: Without 5 EU countries (Cyprus, Greece, Ireland, Portugal and Spain).
The previous results are reinforced by the comparison of the values of the error term associated to inefficiency (σu ) and the random disturbances (σv) that are presented in Table 5. In all situations the inefficiency error term is much higher than the noise.
14
Table 5 – Summary of the results obtained for the variance of the inefficient error term
(
σu )and the noise(
σv)
MODEL 1 MODEL 2
sigma_u2 sigma_v2 sigma_u2 sigma_v2
Panel(*) Coef. Stand. error Coef. Stand. error Coef. Stand. error Coef. Stand. error Panel 1 .0949857 .0074096 .0215709 .0005829 .1928718 .0211833 .0244394 .0007063 Panel 2 .0908196 .007486 .0221449 .0006284 .1808165 .0205855 .024868 .0007393 Panel 3 .0823197 .0073811 .0199195 .000609 .1793802 .022376 .0232215 .0007507 Panel 4 .0919917 .0077609 .0229988 .0006956 .1308513 .0124452 .0258321 .0008036 Panel 5 .0903276 .0070008 .0211167 .0005887 .1290426 .0109571 .0235901 .0006718 Panel 6 .1002227 .0083183 .0216269 .0006084 .2134477 .0246559 .0242363 .0007272
(*)Panel 1: Banks from all EU countries; Panel 2: Without France; Panel 3: Without Germany; Panel 4: Without Italy;
Panel 5: Without UK; Panel 6: Without 5 EU countries (Cyprus, Greece, Ireland, Portugal and Spain).
Still according to the information presented in Table 5, in Model 1 the values of the variances of the inefficient error term are not higher than 0.1, while in Model 2 they range from 0.13 to 0.21 confirming the positive influence on banks cost efficiency of the inclusion of the Non-Earning Assets in the outputs.
Moreover, and confirming our previous conclusions, the exclusion of the banks from the 5 EU countries that had external financial assistance (our Panel 6) reinforces the variance of the error mostly due to the inefficient term; on the other side, the exclusion of the Italian banks (Panel 4) is associated with lower contributions of the variance of the inefficient error terms to the total errors of the estimated bank cost efficiency functions.
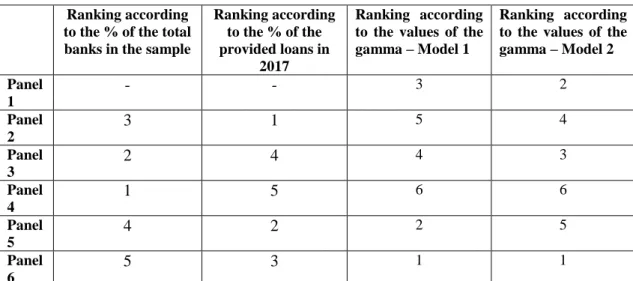
Summarising our results, Table 6 presents the different rankings of all considered panels in terms of the % of the total banks included in our sample, the % of the provided loans in 2017 and the values of the contribution of the inefficient error term to total variance, gamma (), in the two considered models.
15
Table 6 - Rankings of the considered panels Ranking according
to the % of the total banks in the sample
Ranking according to the % of the provided loans in
2017
Ranking according to the values of the gamma – Model 1
Ranking according to the values of the gamma – Model 2 Panel 1 - - 3 2 Panel 2 3 1 5 4 Panel 3 2 4 4 3 Panel 4 1 5 6 6 Panel 5 4 2 2 5 Panel 6 5 3 1 1
(*)Panel 1: Banks from all EU countries; Panel 2: Without France; Panel 3: Without Germany; Panel 4: Without Italy;
Panel 5: Without UK; Panel 6: Without 5 EU countries (Cyprus, Greece, Ireland, Portugal and Spain).
Table 6 reveals that the Italian banks (not included in Panel 4) are the most numerous in our sample, although only in the 5th place in terms of the provided loans in 2017 and they look like the less efficient of our sample.
On the other side, the most efficient banks are those not included in Panel 6, (the banks from the 5 EU countries that had external financial assistance), although they are only in the 5th place in terms of the number banks included in our sample and in the 3rd place in terms of the provided loans in 2017.
The French banks (not included in Panel 2) are in the 3rd place in terms of the number of banks but are those that lead the ranking of the provided loans in 2017. In terms of efficiency, their performance is not remarkable, particularly in our Model 1, where we consider three outputs. And in both models the French banks have a lower performance that the whole sample of banks considered in our estimations (included in Panel 1). The same happens with the German banks (not included in Panel 3) as they look like being less effective than the whole sample of banks, particularly in Model 1. Moreover, in our sample the number of the German banks is very relevant (they are in the 2nd place) although not particularly important in terms of the provided loans in 2017.
16 In what regards to the UK banks (excluded from Panel 5), they are not very numerous (4th place of the ranking) but they are relatively relevant in terms of the provided loans (2nd place of the ranking). In terms of efficiency, they have a much higher ranking in Model 1, revealing that contrary to the French and the German ones, the UK banks can be more efficient in comparison with all EU banks included in our sample, but only when we consider the model with three outputs. However, in Model 2, that is, when we consider only two outputs, the UK banks look like being less efficient than almost all the other EU banks included in our sample.
5. Concluding Remarks
In this paper we apply Stochastic Frontier Analysis techniques and use data sourced from the Moody’s Analytics BankFocus database for the period 2011-2017. Following the intermediation approach, we us, the available data and estimate a cost function considering the Total Cost more precisely, the sum of the interest expenses and the non-interest expenses) as the dependent variable.
We consider two models: one with three outputs (Total Loans, Other Earning Assets and Non-Earning Assets) and the second only with two outputs (not including the Non-Non-Earning Assets). In both models we include two inputs (the price of the borrowed funds and the price of the physical capital and labour). In our estimations we also include four control variables: the ratio of Bank Equity to Total Assets, the ratio of Off-Balance Sheet Items to Total Assets, the ratio of Non-Performing Loans to Gross Loans; and the ratio of Profit Before Tax to Average Assets.
Adding to the existing literature on bank efficiency we specifically focus on the EU banking sector and answer to the questions addressed in this study: How efficient are the EU banks in the aftermath of the international crisis? How would the EU banks perform in the hypothetical scenarios of the Brexit and the exit of the banks of other specific EU countries?
17 The results obtained allow us to conclude that during the period 2011-2017, there is clear evidence of bank cost inefficiencies in the whole sample of 485 banks from all current 28 member-states (included in our Panel 1) as well as in all the considered sub-samples (Panels 2-6). And in all panels, inefficiency is higher when we only include two outputs in our estimations.
We also consider the hypothetical scenarios of the Brexit and the exit of other three financially relevant EU countries: France, Germany and Italy, as well as the exit of the five countries that were deeply affected by the international financial and sovereign crisis (Cyprus, Greece, Ireland, Portugal and Spain). The results obtained point to the conclusion that the exit of the banks of these 5 EU countries from our sample would increase bank inefficiency while the exit of the Italian banks from our sample would clearly benefit bank efficiency. This means that in our sample the less efficient are the Italian banks and the most efficient are those banks belonging to the sub-sample of the five countries mostly affected by the crisis that requested international financial assistance.
The relevance of the French and German banks is not totally balanced in our sample. The German banks are numerous but not particularly relevant in terms of the provided loans; on the other side, the French banks are less numerous than the German ones, but they are particularly relevant in terms of the provided loans. But in what regards to the efficiency performances, both the French and the German banks have lower performances than the whole sample of EU banks considered in our estimations.
Regarding the UK banks included in our sample, they are not particularly numerous, but they are rather relevant in terms of the provided loans. The results about their cost efficiency are not unanimous in the two considered models. In model 2 (including only two outputs) the performance of the UK banks of our sample is still worse than the French and German ones. But if we include the three outputs (Total Loans, Other Earning Assets and Non-Earning Assets) the UK banks are more efficient than the whole sample of EU banks included in our sample.
Summarising our results, we can say that despite the evident cost inefficiencies of the EU banks included in our samples, there are significant differences across countries. The Brexit, and the eventual exit of other relevant countries, would surely have consequences in terms of the bank
18 efficiencies. But at least in our sample, the exit of the French, German and particularly of the Italian banks could be beneficial to the overall bank efficiency. On the other side, and still according to the results obtained with this sample of banks, the cost efficiency of the EU banks would decrease with the exit of the 5 member-states mostly affected with the crises that requested international financial assistance and were obliged to restructure their banking sectors.
These results allow us to conclude that in terms of bank cost efficiency, particular attention should be paid not only to the UK banks, but also to the French and German ones, and very particularly, to the Italian banks.
Further research in this field is still needed, namely considering other variables as bank outputs and/or inputs, using different kinds of efficiency estimates as well as other samples of EU and non-EU banks.
19
References
Aiello, F., and Bonanno, G. (2013) Profit and cost efficiency in the Italian banking industry
(2006-2011). MPRA Paper no. 48940
Aiello, F., and Bonanno, G. (2015) “Efficiency in banking: a meta-regression analysis”,
International Review of Applied Economics, 30, pp. 112-149.
Aigner, D.J., Lovell C.A.K. and Schmidt, P. (1977) “Formulation and estimation of stochastic frontier production function models”, Journal of Econometrics, 6, pp. 21-37.
Albertazzi, U., and Gambacorta L. (2009) “Bank profitability, the business cycle”, Journal of
Financial Stability, 5, pp. 393–409.
Altunbas, Y., Gardener, E.P.M., Molyneux, P. and Moore, B. (2001) “Efficiency in European banking” European Economic Review, 45, pp. 1931-1955.
Apergis, N. and Alevizopoulou, E. (2011) “Bank Efficiency: Evidence from a Panel of European Banks”, PANOECONOMICUS, 3, pp. 329-341.
Apergis, N. (2015) “Competition in the banking sector: New evidence from a panel of emerging market economies and the financial crisis”, Emerging Markets Review, 25, pp. 154-162.
Athanasoglou P., Brissimis S.N. and Delis M.D. (2008) “Bank-specific, industry-specific and macroeconomic determinants of bank profitability”, Journal of International Financial Markets,
Institutions and Money, 18, pp. 121–136
Battese, G. E. and Coelli, T. (1988) “Prediction of firm-level technical efficiencies with a generalized frontier production function and panel data”, Journal of Econometrics, 38, pp. 387-399.
Battese, G. E. and Coelli, T. (1995) “A Model for Technical Inefficiency Effects in a Stochastic Frontier Production Function for Panel data”, Empirical Economics, 20, pp. 325-332.
Bikker, J.A. (2003) Efficiency and Cost Differences across Countries in a Unified European
20 Bikker, J.A., Shaffer, S. and Spierdijk, L. (2012) “Assessing competition with the Panzar-Rosse model: the role of scale, costs, and equilibrium”, Review of Economics and Statistics, 94, pp. 1025–1044.
Bos, J. W. B. and Schmiedel, H. (2007) “Is there a single frontier in a single European banking market?”, Journal of Banking and Finance, 31, pp. 2081-2102. Farrell, M. J. (1957) “The measurement of productive efficiency”, Journal of the Royal Statistical Society,120, pp.253-290. Boussemart, J-Ph., Leleu, H., Shen, Z., Vardanyan, M. ans Zhu, N. (2017) Decomposing banking performance into economic and risk management efficiencies, Working Papers 2017-EQM-09, IESEG School of Management.
Casu, B., Girardone, C. and Molyneux, P. (2004) “Productivity change in European banking: A comparison of parametric and non-parametric approaches”, Journal of Banking and Finance, 28, pp. 2521-2540.
Charnes A., Cooper W.W. and Rhodes, E. (1978) “Measuring the Efficiency of Decision-Making Units”, European Journal of Operational Research, 2, pp. 429 - 444.
Chiu, Y.H., Chen, Y.C. and Bai, X.J. (2011) “Efficiency and risk in Taiwan banking: SBM super-DEA estimation”, Applied Economics, 43, pp. 587-602
Colesnic, O., Kounetas, K. and Polemis, M. (2018) Estimating risk efficiency in MiddleEast banks
before and after the crisis. A Metafrontier framework, MPRA Paper 84795, University Library
of Munich, Germany
Delis, M. D., Koutsomanoli-Fillipaki, A., Staikouras, C.K. and Gerogiannaki, K. (2009)
“Evaluating cost and profit efficiency: a comparison of parametric and non-parametric methodologies”, Applied Financial Economics, 19, pp. 191–202.Farrell, M.J. (1957) “The Measurement of Productive Efficiency” Journal of the Royal Statistical
Society, 120, pp. 253-290.
Greene, W. M. (1990) ‘‘A Gamma-Distributed Stochastic Frontier Model’’ Journal of
Econometrics, 46, pp.141–163.
Guarda, P., Rouabah, A. and Vardanyan, M. (2013) “Identifying bank outputs and inputs with a directional technology distance function”, Journal of Productivity Analysis, 40, pp. 185-195.
21 Hughes, J. P. and Moon, C.G. (2018) How bad is a bad loan? Distinguishing inherent credit risk
from inefficient lending (Does the capital market price this difference?), Department of
Economics, Rutgers University, Working Paper No. 201802.
Jondrow, J., Lovell, C.A.K., Materov, I.S. and Schmidt, P. (1982) “On the estimation of technical inefficiency in the stochastic frontier production function model”, Journal of Econometrics, 19, pp. 233-238.
Kocisova, K. (2017) “Measurement of Revenue Efficiency in European Union Countries: A Comparison of Different Approaches”, International Journal of Applied Business and Economic
Research, 15, pp. 31-42.
Kok, C., Móré, C. and Pancaro, C. (2015) Bank profitability challenges in euro area banks: The
role of cyclical and structural factors, ECB, Financial Stability Review, pp. 134-145.
Kuc, M. (2018) Cost Efficiency of European Cooperative Banks, Institute of Economic Studies (IES) Working paper 21/2018.
Lozano-Vivas, A., Kumbhakar, S.C., Fethi, M.D. and Shaban, M. (2011) “Consolidation in the European banking industry: How effective is it?”, Journal of Productivity Analysis, 36, pp. 247-261.
Maggi, E.F.B. (2016) Bank financial word crisis: inefficiencies and responsibilities, DSS Empirical Economics and Econometrics Working Papers Series, DSS-E3 WP 2016/2. Mamatzakis, E. (2015) “Risk and efficiency in the Central and Eastern European banking industry under quantile analysis”, Quantitative Finance, 15, pp. 553-567.
Martinho, R., Oliveira, J. and Oliveira, V. (2017) Bank Profitability and Macroeconomic
Factors, Banco de Portugal, Financial and Stability Papers, No. 5.
Matthews, K. (2010) Banking Efficiency in Emerging Market Economies, Cardiff Economics Working Papers E2010/12, Cardiff University, Cardiff Business School.
Oliveira, J. (2017) Inefficiency distribution of the European Banking System, Banco de Portugal, Working Paper No. 12.
22 Resti, A. (1997) “Evaluating the cost-efficiency of the Italian banking system: what can be learned from the joint application of parametric and non-parametric techniques”, Journal of Banking and
Finance, 21, pp. 221–250.
Tuskan, B. and Stojanovic, A. (2016) “Measurement of cost efficiency in the European banking industry”, Croatian Operational Research Review, 7, pp. 47-66.
Vozková, K. and Kuc, M. (2017) “Cost Efficiency of European Cooperative Banks”, International Journal of Economics and Management Engineering, 11, pp. 2705-2708.
Weill, L. (2009) “Convergence in banking efficiency across European countries”, Journal of
International Financial Markets Institutions and Money, 19, pp. 818-833.
Yildirim, H. S. and Philippatos, G.C. (2007) “Efficiency of Banks: Recent Evidence from the Transition Economies of Europe, 1993–2000”, The European Journal of Finance, 13, pp. 123-143.
23
Annex I – Number of banks by EU member-state and their representativeness
EU country (*) Number of
banks
% of the total banks
% of the provided loans in 2017 Austria 20 4.12 1.97 Belgium 7 1.44 2.93 Bulgaria 5 1.03 0.07 Croatia 7 1.44 0.09 Cyprus 3 0.62 0.08 Czech Rep. 8 1.65 0.47 Denmark 31 6.39 2.94 Estonia 2 0.41 0.02 Finland 5 1.03 0.54 France 43 8.87 22.69 Germany 103 21.24 10.17 Greece 6 1.24 0.76 Hungary 7 1.44 0.17 Ireland 4 0.82 0.78 Italy 105 21.65 8.96 Latvia 1 0.21 0.02 Lithuania 4 0.82 0.06 Luxembourg 9 1.86 0.44 Malta 3 0.62 0.04 Netherlands 16 3.30 9.43 Poland 14 2.89 0.98 Portugal 6 1.24 0.98 Romania 4 0.82 0.11 Slovakia 7 1.44 0.12 Slovenia 6 1.24 0.07 Spain 13 2.68 8.95 Sweden 7 1.44 3.98 UK 39 8.04 22.16
24
Annex II – Results obtained with panel stochastic frontier estimates
PANEL 1 PANEL 2 PANEL 3 PANEL 4 PANEL 5 PANEL 6 Model 1 Model 2 Model 1 Model 2 Model 1 Model 2 Model 1 Model 2 Model 1 Model 2 Model 1 Model 2
Loans
Coefficient .4666116 .5562018 .4680596 .5505037 .4458658 .5422244 .4532435 .5376321 .512265 .6011725 .4618813 .5444271
z 56.43 58.03 54.56 58.35 51.26 55.59 46.81 55.61 54.70 64.13 53.97 55.20
P>|z| 0.000 0.000 0.000 0.000 0.000 0.000 0.000 0.000 0.000 0.000 0.000 0.000
Other Earning Assets
Coefficient .2931024 .2884125 .2946971 .2856376 .3042175 .3013277 .3199344 .3247823 .2731249 .2747475 .293453 .2869654 z 41.34 33.81 39.77 32.26 40.86 32.60 37.80 32.00 35.62 30.88 39.60 32.20 P>|z| 0.000 0.000 0.000 0.000 0.000 0.000 0.000 0.000 0.000 0.000 0.000 0.000 Non-Earning Assets Coefficient .1245889 .122851 .141337 .1120953 .1129333 .1234898 z 25.46 24.13 25.43 20.64 22.00 24.34 P>|z| 0.000 0.000 0.000 0.000 0.000 0.000 Price of borrowed funds Coefficient .2607996 .2261158 .2683168 .2333441 .2544262 .218669 .2692185 .2440644 .2587642 .2338356 .2594498 .227177 z 52.47 44.21 50.92 42.91 48.89 40.10 45.17 38.89 51.90 44.77 50.14 43.09 P>|z| 0.000 0.000 0.000 0.000 0.000 0.000 0.000 0.000 0.000 0.000 0.000 0.000
Price of capital and labour Coefficient .4766282 .4982678 .4726205 .4915696 .5324253 .5488856 .4686713 .4814794 .4621374 .4779544 .4709236 .4896846 z 49.04 44.68 47.41 43.68 49.01 43.69 43.47 41.14 46.24 44.32 45.40 41.28 P>|z| 0.000 0.000 0.000 0.000 0.000 0.000 0.000 0.000 0.000 0.000 0.000 0.000 Equity/Total Assets Coefficient -.1203645 -.1261133 -.1089643 -.113411 -.1216815 -.1312132 -.1037075 -.0948648 -.1418352 -.1355074 -.130107 -.1425518 z -10.74 -10.87 -9.29 -9.21 -10.39 -10.50 -8.28 -6.99 -12.40 -10.97 -9.95 -10.67 P>|z| 0.000 0.000 0.000 0.000 0.000 0.000 0.000 0.000 0.000 0.000 0.000 0.000
Off Balance Sheet Items/ Total Assets
Coefficient -.015924 -.0196166 -.0194475 -.0230733 -.0103143 -.01555 -.0127145 -.0150176 -.0169593 -.0188142 -.0147164 -.0199891
z -3.51 -3.97 -4.17 -4.58 -2.25 -3.06 -2.37 -2.61 -3.37 -3.48 -2.89 -3.61
P>|z| 0.000 0.000 0.000 0.000 0.025 0.002 0.018 0.009 0.001 0.001 0.004 0.000
Non Perf. Loans / Gross Loans Coefficient .0200632 .0281281 .0205256 .028478 .0050243 .013664 .02825 .0353262 .025271 .0335416 .0193767 .0262413 z 3.98 5.12 3.92 4.97 0.90 2.17 4.71 5.49 4.67 5.79 3.71 4.64 P>|z| 0.000 0.000 0.000 0.000 0.370 0.030 0.000 0.000 0.000 0.000 0.000 0.000 Profit before tax/average assets Coefficient .0120258 .0111871 .0128904 .0124929 .0097104 .0109304 .0102243 .0112921 .0101162 .0099444 .0123533 .0121041
25 z 3.81 3.32 3.94 3.59 2.87 3.00 2.57 2.66 3.06 2.83 3.71 3.42 P>|z| 0.000 0.001 0.000 0.000 0.004 0.003 0.010 0.008 0.002 0.005 0.000 0.001 Constant Coefficient .8744746 1.609782 .834601 1.695644 1.063007 1.795898 3.898061 4.258934 3.612766 3.802109 .930888 1.704904 z 1.60 14.28 0.96 14.27 1.42 14.44 0.92 0.84 0.59 0.59 2.28 14.25 P>|z| 0.109 0.000 0.335 0.000 0.155 0.000 0.356 0.402 0.558 0.557 0.023 0.000 mu Coefficient 1.301111 .734889 1.339288 .7984115 1.2525 .7738093 1.675875 1.981322 1.839847 2.006634 1.273452 .7554726 z 2.42 9.08 1.56 10.71 1.69 10.49 0.40 0.39 0.30 0.31 3.23 9.52 P>|z| 0.015 0.000 0.119 0.000 0.091 0.000 0.691 0.697 0.765 0.756 0.001 0.000 gamma Coefficient .8149317 .8875373 .803966 .8790965 .8051674 .8853834 .7999936 .8351319 .8105175 .8454453 .8225118 .8980313 Stand.error .0129716 .0117008 .0143326 .0130558 .0155383 .0137433 .0148083 .0145627 .0130569 .012305 .0133963 .0113594 sigma_u2 Coefficient .0949857 .1928718 .0908196 .1808165 .0823197 .1793802 .0919917 .1308513 .0903276 .1290426 .1002227 .2134477 Stand.error .0074096 .0211833 .007486 .0205855 .0073811 .022376 .0077609 .0124452 .0070008 .0109571 .0083183 .0246559 sigma_v2 Coefficient .0215709 .0244394 .0221449 .024868 .0199195 .0232215 .0229988 .0258321 .0211167 .0235901 .0216269 .0242363 Stand.error .0005829 .0007063 .0006284 .0007393 .000609 .0007507 .0006956 .0008036 .0005887 .0006718 .0006084 .0007272 Wald chi2 22297.73 11051.20 19954.33 11079.59 21165.18 10338.49 19224.27 11995.73 22381.99 14604.68 18277.99 9305.80 Prob > chi2 0.0000 0.0000 0.0000 0.0000 0.0000 0.0000 0.0000 0.0000 0.0000 0.0000 0.0000 0.0000 Log likelihood 855.95628 565.70046 752.92722 489.94514 792.37426 507.45373 603.03076 404.99953 828.39965 601.70264 784.22061 520.50739 N 3395 3395 3087 3087 2674 2674 2660 2660 3129 3129 3171 3171
Dependent variable: Total cost
Panel 1: Banks from all EU countries; Panel 2: Without French banks; Panel 3: Without German banks; Panel 4: Without Italian banks; Panel 5: Without UK banks; Panel 6: Without the banks from 5 EU countries (Cyprus, Greece, Ireland, Portugal and Spain).