O
CTOBER
2016
MASTER IN
F
INANCE
MASTERS FINAL PROJECT
D
ISSERTATION
T
AX
P
OLICY AND
E
NTREPRENEURIAL
A
CTIVITY
O
CTOBER
2016
MASTER IN
F
INANCE
MASTERS FINAL PROJECT
D
ISSERTATION
T
AX
P
OLICY AND
E
NTREPRENEURIAL
A
CTIVITY
A
NA
M
ARGARIDA
M
ENDES
S
ILVÉRIO
G
UIDANCE:
ii Abstract
This study analyzes the impact of the tax benefits for inland regions in Portugal. More
specifically, we evaluate the effect of this policy change on firm entry and on two
regional socio-demographic characteristics: child birth and divorce rate.
Previous studies suggest that reducing taxes increases the level of profit opportunities
and, thus, the entry of new firms. They also find that in periods of economic prosperity,
life conditions improve and the divorce rate increases, while there is no conclusive
evidence about the exact relationship between income and child birth.
To test these predictions, we use a matched employer-employee dataset (QP –“Quadros
de Pessoal”) to estimate firms entry between the period 1997 and 2007. Regional
socio-demographic data come from Statistics Portugal (INE – “Instituto Nacional de
Estatística”).
Contrary to our expectations, we find that the introduction of the policy reduce firm
entry, as well as the child birth and divorce rate. We obtain similar results using an
instrumental variable. The negative effect on firm entry persists even when we divide
our sample into the different stages of the policy introduction. These results are not
consistent in restricted samples (nearby counties).
JEL Classification: H25, H32, L26, M13, R11, R58
iii Resumo
Esta dissertação analisa o impacto da política dos benefícios fiscais para as regiões do
interior em Portugal. Mais especificamente, avaliamos o efeito desta mudança de
política na entrada de novas empresas e em duas características regionais
sócio-demográficas: taxa de natalidade e taxa de divórcio.
Estudos anteriores sugerem que a redução de impostos aumenta a rendibilidade das
empresas e, portanto, a entrada de novas empresas. Também sugerem que em períodos
de prosperidade económica, as condições de vida melhoram e a taxa de divórcio
aumenta, enquanto que não há evidências conclusivas sobre a relação exata entre o
rendimento e a natalidade.
Para testar estas hipóteses, usámos uma base de dados empregador-empregado (QP –
“Quadros de Pessoal”) para avaliar as empresas estabelecidas entre o período de 1997 e
2007. Os dados regionais sócio-demográficos foram recolhidos do INE (“Instituto
Nacional de Estatística”).
Contrariamente ao esperado, a introdução da política reduz a entrada de novas
empresas, assim como a taxa de natalidade e de divórcio. Obtemos resultados
semelhantes usando uma variável instrumental. O efeito negativo na entrada de
empresas persiste mesmo quando dividimos a nossa amostra nas diferentes fases da
introdução da política. Estes resultados não são consistentes nas amostras restritas
(concelhos vizinhos).
Classificação JEL: H25, H32, L26, M13, R11, R58
iv Acknowledgements
These last two years were very important for my personal and professional life and, for
that, I would like to thank my family and friends for the daily support and
encouragement not only during the last years but through my entire life. Thank you for
your faith in me, your patient and tolerance in my days in bad mood. I dedicate this
dissertation to my parents, in which without them this would not have been possible.
Thank you both for giving me this opportunity, for your love and motivation.
To professor Ana Venâncio, I want to express my sincere gratitude for her guidance,
patience and support, which without these it would also not have been possible. I would
also like to thank her for raising this work with her knowledge and experience and for
the possibility she gave me for improving my research and independence abilities.
Finally, I would like to thank the Portuguese Ministry of Employment and Social
Security and Gabinete de Estratégia e Planeamento (GEP) for giving me access to the
matched employer-employee data. All errors remain my own. Views expressed are
those of the author and do not necessarily reflect those of any branch or agency of the
v List of Figures
Figure 1: Corporate Tax Rate (1997-2007; %) 32
Figure 2: Neighbor Counties 33
vi List of Tables
Table 1: Descriptive Statistics 35
Table 2: Impact of the Policy of Tax Benefits for Inland Areas on Firm Entry – Total
Sample 36
Table 3: Impact of the Policy of Tax Benefits for Inland Areas on Firm Entry –
Restricted Sample 37
Table 4: Impact of the Policy of Tax Benefits for Inland Areas on Regional
Socio-Economic Activity (Child Birth Rate) – Total Sample 38
Table 5: Impact of the Policy of Tax Benefits for Inland Areas on Regional
Socio-Economic Activity (Child Birth Rate) – Restricted Sample 39
Table 6: Impact of the Policy of Tax Benefits for Inland Areas on Regional
Socio-Economic Activity (Divorce Rate) – Total Sample 40
Table 7: Impact of the Policy of Tax Benefits for Inland Areas on Regional
Socio-Economic Activity (Divorce Rate) – Restricted Sample 41
vii Table of Contents
1. Introduction ... 1
2. Literature Review and Hypothesis ... 4
2.1. Personal Income Taxes ... 4
2.2. Corporate Taxes ... 5
2.3. Tax Structure ... 6
2.4. Regional Demographic Characteristics ... 8
3. Tax Benefits for Inland Regions ... 11
4. Data and Descriptive Statistics ... 13
4.1. Data ... 13
4.2. Sample ... 13
4.3. Descriptive Statistics ... 13
5. Empirical Methodology and Results ... 16
5.1. Firm Entry ... 16
5.2. Regional Socio-Demographic Characteristics ... 19
6. Conclusion ... 24
References ... 26
Appendix A – Laws and Legal Documents on the Tax benefits to Inland Regions (1997-2007) ... 42
viii List of Abbreviations
QP – Quadros de Pessoal
MESS – Ministry of Employment and Social Security
INE – Instituto Nacional de Estatística
PS – Partido Socialista
1 1. Introduction
Entrepreneurship plays an important role in the economy. It stimulates competition and
economic growth by fostering innovation, productivity, and job creation (Ardagna and
Lusardi, 2008; Carree and Thurik, 2010; Fernandes, et al., 2011; Hansson, 2012; Parker,
2009). To encourage entrepreneurial activity and correct market failures, governments
around the world have implemented several policies (Parker, 2009), such as subsidies
and grants to specific start-ups, entry deregulation reforms, and tax cuts. Among those,
the most common policy used by the governments to promote firm entry is taxation (Da
Rin, et al., 2011).
Despite creating complexity in the tax system and rising compliance and administrative
costs for both tax payers and governments, tax incentives encourage new firms to start
their activities (Mintz and Andersen, 1992). Governments usually use tax incentives
instead of expenditure policies. First, because it is politically more appealing for the
government to provide a reduction in taxes rather than give a subsidy to a firm, and then
because the administrative burden of determining which firm should benefit from the
policy decreases for tax incentives(Mintz and Andersen, 1992).
Tax policy can affect entrepreneurial activity in several ways. It influences not only the
decision to establish a new business, but also the firm organizational structure and
profitability (Bruce and Mohsin, 2006). Taxes have a strong impact on the
organizational form of firms. In fact, the choice of the organizational form is frequently
made to reach tax advantages or to decrease their taxable base (Luna and Murray,
2010). Besides, tax policy also influences the cost of capital, which affects in the end
the hiring and investment decisions of the firm(Bruce and Mohsin, 2006).
Previous studies found that tax policy has an ambiguous effect on entrepreneurial
2
but it can also increase firm entry due to the rewards from tax avoidance or evasion
(Bruce and Mohsin, 2006; Bruce and Deskins, 2012). On the other hand, tax rate
reductions provide a monetary benefit that might increase or decrease entrepreneurial
activity (Fossen and Steiner, 2009; Da Rin, et al., 2011; Bacher and Brülhart, 2013).
Also, tax benefits can be used as an instrument to promote regional growth by attracting
investment and creating jobs, especially in economically less developed regions
(Fernandes, et al., 2011). The reduction of local taxes can contribute to attract more
entrepreneurs and develop those regions (Rathelot and Sillard, 2008).
In this study, we evaluate the effect of reducing corporate taxes on firm entry in the less
favored regions by taking into account a Portuguese tax reform. This reform was
introduced in 1999 by the government, who created tax benefits for the inland region.
Their main goal was to fight human desertification and promote economic recover. Our
research questions are: Does reducing corporate taxes affect entrepreneurial activity?
How does it affect the regional socio-demographic characteristics?
To answer our research question, we use a matched employer-employee dataset (QP –
“Quadros de Pessoal”), which includes detailed information about the founders and
their firms between 1997 and 2007. In addition we collect data from the Statistics
Portugal (INE –“Instituto Nacional de Estatística”) on child birth rate and divorce rate.
Our results suggest a negative effect between the policy of tax benefits and firm entry,
as well as the child birth and divorce rate. We found that the introduction of the policy
reduced the entry of new firms, the child birth rate and the divorce rate. These results
are not consistent in restricted samples (nearby counties). When we divide our sample
into the three stages of the policy introduction, we found that the policy continues to
reduce the entry of new firms. In the second stage, we found that both child birth rate
3
This study has several policy implications. Previous studies suggest that reducing
corporate tax increases investment, creates new jobs and contributes to the economic
growth, especially in less developed regions. In our study, we find a negative effect
which suggest that reducing taxation is not enough to promote entrepreneurial activity
in less developed regions.
The remaining sections of this study are structured as follows. The next section provides
an overview of the main literature regarding the impact of the corporate taxation on
entrepreneurial activity and presents the main hypotheses. Section 3 describes the policy
of tax benefits for inland in Portugal . Section 4 describes our data and presents the
descriptive statistics. Section 5 presents the empirical methodology and the results of
4 2. Literature Review and Hypothesis
Tax policy is a very common instrument used by governments to promote economic
activity. Their main goal is to encourage the creation of new firms in order to stimulate
innovation, competition, employment and economic growth (Da Rin et al., 2010). For a
region, stimulating new firms is a way to promote economic growth (Parker, 2005;
Fritsch, 2008). Taxes allow the government to redistribute income from wealthy to poor
citizens. Also, taxes can have strong effects on entrepreneurship, since it is a very
important driver for innovation and economic development (Block, 2016). New firms
bring new capacities into the market and are, for that reason, an important element of
the market process (Fritsch, 2008).
The rate at which new enterprises enter an industry has led to increasing pressure on
policy makers to improve the conditions for entrepreneurial activity (Kneller and
McGowan, 2012). Governments usually make use of tax policy instead of structural
reforms, since it is easier to change tax rates in the budget law (Da Rin et al., 2011).
Different kind of taxes (personal income and corporate taxes) affect firm entry
decisions.
In this section, we will start by evaluating the impact of personal income taxes and then,
the impact of corporate income taxes on entrepreneurship. Then, we evaluate several
characteristics of taxes and we conclude this section by analyzing the impact of tax
policies on regional demographic characteristics.
2.1. Personal Income Taxes
Personal income taxes apply to the personal income of an individual. Several studies
have analyzed the effects of taxes on self-employment and suggested that tax policy has
5
hand, the literature shows a negative link between tax rates and self-employment
(Fölster, 2002; Bruce and Mohsin, 2006; Baliamoune-Lutz and Garello, 2013). In fact,
high tax rates leads to lower levels of self-employment, as taxes reduce the expected
return that an individual receives by undertaking a risky business and an additional
effort associated with being self-employed (De Mooij and Nicodeme, 2010; Hansson,
2012). On the other hand, high taxes might drive individuals into self-employment
because it provides tax-sheltering opportunities, which include both avoiding and
evading taxation. For example, the main reason for the increase of self-employed
individuals is due to the ease of underreporting taxable income, which allows, in an
illegally way, to pay less taxes (Schuetze and Bruce, 2004; Gentry and Hubbard, 2005).
Also, income taxes might encourage entrepreneurial activity as self-employed
individuals earn substantial personal non-pecuniary returns which are untaxed (Hall and
Sobel, 2006). Furthermore, higher after-tax earnings appeal individuals to become
employed (Fossen, 2008). To sum up, the effect of personal income taxes on
self-employed individuals is ambiguous.
2.2. Corporate Taxes
Corporate income taxes are the taxes paid by firms on their taxable income. Most
studies found that lower taxation increases the level of profit opportunities, so it is
expected to increase the entry of new firms (Djankov et al., 2010; Da Rin et al., 2011;
Barros, 2016). Using data on firm entry in 17 European countries during the period
between 1997 and 2004, Da Rin et al. (2011) found evidence of a significant negative
effect of corporate income taxation on entry rates. This effect is concave, suggesting
6
Similarly, Djankov et al. (2010) found that a higher corporate tax burden significantly
decreases the gains from entrepreneurship and hence, the rate of firm entry.
Another fact that leads to the entry of new firms is incorporation. This is a legal way of
creating a corporate entity. In this way, entrepreneurs pay corporate tax on their
business profits and are able to choose if they pay themselves a salary as a director of
their firm or dividends to avoid payroll taxes (Parker, 2009). If corporate income tax
rates increase, the profits decrease for incorporated firms and hence, reducing incentives
for individuals to become entrepreneurs (Block, 2016). Thus, the level of tax rates
influences the decision of incorporate or not. Egger et al.’s (2008) model examines the
decision to incorporate considering the level of tax rates. Higher effective corporate tax
rate decreases a firm’s probability of incorporating. Also, existing entrepreneurs seem to
be much less receptive to tax policy changes than those that are initiating a new
business (Kneller and McGowan, 2012).
Therefore, we expect to find a negative correlation between corporate income tax rates
and entrepreneurial activity.
Hypothesis 1: A reduction on corporate taxes increases firm entry.
2.3. Tax Structure
Some studies have analyzed how the tax structure affects entrepreneurial activity. Not
only the tax rate influences the probability of an individual moving to entrepreneurship,
but also its progressivity/structure and the relation between different taxes: personal
versus corporate income taxes (Hansson, 2012). Usually, corporate taxes are flat, unlike
the personal income tax which is likely to be progressive with marginal tax rates that
7
The literature presents ambiguous results for the effect of tax progressivity on
entrepreneurial activity. Tax progressivity can lower entrepreneurship by reducing the
size of profit opportunity, but it can also lead to an increase for individuals who can take
advantage of tax evasion (Gentry and Hubbard, 2000). Later on, Gentry and Hubbard
(2005) conclude that both the level of the marginal tax rate and the progressivity of the
tax have a negative effect in entrepreneurial entry.Entry rates might also be affected by
the complexity of corporate income tax system and by tax burdens. Bacher and Brülhart
(2013) evaluated the effect of corporate income tax schedule on firm births, using Swiss
micro-level data. They examined three effects: effect of the average tax burden, effect
of progressivity, and effect of the complexity of the system. They found that lower
average tax rates and less tax code complexity promote firm births, while reduced
progressivity deters it.
Associated with these issues, Cullen and Gordon (2007) developed a model that
examine the importance of the tax structure and found that the impact of taxes on
entrepreneurial risk-taking depends on the kind of taxes. Their model showed the effect
of the tax structure on self-employment operated through three channels: first
income-shifting, the tax structure offers incentives to shift income from highly taxed labor
income to lower taxed corporate income, or vice versa; second risk-subsidy, the tax
structure encourages risk-taking as it allows incorporation and losses can be deducted
against highly taxed labor earnings; third risk-sharing. As higher corporate income taxes
create a risk-sharing effect, this lowers the entrepreneur’s risk-premium and encourages
entry. According to Cullen and Gordon (2007), raising the income tax has an ambiguously positive effect on the probability of individuals to become self-employed,
8 2.4. Regional Demographic Characteristics
One of the most common instruments used by governments to promote the less
developed regions is the tax benefits. Tax benefits usually contribute to the development
of regions, especially those with less financial resources (Sequeira and Sá, 2008). It is
expected that these incentives are capable of strengthen the economic and social
characteristics of those regions. In this way, they usually promote investment and, thus,
the creation of employment opportunities, and encourage economic activity, which
increases public revenues and public services (Sequeira and Sá, 2008; Fernandes, et al.,
2011). This encouragement in the backward regions would lead to localized incentives
(Klemm, 2010).
Some studies found a positive relationship between income and child birth (Rupert,
2008). New entry brings new investment and stimulates employment, creating better life
conditions for people who live in the less developed regions (Sequeira and Sá, 2008;
Fernandes, et al., 2011). As such, there is a tendency for people to migrate to those
regions, in which they may find better life conditions. So, new firm entries promote
regional social and economic growth (Fernandes, et al., 2011). The migration inflows
will be associated with an increase on child birth rate. On the other hand, some studies
found some factors that have a negative impact on child birth (Galor and Weil, 1996;
Adserà, 2004). According to Galor and Weil (1996), there is a negative relationship
between income and child birth. They found that higher wages for women will make
them spend more of their time working. This will then raise the opportunity cost of
having a child, which will lead to a decrease on child birth rate. Other explanation to
this negative impact is the labor market instability. Confronted with this instability,
women postpone or even abandon the idea of having a child, as this would reduce
9
relationship between income and child birth is considered a theoretical puzzle for some
economists, since it is expected that as the income goes up, the child birth should also
go up (Rupert, 2008).
Despite all the empirical work, there is no conclusive evidence about the exact
relationship between income and child birth. In this way, we will test our hypothesis
according to our expectations. Thus, we expect to find that with the entry of new firms
the birth rate increases, since more people will migrate to eligible regions. Also, as the
life conditions improve, the number of child birth rate would also increase. Thus, we
expect
Hypothesis 2: A reduction on corporate taxes increases regional child birth.
Some authors find that in periods of prosperity the divorce rate increases (South, 1985;
Trent and South, 1989). In this periods, the participation of female workers in the labor
market increases. And this, by consequence, will have a strong negative impact on the
divorce rate (South, 1985; Trent and South, 1989; Weiss, Tzeng and Mare, 1995; 1997;
Jalovaara, 2003). According to Jalovaara (2003), the risk of divorce is associated with
the spouses’ socioeconomic position. Women who were employed and whose her
husbands also are employed had stable marriages. If the husband have a high income,
the risk of divorce is low. In contrast, if the wife have also a high income, this increases
the risk of divorce, especially if it exceeds the husband income. Tzeng and Mare (1995)
also find that if wives work more than their husbands, this rises the chances of
disruption. Besides, positive changes in wives’ socioeconomic and labor force
10
Therefore, as regional economic activity increases due to tax cuts, we expect an increase
on the divorce rate. Individuals will probably be more focused at work, more tired and
they will spend less time at home. We expect
11 3. Tax Benefits for Inland Regions
To better frame the paper’s results, we will briefly describe the policy of tax benefits for
inland regions in Portugal. Appendix A presents the laws and documents associated
with tax benefits for inland regions.
This policy started by the Law nr. 127-B/97 which gave legislative authorization for the
incumbent government at the time (PS) to create a system of fiscal incentives for the
micro and small firms. Then, it was created the Projeto de Lei 522/VII, which was a legislative initiative from PSD1 over the legislative authorization of the previous law.
After its approval, the government created the Law nr. 171/99 in order to create tax
benefits to attract new firms for less developed regions, help fight population migration
out of inland areas and promote economic and social recovering of those regions. The
main goal was to boost the regional economy of those regions.
The corporate tax rate suffered several modifications (see Figure 1). According to No. 2
of the article 7 of the Law nr. 171/99, the corporate tax rate for new firms located in
eligible counties was 20% and it lasted for the first five years of activity. In non-eligible
counties, new firms faced a corporate tax rate of 32%. According to Ofício-Circulado 147, the beneficiary areas were chosen according to population density, tax deficiency and inequalities of social, economic and cultural opportunities. Table B1 of Appendix B
presents the complete list of eligible counties.
The fiscal incentives were then updated and integrated in Estatuto dos Benefícios Fiscais through a new article 39.º - B. The article 83º of the Law nr. 53-A/2006, changed the corporate tax rate to 15% for new firms located in the same eligible
counties, while the corporate tax rate for non-eligible counties was 25%. This law was
revoked by the article 73º of the Law nr. 67-A/2007, which changed again the corporate
12
tax rate from 15% to 10% benefiting the new firms, while the normal tax in the country
13 4. Data and Descriptive Statistics
4.1. Data
Data on firm entry come from a matched employer-employee database (QP - “Quadros de Pessoal”).
QP is a mandatory survey submitted annually to the Portuguese Ministry of
Employment and Social Security (MESS) by firms with at minimum one employee.
This database gathers detailed information on more than 220,000 firms and 2 million
individuals per year, which covers almost the entire Portuguese private sector from
1986 to 2012. Annually, for each firm, the following data is available: entry year,
location, size, industry, number of establishments, initial capital and ownership
structure.
Data on regional demographic characteristics, namely child birth rate and the divorce
rate came from INE.
4.2. Sample
From QP, we select all new firms established between 1997 and 2007. We exclude
non-profit firms and start-ups in the primary sector. Next, we compute the total number of
firms by county and year. In total, we ended up with 35,508 county year observations,
corresponding to 21,912 eligible counties and 13,596 non-eligible counties.
4.3. Descriptive Statistics
Table 1 provides the descriptive statistics for our sample divided into eligible and
14
the policy, (2) the period when the policy is introduced with a corporate tax rate of 20%,
and (3) the period when the corporate tax rate suffers another reduction to 15%.
The eligible counties are associated with an increase in the number of new firms. The
average number of new firms per county is 0.85 between the period 1997 and 1999,
1.33 in the period between 2000 and 2004, and 1.41 between 2005 and 2007. Regarding
population, population density and purchasing power, we notice that with the
introduction of the policy, the population and population density decreased, while the
purchasing power increased. The average population remained around the 14,000,
population density was, on average, approximately 54 and, in the period after the policy,
decreased to approximately 53, and purchasing power was, on average, 53.81 before the
introduction of the policy and increased to 58.57 between the period 2000 and 2004,
and to 64.26 between 2005 and 2007. Concerning the socio-demographic
characteristics, we notice that after the introduction of the policy, the child birth rate
decreased (before the introduction of the policy it was approximately 9 and after
decreased to 8 between 2000 and 2004, and to 7 between 2005 and 2007), while the
divorce rate increased (remaining, on average, around 1). To sum up, the eligible
counties present an increase in the number of new firms, in the purchasing power and in
the divorce rate. In contrast, population in these regions does not increase, and the child
birth rate decreases.
The non-eligible counties are also associated with an increase in the number of new
firms. The average number of new firms per county is 5.07 between the period 1997 and
1999, 7.70 in the period between 2000 and 2004, and 8.80 between 2005 and 2007. In
these regions we see that population, population density and purchasing power have
increased in the period after the introduction of the policy. Regarding the
15
policy, the child birth rate decreased (before the introduction of the policy it was 10.91
and after decreased to 10.74 between 2000 and 2004, and to 9.94 between 2005 and
2007), while the divorce rate increased (was, on average, 1 and after the policy
increased to 2). Thus, the non-eligible counties present an increase in the number of new
firms, population, population density, purchasing power and in the divorce rate, while
16 5. Empirical Methodology and Results
In this section, we evaluate the impact of the policy of tax benefits for inland regions on
firm entry and on the regional socio-demographic characteristics. For this, we use a
difference-in-differences approach. The idea is to compare outcomes in counties in
which the tax benefits policy is introduced to counterfactuals which are formed by
observed outcomes in non-eligible counties prior and after the policy.
5.1. Firm Entry
To evaluate if the policy increases firm entry, we start by analyzing the full sample of
269 counties at different stages of the policy. Next, we reduce our sample to
neighboring counties (75 counties) and to counties which distant themselves less than
20 Km (41 counties) (see Figure 2 and 3). From the analysis we exclude the years 2000
and 2005 because they coincide with the years of the introduction of the policy.
Let 𝐸𝑖𝑚𝑦 be the number of newly formed firms, measured as logarithm, in county i at month m and year y. We assess the impact of tax benefits using the following equation:
𝐸𝑖𝑚𝑦 = 𝛿𝑚+ 𝜔𝑦+ 𝜌𝑖 + 𝛽𝑃𝑜𝑙𝑖𝑐𝑦𝑖𝑦+ 𝑋′𝑖𝑦+ 𝜀𝑖𝑚𝑦
where i denotes county, y is entry year and m is entry month.
Our variable of interest is 𝑃𝑜𝑙𝑖𝑐𝑦𝑖𝑦. It is a dummy variable equaling one for the eligible
counties after the tax benefit policy is implemented, and zero otherwise.
We also include a vector of counties characteristics, 𝑋′𝑖𝑦 to control for regional
characteristics. We add county’s population and population density, measured on
logarithms, purchasing power and one-stop shop dummy, which equals one if the
17
purchasing power controls for richer counties, population and population density
because entrepreneurs create more firms where there is more population. One-stop shop
controls for other policies which affect the creation of new firms.
Our specification includes county, year and month dummies to control for region, year
and monthly fixed effects. 𝛿𝑚 are month dummy variables, 𝜔𝑦are year dummies
covering the period from 1997 until 2007 and 𝜌𝑖 are county dummies. The standard
errors are clustered at the county level.
Table 2 presents the results for the specification (1) using all 269 counties and Table 3
presents the results for the specification (1) using the restricted sample.
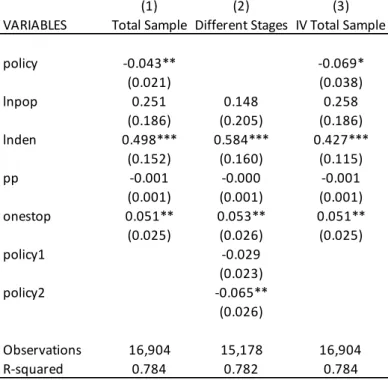
The introduction of the policy reduced the number of new firms in 4.3% (Column 1 of
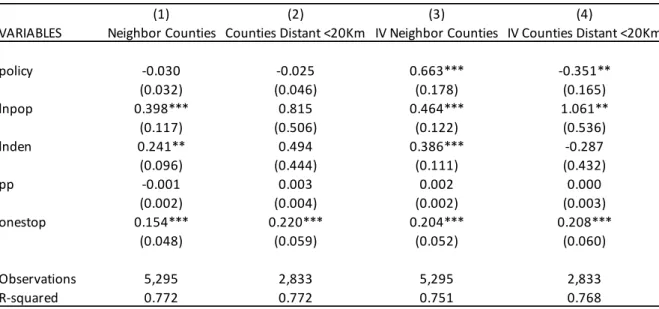
Table 2). When we restrict the sample to neighbor counties and counties which distant
less than 20 Km, we find that this number reduced to 3% and 2.5%, respectively, but
these coefficients lose statistical significance (Column 1 and 2 of Table 3). This
negative relationship between the dependent variable and our variable of interest leads
us to reject our Hypothesis 1 that suggest that the policy of tax benefits to inland areas increases firm entry.
In terms of controls, we find that population density and one-stop shop influence the
entry of new firms. The counties with more population density create more 49.8% firms
and the one-stop shop increased firm entry by 5.1% (Column 1 of Table 2). When we
restrict our sample to neighbor counties these values change to 24.1% and 15.4%,
respectively (Column 1 of Table 3). In the counties that distant less than 20 Km, only
the one-stop shop have a positive impact (Column 2 of Table 3).
Since the policy vary along the years, we divided our data into three periods: 1997 and
1999, where the policy was not implemented; 2000 and 2004, where the policy was
18
the corporate tax rate further decreased to 15%. During the same period, the corporate
tax rate faced by new firms in non-eligible counties was 32% for 2000 and 2001, 30%
for 2002 and 2003, and 25% between 2004 and 2007.
Our baseline specification changes to:
𝐸𝑖𝑚𝑦 = 𝛿𝑚+ 𝜔𝑦+ 𝜌𝑖 + 𝛽1𝑃𝑜𝑙𝑖𝑐𝑦1𝑖𝑦+ 𝛽2𝑃𝑜𝑙𝑖𝑐𝑦2𝑖𝑦+ 𝑋′𝑖𝑦+ 𝜀𝑖𝑚𝑦
In this case, 𝑃𝑜𝑙𝑖𝑐𝑦1𝑖𝑦 is a dummy variable equaling one for the eligible counties and
years when the corporate tax rate applied to new firms was of 20% and zero otherwise.
𝑃𝑜𝑙𝑖𝑐𝑦2𝑖𝑦 is a dummy variable equaling one for the eligible counties and years when
the corporate tax rate reduced to 15% and zero otherwise.
The results for the specification (2) are presented in Column (2) of Table 2. Once again,
the results show a negative relationship between the dependent variable and our
variables of interest. The coefficient associated with 𝑃𝑜𝑙𝑖𝑐𝑦1𝑖𝑦 is negative and not
statistically significant, while the one associated with 𝑃𝑜𝑙𝑖𝑐𝑦2𝑖𝑦 is -0.065 which suggest
that the second time that tax benefits were introduced, the number of new firms reduced
by 6.5%. Thus, we do not find support for Hypothesis 1 which stated that the policy of tax benefits to inland areas increases firm entry.
Once again, we find that the population density and the one-stop shop influence the
entry of new firms. The counties with higher population density create more 58.4%
firms and the one-stop shop increased firm entry by 5.3%.
The error term in the previous model could be endogenous, because it is correlated with
our explanatory variable, Policy, and this creates a bias problem. We will then apply an
instrumental variable estimation. We assume that the policy was implemented to favor
19
reason, we introduce an instrumental variable, 𝑍𝑖𝑦, which is equal to one for the
counties whose mayor is from PSD, and zero otherwise.
Column (3) of Table 2 and Column (3) and (4) of Table 3 present the results for
specification (1) using our instrumental variable.
We find that the introduction of the policy reduces the number of new firms by 6.9%.
When we restrict the sample to counties which distant less than 20 Km this number
changes to -35.1%. On the other hand, we notice that for neighbor counties, with the
introduction of the policy, the number of new firms increased 66.3%.
5.2. Regional Socio-Demographic Characteristics
In the following sections we test the impact of the policy on two regional demographic
characteristics: child birth rate and divorce rate, using the following equation:
𝑌𝑖𝑦= 𝜔𝑦+ 𝜌𝑖 + 𝛽𝑃𝑜𝑙𝑖𝑐𝑦𝑖𝑦+ 𝑋′𝑖𝑦+ 𝜀𝑖𝑦
where i denotes the county and y is the year.
First, we evaluate child birth rate measured as number of live births occurred during a
year over the average population of that period. This measure is expressed in number of
live births per 1000 inhabitants.
As mentioned before, our variable of interest is 𝑃𝑜𝑙𝑖𝑐𝑦𝑖𝑦, a dummy variable equaling
one if the policy is implemented in county i and year y, and zero otherwise. 𝑋′𝑖𝑦 includes regional control variables (population and population density, measured as
logarithm, and purchasing power).
As noted on Hypothesis 2 we expect the number of child births to increase on the regions that had access to tax benefits.
20
Table 4 presents the results for the specification (3) using all 269 counties and Table 5
presents the results for the specification (3) using the restricted sample.
The coefficient associated with 𝑃𝑜𝑙𝑖𝑐𝑦𝑖𝑦 is negative and it is not statistically significant.
But, when we restrict the sample to neighbor counties and counties which distant less
than 20 Km, we find that the introduction of the policy increased the child birth rate in
0.154 and 0.323, respectively. This leads us to accept our Hypothesis 2 that suggested that the policy of tax benefits to inland regions would lead to an increase on child birth
rates.
In terms of controls, we find that both population and purchasing power have a positive
influence on the child birth rate, while the population density exercise a negative effect.
In the counties with more population we see an increase of the child birth rate of 6.077
and the ones with more purchasing power increase it by 0.016. When we restrict our
sample to the counties which distant less than 20 Km, these values change to 5.055 and
0.025, respectively. In the neighbor counties, we also see that the ones with more
purchasing power increase the child birth rate by 0.024 and the ones with more
population density increase it 0.190.
Column (2) of Table 4 presents the results for specification (2) considering three time
periods and by substituting the variable 𝑃𝑜𝑙𝑖𝑐𝑦𝑖𝑦 with two variables: 𝑃𝑜𝑙𝑖𝑐𝑦1𝑖𝑦 and
𝑃𝑜𝑙𝑖𝑐𝑦2𝑖𝑦 as in specification (2). The coefficient associated with 𝑃𝑜𝑙𝑖𝑐𝑦1𝑖𝑦 is -0.098,
which suggest that the first time that tax benefits were introduced, the child birth rate
decreased by 0.098, while the coefficient associated with 𝑃𝑜𝑙𝑖𝑐𝑦2𝑖𝑦 is 0.104, which
suggest that the second time that tax benefits were introduced, the child birth rate
21
In this equation, we find once again that, in terms of controls, both population and
purchasing power have a positive influence on the child birth rate, while the population
density has a negative effect. The counties with more population increased by 6.739 the
child birth rate and the ones with more purchasing power increased it by 0.015.
Column (3) of Table 4 and Column (3) and (4) of Table 5 presents the results for
specification (3) using our instrumental variable.
The introduction of the policy negatively impact the child birth rate, but with the
introduction of our instrumental variable this coefficient turns statistically significant to
0.310. When we restrict our sample to counties that distant less than 20 Km this
coefficient changes to -0.412, while for neighbor counties this value remains positive
but it is not statistically significant. This leads us to reject our Hypothesis 2.
Next, we evaluate the impact of the policy on the divorce rate, measured as the number
of divorces observed during a year, over to the average population of that period. This
measure is expressed by the number of divorces per 1000 inhabitants. As in the previous
specifications, 𝑃𝑜𝑙𝑖𝑐𝑦𝑖𝑦 is the main variable for this analysis. The vector 𝑋′𝑖𝑦 represents
the counties characteristics, namely population and population density, measured as
logarithm, and purchasing power.
As noted on Hypothesis 3 we expect the number of divorces to increase in the regions that had access to tax benefits.
The results are presented in Table 6, using all 269 counties and in Table 7, using the
restricted sample.
The introduction of the policy reduced the divorce rate by 2.4%. When we restrict the
sample to neighbor counties and counties which distant less than 20 Km, we find that
22
variable and our variable of interest leads us to reject our Hypothesis 3 that suggest that the policy of tax benefits to inland areas increases the divorce rate.
In terms of controls, we find that population, population density and purchasing power
have a positive influence on the divorce rate. The counties with more population
increase the divorce rate by 1.033, the ones with more population density increase the
rate by 0.661 and the counties with more purchasing power increase by 0.007 the
divorce rate. When we restrict our sample to the counties that distant less than 20 Km
we see that, regarding population density and purchasing power, these values increase to
0.883 and 0.009, respectively. In the neighbor counties, only the purchasing power have
a positive impact of 0.004.
Again, Column (2) of Table 6 presents the results for specification (2) considering three
time periods and by substituting the variable 𝑃𝑜𝑙𝑖𝑐𝑦𝑖𝑦 with two variables: 𝑃𝑜𝑙𝑖𝑐𝑦1𝑖𝑦
and 𝑃𝑜𝑙𝑖𝑐𝑦2𝑖𝑦 as in specification (2). The coefficient associated with 𝑃𝑜𝑙𝑖𝑐𝑦1𝑖𝑦 is
-0.081, which suggest that the first time that tax benefits were introduced, the divorce
rate reduced by 8.1%, while the coefficient associated with 𝑃𝑜𝑙𝑖𝑐𝑦2𝑖𝑦 is 0.099, which
suggest that the second time that tax benefits were introduced, the divorce rate increased
by 9.9%. Thus, we do not find support for Hypothesis 3 (which stated that the policy of tax benefits to inland areas increases the divorce rate) in the first stage of the policy but
in the second stage we accept it.
In this equation, we find once again that, in terms of controls, population, population
density and purchasing power have a positive influence on the divorce rate. The
counties with more population increase the divorce rate by 1.634, the ones with more
population density increase this rate by 0.350 and the ones with more purchasing power
23
Again, Column (3) of Table 5 and Columns (3) and (4) of Table 7 present the results for
specification (3) using our instrumental variable.
Once again we find that the introduction of the policy have a negative impact on the
divorce rate, in this case, of 0.372. When we restrict our sample to counties that distant
less than 20 Km this value changes to -0.513, while for neighbor counties this value
becomes positive but it is not statistically significant. This leads us to the same
conclusion as before, rejecting our Hypothesis 3.
In terms of controls, we find again that counties with more population and purchasing
power have more divorces, but in the ones with higher population density the divorce
rate decreases. When we restrict our sample to neighbor counties we see that, as before,
the counties with more purchasing power have more divorces, and we notice in this case
that also the counties with higher population density have more divorces. In the counties
which distant less than 20 Km, we notice that as before the population density and
purchasing power continue to have a positive impact on the divorce rate, but the values
24 6. Conclusion
The aim of our study was to analyze the effect of a policy of tax benefits to inland areas
in Portugal between the period of 1997 until 2007. Specifically, we analyzed the effect
of this policy on firm entry and on child birth rate and divorce rate.
Through the literature review, it was found that the majority of the studies argue that the
tax reductions contribute to the entry of new firms. To contribute for this discussion, we
analyzed the Portuguese case by comparing a set of inland eligible regions with
non-eligible regions.
We found that the policy does not have a positive effect on the entry of new firms, nor
on the child birth and divorce rate. This is not consistent with our hypotheses. The
negative effect on firm entry persists even when we divide our sample into the different
stages of the policy introduction. These results are not consistent in restricted samples
(nearby counties). As the policy was implemented in regions economically less
developed, our results suggest that the tax benefits were not enough to promote
entrepreneurial activity nor the development of a region. Also, these results can be
explained by the inconsistency of fiscal policies.
Giving this results, governments should find ways to attract new entrepreneurs,
domestic and foreign, to invest in the less developed regions. To do so, it is necessary a
long-term plan which involves an investment on infrastructures capable of offering
good conditions to entrepreneurs to develop their investments and conditions of fixing
the population in these territories.
This study could be further developed by analyzing other county variables, like the
number of schools or hospitals, the crime rate and using an economic variable like the
25
characteristics was unavailable. It would also be useful to study similar fiscal policies
that encourage entrepreneurship.
26 References
Adserà, A. (2004). Changing Fertility Rates in Developed Countries. The Impact of
Labor Market Institutions. Journal of Population Economics, 17, 17-43.
Ardagna, S. and Lusardi, A. (2008). Explaining International Differences In
Entrepreneurship: The Role of Individual Characteristics and Regulatory Constraints.
NBER Working Paper No. 14012, May.
Bacher, H. U. and Brülhart, M. (2013). Progressive taxes and firm births. International Tax Public Finance, 20, 129-168.
Baliamoune-Lutz, M. and Garello, P. (2013). Tax structure and entrepreneurship. Small Business Economics, January.
Barros, V. M. S. (2016). Three Essays On Corporate Taxation: Financial Reporting,
Value, and Firm Creation. Doctoral Thesis in Management, University of Lisbon –
Lisbon School of Economics & Management, pp. 231.
Block, L. (2016). Corporate income taxes and entrepreneurship. IZA DP No. 257, May.
Branstteter, L., Lima, F., Taylor, L. J. and Venâncio, A. (2013). Do Entry Regulations
Deter Entrepreneurship and Job Creation? Evidence from Recent Reforms in Portugal.
27
Bruce, D. and Deskins, J. (2012). Can state tax policies be used to promote
entrepreneurial activity?. Small Business Economics, 38, 375-397.
Bruce, D. and Mohsin, M. (2006). Tax Policy and Entrepreneurship: New Time Series
Evidence. Small Business Economics, 26, 409-425.
Bruhn, M. and McKenzie, D. (2013). Using Administrative Data to Evaluate Municipal
Reforms – An Evaluation of the Impact of Minas Fácil Expresso. Policy Research Working Paper No. 6368.
Carree, M. A. and Thurik, A. R. (2010). The Impact of Entrepreneurship on Economic
Growth.
Cullen, J. B. and Gordon, R. H. (2007). Taxes and entrepreneurial risk-taking: Theory
and evidence for the U.S. Journal of Public Economics, 91, 1479-1505.
Da Rin, M., Di Giacomo, M. and Sembenelli, A. (2010). Corporate Taxation and the
Size of New Firms: Evidence from Europe. Journal of the European Economic Association, 8(2-3), 606-616.
Da Rin, M., Di Giacomo, M. and Sembenelli, A. (2011). Entrepreneurship, firm entry,
28
De Mooij, R. A. and Nicodeme, G. (2010). Corporate Tax Policy, Entrepreneurship and
Incorporation in the EU. CESifo Working Paper No. 1883.
Djankov, S., Ganser, T., McLiesh, C., Ramalho, R. and Shleifer, A. (2010). The Effect
of Corporate Taxes on Investment and Entrepreneurship. NBER Working Paper Series No. 13756, January.
Egger, P., Keuschnigg, C. and Winner, H. (2008). Incorporation and Taxation: Theory
and Firm-level Evidence. Working Paper No. 2008-20, September.
Fernandes, A. B., Dinis, A. and Ussmane, A. M. (2011). O Impacto dos Incentivos Fiscais Regionais na Taxa de Criação de Empresas: Estudo Aplicado às Regiões Portuguesas do Interior.
Fölster, S. (2002). Do Lower Taxes Stimulate Self-Employment?. Small Business Economics, 19, 135-145.
Fossen, F. M. (2008). Would a flat tax stimulate entrepreneurship in Germany? A
behavioral microsimulation analysis allowing for risk. Working Paper No. 773, April.
Fossen, F. M. and Steiner, V. (2009). Income taxes and entrepreneurial choice:
29
Fritsch, M. (2008). How does new business formation affect regional development?
Introduction to the special issue. Small Business Economics, 30, 1-14.
Galor, O. and Weil, D. N. (1996). The Gender Gap, Fertility, and Growth. The American Economic Review, Volume 86, No. 3, 374-387.
Gentry, W. M. and Hubbard, R. G. (2000). Tax Policy and Entrepreneurial Entry. The American Economic Review, Volume 90, No. 2, 283-287.
Gentry, W. M. and Hubbard, R. G. (2005). “Success Taxes”, Entrepreneurial Entry, and
Innovation. NBER Working Paper Series No. 10551, June.
Hall, J. C. and Sobel, R. S. (2006). Public Policy and Entrepreneurship.
Hansson, A. (2012). Tax policy and entrepreneurship: empirical evidence from Sweden.
Small Business Economics, 38, 495-513.
Hubert, F. and Pain, N. (2002). Fiscal Incentives, European Integration and the Location
of Foreign Direct Investment. The Manchester School, Volume 70, No. 3, June.
Jalovaara, M. (2003). The joint effects of marriage partners’ socioeconomic positions on
the risk of divorce. Demography, Volume 40 – Number 1, 67-81.
30
Kneller, R. and McGowan, D. (2012). Tax Policy and Firm Entry and Exit Dynamics:
Evidence from OECD Countries. Bangor Business School Working Paper.
Luna, L. and Murray, M. N. (2010). The Effects of State Tax Structure on Business
Organizational Form. National Tax Journal, 63 (1, Part 2), 995-1022.
Mintz, J. M. and Andersen, A. (1992). Is there a future for capital income taxation?.
OECD Economics Department Working Papers No. 108.
Parker, S. C. (2005). Explaining Regional Variations in Entrepreneurship as Multiple
Occupational Equilibria. Journal of Regional Science, Volume 45, No. 4, 829-850.
Parker, S. C. (2009). The Economics of Entrepreneurship. Cambridge University Press.
Rathelot, R. and Sillard, P. (2008). The Importance of Local Corporate Taxes in
Business Location Decisions: Evidence from French Micro Data. The Economic Journal, 118, 499-514.
Rupert, P. (2008). Frontiers of Family Economics – Volume 1, 1st Ed. UK: Emerald Group Publishing Limited.
31
Sequeira, T. and Sá, F. (2008). Benefícios Fiscais ao Serviço do Desenvolvimento Regional? O Caso do Distrito de Vila Real, no Norte Interior Português.
South, S. J. (1985). Economic Conditions and the Divorce Rate: A Time-Series
Analysis of the Postwar United States. Journal of Marriage and Family, Volume 47, No. 1, 31-41.
Trent, K. and South, S. J. (1989). Structural Determinants of the Divorce Rate: A
Cross-societal Analysis. Journal of Marriage and Family, Volume 51, No. 2, 391-404.
Tzeng, J. M. and Mare, R. D. (1995). Labor Market and Socioeconomic Effects on
Marital Stability. Social Science Research, Volume 24, 329-351.
Wasylenko, M. J. (1997). Taxation and economic development: the state of the
economic literature. New England Economic Review, pp. 37-52.
Weiss, Y. (1997). The Formation and Dissolution of Families: Why Marry? Who
Marries Whom? And What Happens Upon Divorce? Handbook of Population and Family Economics.
Wooldridge, J. M. (2002). Introductory Econometrics – A Modern Approach, 2nd Ed. S.I.: South-Western Publishing Co..
32
Figure 1 – Corporate Tax Rate Applied to New Firms (1997-2007; %)
33 Figure 2 – Neighbor Counties
Source: Oficio-Circulado 147, 30/03/2001 – Direcção de Serviços do IRC
Notes: In red are the counties which were not included in our analysis, in green are the
34
Figure 3 – Counties which distant themselves less than 20 Km
Source: Oficio-Circulado 147, 30/03/2001 – Direcção de Serviços do IRC and
http://www.adistanciaentre.com/
Notes: In red are the counties which were not included in our analysis, in blue are the
counties which distant less than 20 Km from the eligible counties, represented in
35 Table 1: Descriptive Statistics
Panel A – Eligible Firms
Panel B – Non-Eligible Firms
This table reports descriptive statistics for firms established between 1997 and 2007,
and respective firms’ and counties’ characteristics for eligible and non-eligible counties.
All data was retrieved from QP- Quadros de Pessoal. Before
Between 1997 and 1999 Between 2000 and 2004 Between 2005 and 2007
Obs. Mean S.D. Obs. Mean S.D. Obs. Mean S.D.
Number of new firms 5976 .8534137 1.964607 9960 1.334137 3.846095 5976 1.406627 4.158248
Population 5976 14192.99 13227.75 9960 14141.79 13631.82 5976 14084.15 13922.77
Population density 5976 53.57193 48.39772 9960 52.75853 50.25605 5976 52.55518 50.71003
Purchasing Power 5976 53.81201 14.68121 9960 58.56931 14.19542 5976 64.26418 14.91044
Birth rate 5976 8.569277 2.206856 9960 8.173133 2.161526 5976 7.334337 1.900287
Divorce rate 5976 .8355422 .4943887 9960 1.31012 .6609334 5976 1.486546 .6879912
After
Before
Between 1997 and 1999 Between 2000 and 2004 Between 2005 and 2007
Obs. Mean S.D. Obs. Mean S.D. Obs. Mean S.D.
Number of new firms 3708 5.066073 10.58898 6180 7.698382 18.25849 3708 8.800971 23.85019
Population 3708 66866.86 81195.85 6180 69010.41 80795.92 3708 70833 80801.53
Population density 3708 649.2549 1345.6 6180 667.1497 1268.832 3708 671.6234 1248.95
Purchasing Power 3708 82.99133 36.49837 6180 86.19225 31.98699 3708 91.1121 27.30462
Birth rate 3708 10.91197 2.238992 6180 10.73825 1.976975 3708 9.941424 1.967694
Divorce rate 3708 1.425243 .6612716 6180 2.085825 .8091 3708 2.20356 .701148
36
Table 2: Impact of the Policy of Tax Benefits for Inland Areas on Firm Entry – Total Sample
Notes: The table reports estimated coefficients for equation (1) and (2). The dependent variable is the logarithm of newly formed firms. Region, month and year fixed effects are included but not reported. Standard errors clustered at the county level are in parentheses. *** p<0.01, ** p<0.05, * p<0.1.
(1) (2) (3)
VARIABLES Total Sample Different Stages IV Total Sample
policy -0.043** -0.069*
(0.021) (0.038)
lnpop 0.251 0.148 0.258
(0.186) (0.205) (0.186)
lnden 0.498*** 0.584*** 0.427***
(0.152) (0.160) (0.115)
pp -0.001 -0.000 -0.001
(0.001) (0.001) (0.001)
onestop 0.051** 0.053** 0.051**
(0.025) (0.026) (0.025)
policy1 -0.029
(0.023)
policy2 -0.065**
(0.026)
Observations 16,904 15,178 16,904
37
Table 3: Impact of the Policy of Tax Benefits for Inland Areas on Firm Entry – Restricted Sample
Notes: The table reports estimated coefficients for equation (1). The dependent variable is the logarithm of newly formed firms. Region, month and year fixed effects are included but not reported. Standard errors clustered at the county level are in parentheses. *** p<0.01, ** p<0.05, * p<0.1.
(1) (2) (3) (4)
VARIABLES Neighbor Counties Counties Distant <20Km IV Neighbor Counties IV Counties Distant <20Km
policy -0.030 -0.025 0.663*** -0.351**
(0.032) (0.046) (0.178) (0.165)
lnpop 0.398*** 0.815 0.464*** 1.061**
(0.117) (0.506) (0.122) (0.536)
lnden 0.241** 0.494 0.386*** -0.287
(0.096) (0.444) (0.111) (0.432)
pp -0.001 0.003 0.002 0.000
(0.002) (0.004) (0.002) (0.003)
onestop 0.154*** 0.220*** 0.204*** 0.208***
(0.048) (0.059) (0.052) (0.060)
Observations 5,295 2,833 5,295 2,833
38
Table 4: Impact of the Policy of Tax Benefits for Inland Areas on Regional Socio-Economic Activity (Child Birth Rate) – Total Sample
Notes: The table reports estimated coefficients for equation (3) and (4). The dependent variable is the child birth rate. Region and year fixed effects are included but not reported. Standard errors clustered at the county level are in parentheses. *** p<0.01, ** p<0.05, * p<0.1.
(1) (2) (3)
VARIABLES Total Sample Different Stages IV Total Sample
policy -0.028 -0.310***
(0.035) (0.054)
lnpop 6.077*** 6.739*** 6.143***
(0.279) (0.325) (0.278)
lnden -1.868*** -2.152*** -2.645***
(0.209) (0.222) (0.136)
pp 0.016*** 0.015*** 0.016***
(0.001) (0.001) (0.001)
policy1 -0.098***
(0.034)
policy2 0.104**
(0.044)
Observations 32,280 29,052 32,280
39
Table 5: Impact of the Policy of Tax Benefits for Inland Areas on Regional Socio-Economic Activity (Child Birth Rate) – Restricted Sample
Notes: The table reports estimated coefficients for equation (3). The dependent variable is the child birth rate. Region and year fixed effects are included but not reported. Standard errors clustered at the county level are in parentheses. *** p<0.01, ** p<0.05, * p<0.1.
(1) (2) (3) (4)
VARIABLES Neighbor Counties Counties Distant <20Km IV Neighbor Counties IV Counties Distant <20Km
policy 0.154*** 0.323*** 0.230 -0.412**
(0.049) (0.074) (0.242) (0.209)
lnpop -0.158 5.055*** -0.166 5.218***
(0.141) (0.672) (0.140) (0.696)
lnden 0.190* -2.182*** 0.220 -3.635***
(0.114) (0.575) (0.134) (0.553)
pp 0.024*** 0.025*** 0.025*** 0.015***
(0.003) (0.005) (0.004) (0.004)
Observations 9,000 4,920 9,000 4,920
40
Table 6: Impact of the Policy of Tax Benefits for Inland Areas on Regional Socio-Economic Activity (Divorce Rate) – Total Sample
Notes: The table reports estimated coefficients for equation (3) and (4). The dependent variable is the divorce rate. Region and year fixed effects are included but not reported. Standard errors clustered at the county level are in parentheses. *** p<0.01, ** p<0.05, * p<0.1.
(1) (2) (3)
VARIABLES Total Sample Different Stages IV Total Sample
policy -0.024* -0.372***
(0.012) (0.021)
lnpop 1.033*** 1.634*** 1.115***
(0.119) (0.137) (0.117)
lnden 0.661*** 0.350*** -0.301***
(0.094) (0.100) (0.053)
pp 0.007*** 0.007*** 0.008***
(0.000) (0.000) (0.000)
policy1 -0.081***
(0.013)
policy2 0.099***
(0.017)
Observations 32,280 29,052 32,280
41
Table 7: Impact of the Policy of Tax Benefits for Inland Areas on Regional Socio-Economic Activity (Divorce Rate) – Restricted Sample
Notes: The table reports estimated coefficients for equation (3). The dependent variable is the divorce rate. Region and year fixed effects are included but not reported. Standard errors clustered at the county level are in parentheses. *** p<0.01, ** p<0.05, * p<0.1.
(1) (2) (3) (4)
VARIABLES Neighbor Counties Counties Distant <20Km IV Neighbor Counties IV Counties Distant <20Km
policy -0.085*** -0.070*** 0.112 -0.513***
(0.017) (0.027) (0.119) (0.083)
lnpop -0.035 0.031 -0.054 0.129
(0.059) (0.268) (0.056) (0.288)
lnden 0.034 0.883*** 0.112* 0.007
(0.053) (0.230) (0.058) (0.231)
pp 0.004*** 0.009*** 0.005*** 0.003
(0.001) (0.002) (0.001) (0.002)
Observations 9,000 4,920 9,000 4,920
42
Appendix A – Laws and Legal Documents on the Tax benefits to Inland Regions
(1997-2007)
Law nr. 127-B/97, of 20/9 (Lei n.º 127-B/97, de 20de Dezembro de 1997 – I Série A),
Legislative authorization for the government (PS) create a system of fiscal incentives
for the micro and samll firms.
Projeto de Lei 522/VII, Legislative initiative of PSD over the legislative authorization
above.
Law nr. 171/99, of 18/9 (Lei n.º 171/99, de 18 de Setembro de 1999), Combating
desertification and recovery of development in inland areas.
Ofício-Circulado 147, 30 de Março de 2001, Definition of eligible counties and
eligibility criteria.
Portaria 2086/2001, 13 de Dezembro de 2001 – II Série, Definition of eligible counties
and eligibility criteria (equal to OF 147/2001).
Portaria 1467-A/2001, 31 de Dezembro de 2001 – I Série B, Definition of eligible
counties and eligibility criteria (equal to OF 147/2001 and Portaria 2086/2001).
Law nr. 53-A/2006 (Lei n.º 53-A/2006, de 29 de Dezembro de 2006 – Série I nº249),
43
Law nr. 67-A/2007 (Lei n.º 67-A/2007, de 31 de Dezembro de 2007), Definition of the
44
Appendix B – Eligible Counties Associated with the Tax Benefits to Inland Regions
Table B1: Eligible Counties
NUTS III Counties
Alto Trás-os-Montes Alfândega da Fé Boticas
Bragança Chaves
Macedo de Cavaleiros Miranda do Douro Mirandela
Mogadouro Montalegre Murça Valpaços
Vila Pouca de Aguiar Vimioso
Vinhais
Ave Póvoa de Lanhoso
Vieira do Minho
Cávado Amares
Terras de Bouro
Vila Verde
Douro Alijó
Armamar
Carrazeda de Ansiães Freixo de Espada à Cinta Lamego
Mesão Frio
Moimenta da Beira Penedono
Peso da Régua Sabrosa
Santa Marta de Penaguião São João da Pesqueira Sernancelhe
Tabuaço Tarouca
Torre de Moncorvo Vila Flôr
Vila Nova de Foz Côa
Vila Real
Entre Douro e Vouga Arouca
45 Caminha Melgaço Monção
Paredes de Coura Ponte da Barca Ponte de Lima Valença
Viana do Castelo
Vila Nova de Cerveira
Tâmega Baião
Cabeceiras de Basto Castelo de Paiva Celorico de Basto Cinfães
Mondim de Basto Resende
Ribeira de Pena
Baixo Mondego Penacova Beira Interior Norte Almeida
Celorico da Beira
Figueira de Castelo Rodrigo Guarda Manteigas Meda Pinhel Sabugal Trancoso
Beira Interior Sul Castelo Branco Idanha-a-Nova Penamacor
Vila Velha de Rodão
Cova da Beira Belmonte Covilhã
Fundão
Dão-Lafões Aguiar da Beira Carregal do Sal Castro Daire Mangualde Mortágua Nelas
46 Tondela
Vila Nova de Paiva Viseu
Vouzela
Pinhal Interior Norte Alvaiázere Ansião Arganil
Castanheira de Pêra Figueiró dos Vinhos Góis
Lousã
Miranda do Corvo
Oliveira do Hospital Pampilhosa da Serra Pedrogão Grande
Penela Tábua
Vila Nova de Poiares
Pinhal Interior Sul Mação Oleiros
Proença-a-Nova Sertã
Vila de Rei
Serra da Estrela Fornos de Algodres Gouveia
Seia
Médio Tejo Ferreira do Zêzere
Sardoal
Lezíria do Tejo Chamusca Alentejo Central Alandroal
Arraiolos Borba Estremoz Évora Montemor-o-Novo Mourão Portel Redondo
Reguengos de Monsarás Sousel
Vendas Novas Viana do Alentejo
Vila Viçosa
47 Santiago do Cacém
Sines
Alto Alentejo Alter do Chão Arronches Avis
Campo Maior Castelo de Vide Crato Elvas Fronteira Gavião Marvão Monforte Mora Nisa
Ponte de Sor
Portalegre
Baixo Alentejo Aljustrel Almodôvar Alvito Barrancos Beja Castro Verde Cuba
Ferreira do Alentejo Mértola
Ourique Serpa
Vidigueira
Algarve Alcountim
Aljezur Castro Marim Monchique
São Brás de Alportel Vila do Bispo
Vila Real de Santo António