Accounts: a Social Accounting Matrix for Portugal.
Susana Santos
Technical University of Lisbon
Institute of Economics and Business Administration (ISEG – Instituto Superior de Economia e Gestão) Department of Economics
Research Unit on Complexity and Economics
Rua Miguel Lupi, 20, 1200-781 Lisboa, Portugal,
Tel. 351 21 392 59 53
Fax: 351 21 392 28 08
E-mail: [email protected].
Abstract
Based on the country's National Accounts, an aggregate Social Accounting Matrix (SAM) will be
constructed for the Portuguese economy. The full consonance between the two will be demonstrated
by identifying both the items and balances of the various internal accounts of the System of
National Accounts in the constructed SAM. The balance of the government budget and the balance
of payments will also be identified.
Blocks of sub-matrices with common characteristics will be identified and described in terms of the
national accounting transactions that are included in each of them.
The SAM will be shown as a complete account of the circular flow in the economy and possible
disaggregations will be explored in order to construct a database for economic modelling. From the
Pilot-SAM for Portugal, the focus on households and employment will be specified in order to
construct a database for a SAM-based CGE model with the aim of studying income distribution in
Portugal.
Key words: Social Accounting Matrix; National Accounts; Economic Modelling
JEL classification: C82; E61; C68
(Presented to the EcoMod2006 - International Conference on Policy Modeling, held in Hong Kong, China, on 29 June 2006)
CONTENTS
1. Introduction ... 1
2. The SAM as a complete account of the circular flow in the economy ... 2
3. Identifying the items and balances of the various internal accounts of the SNA in the aggregate SAM ... 6
4. Possible disaggregations ... 17
5. Identifying the main items of the Balance of Payments and the Government Budget ... 20
6. The SAM’s blocks of sub-matrices ... 21
6.1.Compensation of factors of production ... 23
6.2.Production ... 23
6.3.Intermediate Consumption ... 24
6.4.Gross Capital Formation ... 24
6.5.Net indirect taxes or net taxes on production and imports ... 25
6.6.Final Consumption ... 26
6.7.External Trade ... 27
6.8.Trade and Transport Margins ... 27
6.9.Current Transfers ... 28
6.10.Gross Saving ... 29
6.11.Capital Transfers ... 29
6.12.Net borrowing/lending ... 29
6.13.Financial Transactions ... 30
7. From a Macro SAM to a disaggregated SAM for the study of income distribution ... 31
8. Concluding remarks ... 37
References ... 38
Appendixes A. Portuguese National Accounts for 1995 (SNA Tables) ... 41
List of Tables
Table 1. Portuguese Basic SAM (Social Accounting Matrix) for 1995 (in millions of euros) ... 3
Table 2. Portuguese Basic NAM (National Accounting Matrix) for 1995 (in millions of euros)..16
Table 3. Portuguese Macro SAM (Social Accounting Matrix) for 1995 (in millions of euros) ... 18
Table 4. The Balance of Payments in the Portuguese SAM for 1995 (in millions of euros) ... 20
Table 5. The Government Budget in the Portuguese SAM for 1995 (in millions of euros) ... 20
Table 6. Basic SAM by blocks ... 22
Table 7. Portuguese Disaggregated SAM (Social Accounting Matrix) for 1995 for the study of income distribution (in millions of euros) ... 34
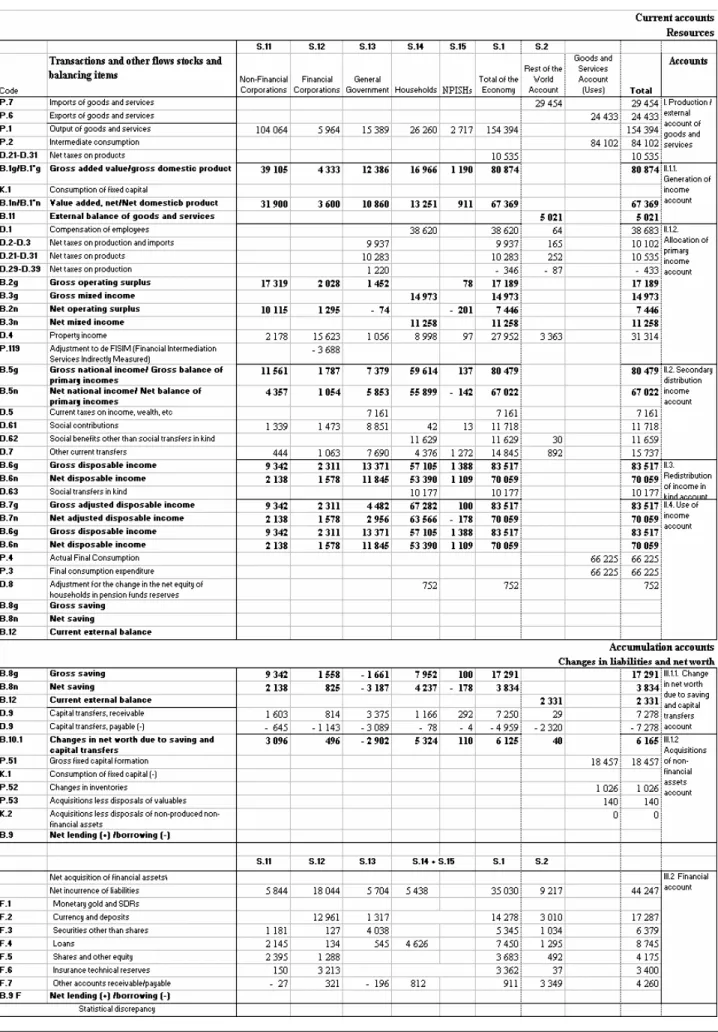
Appendix A. Portuguese National Accounts for 1995 (SNA Tables)
Table A.1a. Integrated Economic Accounts (in millions of euros) - Uses ... 41
Table A.1b. Integrated Economic Accounts (in millions of euros) - Resources ... 42
Table A.2.1a. Institutional Sector Accounts (in millions of euros) - (I) Production and (II.1.1.) Generation of Income Accounts (in millions of euros) – Uses ... 43
Table A.2.1b. Institutional Sector Accounts (in millions of euros) - (I) Production and (II.1.1.) Generation of Income Accounts (in millions of euros) – Resources ... 44
Table A.2.2a. Institutional Sector Accounts (in millions of euros) - (II.1.2.) Allocation of Primary Income and (II.2.) Secondary Distribution of Income Accounts (in millions of euros) – Uses ... 45
Table A.2.2b. Institutional Sector Accounts (in millions of euros) - (II.1.2.) Allocation of Primary Income and (II.2.) Secondary Distribution of Income Accounts (in millions of euros) – Resources ... 46
Table A.2.3a. Institutional Sector Accounts (in millions of euros) - (II.3.) Distribution of Income in Kind, (II.4.1.) Use of Disposable Income and (II.4.2.) Use of Adjusted Income Accounts (in millions of euros) – Uses ... 47
Table A.2.3b. Institutional Sector Accounts (in millions of euros) - (II.3.) Distribution of Income in Kind, (II.4.1.) Use of Disposable Income and (II.4.2.) Use of Adjusted Income Accounts (in millions of euros) – Resources ... 48
Table A.2.4a. Institutional Sector Accounts (in millions of euros) - (III) Accumulation Accounts (in millions of euros) – Changes in Assets ... 49
Table A.2.4b. Institutional Sector Accounts (in millions of euros) - (III) Accumulation Accounts (in millions of euros) – Changes in Liabilities and Net Worth ... 50
Table A.3b. Rest of the World Accounts (in millions of euros) – External Accumulation
Accounts (VIII) ... 52
Table A.4a. Supply of products at basic prices (current prices in millions of euros) – Output of goods and services by activities 01-24 ... 53
Table A.4b. Supply of products at basic prices (current prices in millions of euros) – Output of goods and services by activities 25-51 ... 54
Table A.4c. Supply of products at basic prices (current prices in millions of euros) – Output of goods and services by activities 52 - 85 ... 55
Table A.4d. Supply of products at basic prices (current prices in millions of euros) – Output of goods and services by activities 90-95 and Total Output; Imports of goods and services; Total supply at basic prices; Trade and transport margins; Taxes and subsidies on products; Total supply at purchasers’ prices ... 56
Table A.5a. Use of Products at purchasers’ prices (current prices in millions of euros) – Intermediate consumption by activities 01-26 ... 57
Table A.5b. Use of Products at purchasers’ prices (current prices in millions of euros) – Intermediate consumption by activities 27-61 ... 58
Table A.5c. Use of Products at purchasers’ prices (current prices in millions of euros) – Intermediate consumption by activities 62-100 ... 59
Table A.5d. Use of Products at purchasers’ prices (current prices in millions of euros) – Total intermediate consumption by activities; Final consumption; Gross Capital Formation; Exports of goods and services; Total uses at purchasers’ prices ... 60
Table A.6. “From whom to whom” matrices (in millions of euros) ... 61
Table A.7a. Description of codes and grouping of Products – Codes ... 62
Table A.7b. Description of codes and grouping of Products – Groups ... 63
Table A.8a. Description of codes and grouping of Activities – Codes ... 64
Table A.8b. Description of codes and grouping of Activities – Groups ... 65
Appendix B. Portuguese Pilot - National Accounting Matrix (NAM) for 1995 Table B.1. Aggregate Pilot – NAM (in millions of euros) ... 66
Table B.2.1. Disaggregated Pilot-NAM cells (in millions of euros) - Cell (1,6) Final Consumption ... 67
Table B.2.3. Disaggregated Pilot-NAM cells (in millions of euros)
– Cell (4,4) Property Income; Cell (5,4) Net National Income ... 69
Table B.2.4. Disaggregated Pilot-NAM cells (in millions of euros) – Cell (5,5) Current Transfers among Residents; Cell (6,5) Net Disposable Income ... 70
Table B.2.5. Disaggregated Pilot-NAM cells (in millions of euros) – Cell (7,6) Net Saving ... 71
Table B.3. Description of grouping of labour – male and female ... 71
1. Introduction
This paper is an improved version of the one entitled “Social Accounting Matrix and the System of
National Accounts: An Application” (Santos, 2005), presented at the training session of the 15th International Input-Output Conference, held in Beijing (China P.R.) a year ago. Some of the improvements resulted from comments and suggestions made by Professor Jeffery Round, whom
we should like to thank most profoundly for his help.
A Social Accounting Matrix (SAM) is a square matrix in which each transaction is recorded only
once in a cell of its own. As is conventionally agreed, the entries made in rows represent resources,
incomes, receipts or changes in assets, whilst, the entries made in columns represent uses, outlays,
expenditures or changes in liabilities and net worth. So, for each row there is a corresponding
column, with the totals of each of these being equal.These figures will include both production and
institutional accounts, which are subdivided into yet other accounts, defined in accordance with the
goal of the study and the available information. Thus, as will be seen in section 2, the SAM consists
of a data set of interrelated subsystems that, on the one hand, provide an analytical picture of the
circular flow or the general equilibrium interactions of the market economy studied in a particular
accounting period and, on the other hand, serve as an instrument for assessing the effects of changes
on the particular nominal flows represented by the matrix (injections and leakages in the system),
which might be the result of policy measures.
“A dictum usually attributed to Lord Keynes posits that every economic model has a corresponding
accounting framework. For macroeconomic models, this accounting framework must be complete
in the sense that every receipt must be offset by a corresponding expenditure. One consequence is
that all the transactions in a model can be expressed within a SAM framework. The values assumed
by all the different types of transactions can therefore be set out as the elements of a SAM” (Drud et
al., 1986). Section 3 shows that the accounting framework underlying the SAM may be the System
of National Accounts (SNA), with it also being possible to identify from the SAM all the macro
aggregates, as well as the main items of the balance of payments and the government budget, as is
done in section 5.
Therefore, the SAM provides a comprehensive and consistent accounting framework for developing
(more or less disaggregated) databases, which can be used for applied general equilibrium analysis.
Section 4 refers to the possible disaggregations within the SNA, and Section 7 illustrates the
particular case of a disaggregated SAM, constructed from sources other than the SNA for the study
of income distribution in Portugal. This objective obliged us to work with data that were more than
the work that we intend to carry out and of which this paper is one part (the other is a SAM-based
Computable General Equilibrium model) is seen as an experiment that has never previously been
undertaken for Portugal, and we hope to be able to demonstrate the importance and potentialities of
this activity.
Section 6 identifies and characterises in some detail those blocks of sub-matrices of the SAM that
have common characteristics, which will be very useful when the numeric SAM is converted, in a
modelling stage, into algebraic terms (not undertaken in this paper).
Section 8 ends the paper with some concluding remarks designed to emphasise the adequacy of the
SAM framework as a basis for economic modelling in general and for CGE models in particular,
backed by quotations from highly regarded specialists working in the area.
2. The SAM as a complete account of the circular flow in the economy
The taxonomy used in a SAM depends on the available data and the purposes of the study
underlying its construction. It is, however, fundamental for the success of any analysis, that there
should be a definition of an appropriate classification and a characterisation of the production and
institutional subsectors.
While being constantly concerned with adopting a mutually exclusive and, in a certain way,
exhaustive classification, the adopted disaggregation should respect, on the one hand, the functional
criterion, describing the production processes and pointing out the existing technical-economic
relationships between the various productive units and, on the other hand, it should respect the
institutional criterion, describing distribution, accumulation and financing activities, and showing
the relationships in economic behaviour. We therefore have "Production" divided into factors of
production, activities and products, and "Institutions" divided into current, capital and financial
accounts, as well as the "rest of the world" account.
In a general way, the order of the accounts does not obey any specific rule; it simply obeys the
criterion of the person who works with them. Our criterion for ordering the accounts was the one
Table 1. Portuguese Basic SAM (Social Accounting Matrix) for 1995 (in millions of euros) Production Institutions Outlays (expenditures) Incomes (receipts) Factors (1) Activities (2) Products (3) Current A. (4) Capital A. (5) Financial A. (6)
Rest of the World
(RW) (7)
TOTAL
Factors (1) 0
Gross Added Value,
at factor cost
(70 725)
0 0 0 0
Compensation of Factors from the
RW (3 243)
Aggregate Factors income
(73 968)
Activities (2) 0 0 Production
(154 394) 0 0 0 0
Production Value (154 394) Pr odu ction
Products (3) 0
Intermediate Consumption (84 102) Trade and Transport Margins (0) Final Consumption
(64 898)
Gross Capital Formation
(19 623)
0 Exports
(24 433)
Aggregate Demand (193 056)
Current A. (4) Income, Gross National at factor cost (70 542)
Net taxes on production
(-346)
Net taxes on products (10 283 )
Current Transfers
(42 145) 0 0
Current Transfers from the RW (3 960) Aggregate Income (126 583)
Capital A. (5) 0 0 0 Gross Saving
(17 291)
Capital Transfers (4930)
- Net borrowing (40) Capital Transfers from the RW (2 320) Investment Funds (24 582) In stitu tion s
Financial A.(6) 0 0 0 0 0
Financial Transactions
(35 030)
Financial Transactions from the RW
(9 257)
Total financial transactions
(44 287)
Rest of the World (RW) (7)
Compensation of Factors to the RW
(3 426)
Net taxes on production
(-87)
Imports + net taxes on
products (28 127 + 252)
Current Transfers to the RW
(2 249)
Capital Transfers to the RW
(29)
Financial Transactions to the
RW (9 217)
Transactions Value to the
RW (43 213) TOTAL Aggregate Factors income (73 968) Total Costs (154 394) Aggregate Supply (193 056) Aggregate Income (126 583) Aggregate Investment (24 582) Total financial transactions (44 287) Transactions Value from the
RW (43 213)
As far as the flows of money are concerned, the following outline shows us the connections that can
be established between the various accounts of the Basic SAM.
Outline 1: Flows of money between the Basic Portuguese SAM accounts
DOMESTIC ECONOMY
This outline “provides a schematic portrayal of the circular flow of income in the economy”
(Devarajan et al., 1991), representing all the transactions recorded by the SAM, within the
(domestic) economy and between it and the rest of the world. The latter transactions are represented
by the "rest of the world" account (7th column/row), whilst the former are represented by the
production and institutions accounts, as described below.
On the one hand, production activities buy "inputs" (intermediate consumption) and factors of
production services in order to produce, thereby generating added value. Beyond the subsidies on
production (from the government's current account and the rest of the world, i.e. European Union
institutions), which are deducted from taxes (net taxes on production), the only receipts of the
activities come from the sales of their production, which are then spent in intermediate
consumption, the compensation of factors and the payment of taxes (to the government's current
Production
Activities Factors of Production
Production Current Account Capital Account Gross Saving
REST OF THE WORLD Imports and
net taxes on products
Instit ution s Capital Transfers Gross National Income Compensation of Factors Services (Gross Added Value)
net taxes on production
Intermediate Consumption
net taxes on products
Gross Capital Formation
Exports
Final Consumption
net taxes on production
Capital Transfers Current
Transfers Current
Transfers
Financial Account
(-) Net lending/
borrowing Financial Transactions Financial Transactions Compensation of Factors Services
trade and transport margins
account). Therefore, there is the value of production to balance the total costs of the economy (see
the "activities" account, 2ndcolumn/row).
On the other hand, the factors of production will sell services to the (domestic and foreign)
production activities receiving compensation from these. Since the services of the factors are
supplied by (domestic and foreign) institutions, outlays can be made to the domestic institutions
(current account) through gross national income, as well as to the rest of the world (1st
column/row).
Beyond gross national income, i.e. the compensation of the factors of production, the other income
sources of the institutions are (net indirect) taxes (on products and production) and current transfers,
as can be seen from its "current account", which also shows how the income is either spent in final
consumption and current transfers or is saved (4th column/row).
Through the "products" accounts, we also have the possibility to study both supply and demand. As
sources of demand, there is intermediate consumption, final consumption, gross capital formation
and exports. On the supply side, we have production and imports, to which are added the (net) taxes
on products and the trade and transport margins (3rd column/row). The products accounts can be
seen as the accounts of those that perform intermediation activities and place products on the
market, in other words, those that acquire or import products, organise processing (transport and
storage), add the corresponding margins to the price, pay indirect taxes to the government and sell
the products to producers, households, government and the rest of the world.
In the "capital account", we can see, on the one hand, investment through gross capital formation
and capital transfers, and, on the other hand, the funds available for such investments, resulting
from gross saving and capital transfers, as well as from a balance corresponding either to financing
requirements or capacity, depending on the respective sign (5th column/row).
The "financial account" reveals the financial transactions in the other accounts (6th column/row).
We can therefore conclude that the SAM is a snapshot of the economy, amounting to a numerical
representation of the cycle: production - income - expenditure. It "shows how sectoral value added
accrues to production factors and their institutional owners; how these incomes, corrected for net
current transfers, are spent; and how expenditures on commodities lead to sectoral production and
value added" (Keuning and Ruijter, 1988) – or, to use the words of Thorbecke (2001), "it can
readily be seen that it incorporates all major transactions within a socio-economic system".
Thus, the SAM accounts for every transaction between the actors in the economic system while
providing a statistical representation of its circular flow. Since “a Computable General Equilibrium
consistency both at the macro level and at the level of individual actors… CGE models are specially
appropriate for operating within a SAM framework” (Abbink et al., 1995).
3. Identifying the items and balances of the various internal accounts of the SNA in the aggregate SAM
Considering the SNA as the basic source of information for the construction of the SAM, almost all
the flows that are part of the former are integrated into the latter.
The SNA adopted in Portugal since 1995 has been the European System of National and Regional
Accounts in the European Community of 1995 - ESA 95 (Eurostat, 1996), which is based on the
1993 version of the International United Nations System of National Accounts - SNA 93, prepared
by the Inter-Secretariat Working Group and published by the United Nations Statistical Office
(ISWG, 1993). For the latter body, "a SAM is defined as the presentation of SNA accounts in a
matrix which elaborates the linkages between a supply and use table and institutional sector
accounts" (ISWG 93, Prg. 20.4).
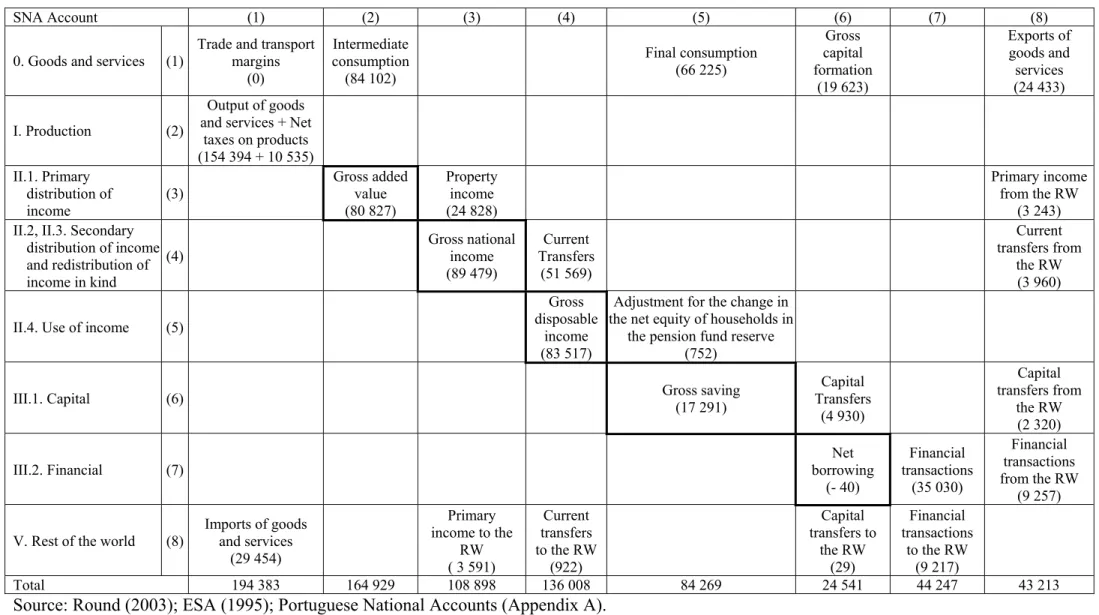
Next, the items and balances of the several (T) accounts of the Portuguese SNA for 1995 (Tables A
in the Appendix), represented in the matrix format by the NAM (National Accounting Matrix –
Table 2) will be identified in the SAM (Tables 1, 3 or 7), each of them referring to an aspect of the
economic circuit (see Outline 1). The cells of the basic SAM (Table 1) and the basic NAM (Table
2) will be referred when the SAM and the NAM accounts, respectively, are to be analyzed. As uses
(outlays, expenditures or changes in assets) and resources (incomes, receipts or changes in liabilities
and net worth), which are always recorded in millions of euros, we will use the designations that we
used for the various accounts of the SAM. We will add a " ' " to the SAM balances.
We will deal with gross balances and will not therefore take into account the consumption of fixed
capital.
Besides the external transactions of the rest of the world account, we will also work upon the goods
and services account, at current prices, the current accounts and the accumulation accounts (with the
exception of SNA account III.3 - other changes in assets account), which are the accounts made
available by the Portuguese National Accounts.
Goods and Services Account (SNA account 0) - balanced by definition:
Resources
Net taxes on products (2,1) ... 10 535 - paid to Portuguese institutions ………. 10 283
- paid to European Union institutions ………. 252
Total ... 194 383
Uses
Trade and transport margins (total) (1,1) ... 0 Intermediate consumption (1,2) ... 84 102 Final consumption expenditure (1,5) ... 66 225 Gross capital formation (1,6) ... 19 623 Exports of goods and services (1,8) ... 24 433 Total ... 194 383
This account can be associated with the SAM's "products" account, belonging to the group of
"production" accounts.
Thus:
Resources
Intermediate consumption (3,2) ... 84 102 Trade and transport margins (total) (3,3) ... 0 Final consumption expenditure of the national institutions in the economy
(3,4) ……… 64 898 Gross capital formation (3,5) ... 19 623 Exports of goods and services (3,7) ... 24 433 Aggregate demand ... 193 056
Uses
Output of goods and services (2,3) ... 154 394 Trade and transport margins (total) (3,3) ... 0 Net taxes on products paid to Portuguese institutions (4,3) ... 10 283 Imports of goods and services plus net taxes on products paid to
European Union institutions (7,3) ... 28 379 - imports of goods and services ……….. 28 127
- net taxes on products paid to European Union institutions ... 252 Aggregate supply ... 193 056
The difference between these two accounts is in the "direct purchases abroad by residents" (1 327),
considered in the SAM as a "current transfer to the rest of the world", since it does not represent an
expenditure in the economy and should not therefore be considered in the final consumption
sub-matrix (see Outline 1).
Production Account (SNA account I) - which describes the transactions that constitute the
appropriately named production process:
Resources
Net taxes on products (2,1) ... 10 535 - paid to Portuguese institutions ……..……….…... 10 283
- paid to European Union institutions ………..……….…..…….. 252 Total ... 164 929
Uses
Intermediate Consumption (1,2) ... 84 102 (B1g) Gross added value/gross domestic product (3,2) ... 80 827 Total ... 164 929
We associated this account with the SAM's "activities" account:
Resources
Production (output of goods and services) (2,3) ... 154 394
Uses
Intermediate consumption (3,2) ... 84 102 Net taxes on production ...- 433
- paid to Portuguese institutions (4,2) ………... - 346 - paid to European Union institutions (7,2) ………...…. - 87
(B1g') Gross added value/gross domestic product, at factor cost (1,2) ... 70 725 Total costs ... 154 394
We therefore have:
Gross added value/gross domestic product, at factor cost (B1g') = Gross domestic product (at
market prices, B1g) - net indirect taxes or net taxes on products and imports (70 725 = 80 827 -
(10 535- 433)).
In the SAM, the GDP (gross domestic product) at market prices can be calculated by adding to the
GDP at factor cost the net indirect taxes paid to the Portuguese government and to the European
Union institutions: 70 725 + (-346-87) + (10283+252) = 80 827.
Primary Distribution of Income Accounts (SNA account II.1) – which show how primary incomes,
i.e. incomes that accrue as a result of involvement in processes of production or the ownership of
assets that may be needed for production purposes, are distributed among institutions and activities:
- Generation of income account (SNA account II.1.1)
Resources
(B1g) Gross added value/gross domestic product ... 80 827
Uses
Compensation of employees paid by Portuguese institutions... 38 563 - to Portuguese institutions ………..……….. 38 500
- to the rest of the world ………..……….. 64
- to Portuguese institutions ……..……… ….……… 9 937 - to the rest of the world ……….……… 165
(B2g + B3g) Gross operating surplus + Gross mixed income ... 32 161 Total ... 80 827
- Allocation of primary income account (SNA account II.1.2)
Resources
(B2g + B3g) Gross operating surplus + Gross mixed income ... 32 161 Compensation of employees received by Portuguese institutions ... 38 620
- from Portuguese institutions ………...………. …. 38 500 - from the rest of the world ………. 120 Net taxes on production and imports
received/paid by Portuguese institutions ... 9 937 Property income received by Portuguese institutions... 27 952
- from Portuguese institutions ………...……… 24 829 - from the rest of the world ………...………. 3 363
Total ... 108 670
Uses
Property income paid by Portuguese institutions... 28 191 - to Portuguese institutions ………..…...……… 24 829 - to the rest of the world ……...………. . 3 363
(B5g) Gross national income ... 80 479 Total ... 108 670
- (Summary) Primary distribution of income account (generation and allocation - SNA account II.1)
Resources
(B1g) Gross added value/gross domestic product (3,1)... 80 827 Property income received by Portuguese institutions from Portuguese
institutions (3,3) ... 24 828 Primary income from the rest of the world (3,8) ... 3 243
- compensation of employees ……… 120 - property income ……….. 3 123
Total ... 108 898
Uses
Property income paid by Portuguese institutions to Portuguese
institutions (3,3) ... 24 828 Primary income to the rest of the world (8,3)... 3 591
- compensation of employees ………. 64 - property income ………...……….. 3 363 - net taxes on production and imports ...……….………... 165 (B5g) Gross national income (4,3) ... 80 479 Total ... 108 898
We can associate these accounts with the SAM's "factors of production" account, which has the
Resources
(B1g') Gross added value /gross domestic product, at factor cost (1,2) ... 70 725 - Labour (compensation of employees paid by
Portuguese institutions) ……… 38 563 - Others ((B2g' + B3g') Gross operating surplus +
Gross mixed income) ………..……….……. 32 161
Compensation of factors from the rest of the world (1,7) .. ……….. 3 243 - Labour (compensation of employees) ………...… 120
- Others (property income) .. ………... 3 123
Aggregate Income of Factors... 73 968
Uses
(B5g') Gross national income, at factor cost (4,1) ... 70 542 - Labour (compensation of employees received by
Portuguese institutions) ……….…… 38 620 - Other compensation of factors ……….….….... 31 922
Compensation of factors to the rest of the world (7,1) ... 3 426 - Labour (wages and salaries) ………... 64 - Other (property income) .. ……….…. 3 363
Aggregate Income of Factors... 73 968
In establishing the connection between those accounts, we have:
Gross national income, at factor cost (B5g') = Gross national income (at market prices, B5g) –
net indirect taxes or net taxes on production and imports received/paid by Portuguese
institutions (70 542 = 80 479 – 9 937).
Secondary Distribution of Income, Redistribution of Income in Kind and Use of Income Accounts.
The first two accounts show how the balance of primary incomes (national income) is transformed
into disposable income through the receipt and payment of current transfers; the third account
shows how gross disposable income is distributed between final consumption and saving.
- Secondary distribution of income and redistribution of income in kind accounts (SNA accounts II.2 and 3)
Resources
(B5g) Gross national income (4,3) ... 80 479 Current transfers within Portuguese institutions1 (4,4) ... 51 569 Current transfers from the rest of the world1 (4,8) ... 3 960 Total ... 136 008
1
Total Current transfers (resources) = 51 569 + 3960 = 55 529:
Uses
Current transfers within Portuguese institutions2 (4,4)... 51 569 Current transfers to the rest of the world2 (8,4) ... 922 (B6/7g) Gross disposable income (5,4) ... 83 517 Total ... 136 008
- Use of income account (SNA account II.4)
Resources
(B6/7g) Gross disposable income (5,4) ………. 83 517 Adjustment for the change in the net equity of households in pension fund
reserves (5,5) ……….. 752 Total ……….. ... 84 269
Uses
Final consumption (1,5) ... 66 225 Adjustment for the change in the net equity of households in pension fund
reserves (5,5) ……….. 752 (B8g) Gross saving (6,5)... 17 291 Total ……….. ... 84 269
Here is the SAM's "current" account of the Institutions:
Resources
(B5g') Gross national income, at factor cost (4,1) ... 70 542 - Compensation of employees ……….………... 38 620
- other compensations of factors ……….….………...…. 31 922
Other net taxes on production paid to Portuguese institutions (4,2) ...- 346 Net taxes on products paid to Portuguese institutions (4,3) ... 10 283 Current transfers within Portuguese institutions3(4,4)... 42 145 Current transfers from the rest of the world (4,7) ... 3960 Aggregate income ... 126 583
Uses
Final consumption in the economy (3,4) ... 64 898 Current transfers within Portuguese institutions3 (4,4)... 42 145 Current transfers to the rest of the world (7,4)... 2 249
- current transfers to the rest of the world ………... 922 - direct purchases abroad by residents ... 1 327 (B8g') Gross saving (5,4) ... 17 291 Aggregate income ... 126 583
2
Total current transfers (uses) = 51 569 + 922 = 52 491:
Current taxes on income, wealth, etc. paid by Portuguese institutions ... 7 161 Social contributions and benefits paid by Portuguese institutions... 33 524 Other current transfers paid by Portuguese institutions ……..………... 11 807
3
We thus have the total of the SAM's current account, which we have called aggregate income,
corresponding to the sum of the items:
Gross national income (B5g) + current transfers within Portuguese institutions + current transfers
from the rest of the world (126 583 = 80 479 + 42 145 + 3 960)
or
Gross disposable income (B6/7g) + current transfers within Portuguese institutions + current
transfers to the rest of the world (126 583 = 83 517 + 42 145 + 922).
Capital Account (SNA account III.1) – which records non-financial investment transactions and
capital transfers, considered as the partition of property transactions:
Changes in liabilities and net worth (resources)
(B8g) Gross saving (6,5) ... 17 291 Capital transfers within Portuguese institutions (6,6) ... 4 930 Capital transfers from the rest of the world (6,8) ... 2 320 Total ... 24 541
Changes in assets (uses)
Gross capital formation (1,6) ... 19 623 Capital transfers within Portuguese institutions (6,6) ... 4 930 Capital transfers to the rest of the world (8,6) ... 29 - Acquisitions less disposals of non-produced non-financial assets …… 0
(B9) Net borrowing/lending (7,6) ...- 40 Total ... 24 541
We have the following SAM's "capital" account:
Changes in liabilities and net worth (resources)
(B8g') Gross saving (5,4) ... 17 291 Capital transfers within Portuguese institutions (5,5) ... 4 930 Capital transfers from the rest of the world (5,7) ... 2 320 (B9') - Net borrowing/lending (5,6) ... 40 Investment Funds ... 24 582
Changes in assets (uses)
Gross Capital Formation (3,5) ... 19 623 Capital transfers within Portuguese institutions (5,5) ... 4 930 Capital transfers to the rest of the world (7,5) ... 29
- Acquisitions less disposals of non-produced non-financial assets …….. 0
Aggregate Investment ... 24 582
The only difference between these two accounts is in the way in which net borrowing/lending is
considered. In the SAM’s capital account, it is considered as a component of investment funds,
requirement/capacity of the economy that will be covered/absorbed by financial transactions
(from/to the rest of the world, since the national funds are not enough/in excess).
Financial Account (SNA account III.2) – records the transactions in financial assets and liabilities
between institutional units, and between these and the rest of the world:
Changes in liabilities and net worth (resources)
Financial transactions within Portuguese institutions (7,7) ... 35 030 Financial transactions from the rest of the world (7,8) ... 9 257 (B9F) Net borrowing/lending (7,6) ... - 40 Total ... 44 247
Changes in assets (uses)
Financial transactions within Portuguese institutions (7,7) ... 35 030 Financial transactions to the rest of the world (8,7) ... 9 217 Total ... 44 247
We have the following SAM's "financial" account:
Changes in liabilities and net worth (resources)
Financial transactions within Portuguese institutions (6,6) ... 35 030 Financial transactions from the rest of the world (6,7) ... 9 257 Total ... 44 287
Changes in assets (uses)
Financial transactions within Portuguese institutions (6,6) ... 35 030 Financial transactions to the rest of the world (7,6)... 9 217 (B9'F) - Net borrowing/lending (5,6) ... 40 Total ... 44 287
The explanation for the difference between these accounts is, once again, in the way in which net
borrowing/lending is considered. In the SAM’s financial account, it is considered as a use because it
is used to cover/absorb the financing requirement/capacity of the economy, with financial
transactions from/to the rest of the world (an amount that represents a liability with the rest of the
world, in the case of the financing requirement).
Rest of the World Account (SNA account V) – records transactions between resident and
non-resident units.
Resources / changes in liabilities and net worth
- compensation of employees ……… 64
- property income ………...……….. 3 363 - net taxes on production and imports ...……….………... 165
Current transfers to the rest of the world(8,4) ... 922
- social benefits other than social transfers in kind ……….… 30
- others ….………...………..…..….. 892
Capital transfers to the rest of the world (8,6) ... 29
- Acquisitions less disposals of non-produced non-financial assets …… 0
Financial transactions to the rest of the world (8,7) ... 9 217 Total ... 43 213 Uses / changes in assets Exports of goods and services (1,8) ... 24 433 Primary income from the rest of the world (3,8) ... 3 243 - compensation of employees ……… 120
- property income ……….. 3 123 Current transfers from the rest of the world (4,8) ... 3960
- social benefits other than social transfers in kind ……… 29
- others ….………...………..….……. 3931
Capital transfers from the rest of the world (6,8)... 2 320 Financial transactions from the rest of the world (7,8) ... 9 257 - Net lending ……… - 40
Total ... 43 213 In the SAM's "rest of the world" account: Resources / changes in liabilities and net worth Compensation of factors to the rest of the world (7,1) ... 3 426 - Labour (wages and salaries) ………...… 64
- Others (property income) .. ………. 3 363 Net taxes on production paid to European Union institutions (7,2) ... - 87
Imports of goods and services plus net taxes on products paid to European Union institutions (7,3) ... 28 379 - imports of goods and services ………... 28 127 - net taxes on products paid to European Union institutions …... 252
Current transfers to the rest of the world (7,4) ... 2 249 - current transfers to the rest of the world ………... 922
- direct purchases abroad by residents ... 1 327 Capital transfers to the rest of the world (7,5) ... 29
- Acquisitions less disposals of non-produced non-financial assets …….. 0
Financial transactions to the rest of the world (7,6)... 9 217 Total ... 43 213 Uses / changes in assets Compensation of factors from the rest of the world (1,7) .……….………….. 3 243 - Labour (wages and salaries) ………...… 120
- Others (property income) .. ………... 3 123
Financial transactions from the rest of the world (6,7) ... 9 257 - Net lending ……….…… 40
Total ... 43 213
There is a close relationship between both accounts.
Therefore, generally speaking, if it were not for indirect taxation, the association of SAM accounts
with national (T) accounts would be perfect – with the aggregate SAM being calculated from these
accounts. The latter could also be calculated from the former, which may not be true if some
disaggregation is undertaken. “SAMs are an extension of the core national accounts as presented in
the European System of Accounts (ESA95) and the System of National Accounts (SNA 93)” (LEG,
2003)
One of the many advantages of the SAM approach could be referred to here, using the words of
Pyatt (1991):
“by sticking to essentials, the relationship between economic concepts and principles, on the
one hand, and on the other, the accounting structure they give rise to, can be kept clearly in the
open”.
Table 2. Portuguese Basic NAM (National Accounting Matrix) for 1995 (in millions of euros)
SNA Account (1) (2) (3) (4) (5) (6) (7) (8)
0. Goods and services (1)
Trade and transport margins (0) Intermediate consumption (84 102) Final consumption (66 225) Gross capital formation (19 623) Exports of goods and services (24 433)
I. Production (2)
Output of goods and services + Net
taxes on products (154 394 + 10 535) II.1. Primary distribution of income (3) Gross added value (80 827) Property income (24 828) Primary income from the RW
(3 243) II.2, II.3. Secondary
distribution of income and redistribution of income in kind
(4) Gross national income (89 479) Current Transfers (51 569) Current transfers from the RW (3 960)
II.4. Use of income (5)
Gross disposable
income (83 517)
Adjustment for the change in the net equity of households in
the pension fund reserve (752)
III.1. Capital (6) Gross saving
(17 291) Capital Transfers (4 930) Capital transfers from the RW (2 320)
III.2. Financial (7)
Net borrowing (- 40) Financial transactions (35 030) Financial transactions from the RW
(9 257)
V. Rest of the world (8)
Imports of goods and services
(29 454)
Primary income to the
RW ( 3 591)
Current transfers to the RW
(922) Capital transfers to the RW (29) Financial transactions
to the RW (9 217)
Total 194 383 164 929 108 898 136 008 84 269 24 541 44 247 43 213
4. Possible disaggregations
By either top-down or bottom-up methods, it is possible to break down or aggregate each account into
categories, using on occasions sources of information other than the SNA, without losing the consistency of
the whole system, that is to say, "a crucial feature is the wide range of possibilities for expanding or
condensing such a matrix in accordance with specific circumstances and needs" (ISWG, 1993, Prg. 20.6) -
section 7 is an illustration of this statement.
Nowadays, the SNA (referred to at the beginning of section 3) in general and the Portuguese National
Accounts in particular provide several (mutually exclusive) possibilities for the disaggregation of products
and activities, a few possibilities for the institutions' accounts and even fewer for the factors of production.
Therefore, production accounts, which are drawn from supply and use tables (see Tables A.4 and A.5), can
be broken down into 60 activities and products, which in the case of some transactions can have yet more
disaggregation levels.
Furthermore, in the case of production accounts, the factors of production may only be broken down into
labour (employees) and others. This includes compensation of own-account employees, interests, profits,
rents…. – which is why the classification of “other” was preferred to the term “capital”, which is used
normally.
In turn, the institutions' accounts can be disaggregated into five institutional sectors, each with a similar
economic behaviour: households, non-financial corporations, financial corporations, general government,
and non-profit institutions serving households (NPISHs).
General government can be further disaggregated into central government, local government and social
security funds, whilst financial corporations can be disaggregated into central bank, other monetary
financial institutions, other financial intermediaries, except insurance corporations and pension funds,
financial auxiliaries and insurance corporations and pension funds (see Table A.2). The rest of the world
can also be broken down into the European Union (member states and institutions) and non-member
countries and international organisations (see Table A.3).
Table 3 shows the part of the Portuguese SAM that it was possible to construct from the SNA, with the aim
described in section 1 and which will be broken down even further in section 7, albeit using other sources of
information.
As can be seen from its totals, Table 3, which represents the so-called Macro SAM, is a possible
disaggregation of Table 1, which represents the so-called Basic SAM (the Macro SAM completely
aggregated). All its sources, as well as the corresponding description of its items, can be consulted in
Appendix A (the disaggregation presented of the transactions and other flow stocks is the one used in the
constructed SAM, although it could be taken further).
It is therefore easy to conclude that "a SAM applies the properties of a matrix format to incorporate specific
5. Identifying the main items of the Balance of Payments and the Government Budget
From the rest of the world (RW) SAM account one can calculate the main items of the balance of
payments, as shown above.
Table 4. The Balance of Payments in the Portuguese SAM for 1995 (in millions of euros)
Resources (row) Uses (column) Balance
1. Current Account 31 636 33 967 - 2331
- Goods & Services Exports 24 433 Imports 28 379 - 3 946 - Income Compensation of
factors from the RW 3 243
Compensation of
factors to the RW 3 426 - 183 - Current Transfers Current transfers from
the RW 3 960
Current transfers to the RW (2249) + net taxes on production to the RW (-87)
2 162 1 798
2. Capital Account Capital transfers from
the RW 2 320
Capital transfers to the
RW 29 2 291
3 = 1 + 2 (Balance = Net borrowing)
33 956
33 996 - 40 4. Financial Account Financial transfers from
the RW 9 257
Financial transfers to
the RW 9 217 40
5 = 3 + 4 = Total 43 213 43 213 0
Source: Portuguese SAM for 1995 (Tables 1 or 3, Rest of the World rows/columns)
These are approximate values, since the Portuguese balance of payments is calculated from the
National Accounts and other sources of information and is published by the Portuguese Central
Bank (Banco de Portugal) and not by the Portuguese Institute of Statistics (Instituto Nacional de
Estatística), with the two values being relatively different.
In accordance with the previous section, these values, taken from the National Accounts, could also
be disaggregated into the European Union (member states and institutions) and non-member
countries and international organisations – as Santos (2003) does for 1997.
On the other hand, as is shown by Table 5, from the government’s current and capital accounts one
can calculate/identify the main items of the government budget.
Table 5. The Government Budget in the Portuguese SAM for 1995 (in millions of euros)
Resources or Receipts (row) Uses or Expenditure (column) Balance
1. Current Account 31 081 32 742 - 1661 (b)
Gross National Income
at factor cost (a) - 2558 Final Consumption 15 032 Net taxes on
production - 346
Current transfers to
Resources or Receipts (row) Uses or Expenditure (column) Balance Net taxes on products 10 283 Current transfers to the
RW 339
Current transfers from
Portuguese institutions 23 092 Current transfers from
the RW 609
2. Capital Account 3 375 6 136 - 2 761
Capital transfers from
Portuguese institutions 2 100
Gross Capital
Formation 3 018
Capital transfers from
the RW 1 275
Capital transfers to
Portuguese institutions 3 075 Capital transfers to the
RW 43
3 = 1 + 2 (Balance
= Net borrowing) 34 456 38 878 - 4 423
Source: Portuguese SAM for 1995 (Table 3 rows/columns 19 and 23)
(a) Government’s Gross National Income at factor cost (see Table A.1, column S13) = [output of goods and services + other subsidies on production (received) + property income (received)] –
[intermediate consumption + compensation of employees (paid) + property income (paid)] = (15 389 + 56 + 1056) + (3 003 + 10 990 + 5 066)
(b) Government’s Gross Saving [cell (23,18) of Table 3]
Similarly, in this case, the (general) government could have been disaggregated into central
government, local government and social security funds, giving a more complete picture of the
structure and composition of the government budget – as Santos (2003a and 2004) does for 1998
and 1999.
The same thing that was done with the government could also be done with other institutions - why
not develop policies centred on the budgets of households or enterprises, for instance?
6. The SAM's blocks of sub-matrices
The SAM's blocks, identified in Table 6, are sub-matrices or sets of sub-matrices (as seen in the
Basic SAM - Table 1) with common characteristics. The specification of these blocks involves the
identification of the transactions of the National Accounts, the (National Accounts) tables, which
are the sources of information used to construct the SAMs, and the method of calculation used (only
for those sub-matrices that are not calculated either directly from the sources or whenever there are
Table 6. Basic SAM by blocks
Production Institutions Outlays
(expenditures) (j) Incomes
(receipts) (i)
Factors Activities Products Current A. Capital A. Financial A.
Rest of the World (RW)
Factors 0 0 0 0 0
Activities 0 0 Production 0 0 0 0
Pr
odu
ction
Products 0 Intermediate
Consumption
Trade and Transport
Margins Final Consumption
Gross Capital
Formation 0
Current A. 0 0
Capital A. 0 0 0 Gross Saving ( -) Net lending/
borrowing
In
stitu
tion
s
Financial A. 0 0 0 0 0
Rest of the World X
Blocks with more than one sub-matrix:
Compensation of the factors of production Capital Transfers
Net Indirect Taxes Financial Transactions
External Trade
6.1. Compensation of factors of production
Income of the institutional sectors from the compensation of the services provided through their real
and financial assets to the activities of production and to the rest of the world, namely:
− Compensation of employees (transaction D1 of the National Accounts), which is the total
remuneration, in cash or in kind, payable by an employer to an employee in return for work
done by the latter during the accounting period. Compensation of employees is broken down
into: wages and salaries (in cash or in kind) and employers’ social contributions (actual and
imputed social contributions) (ISWG 93, Prg. 7.21-7.47; ESA 95, Prg. 4.02-4.13).
− All the above-mentioned income which is not derived from the compensation of employees, including property income (transaction D4 of the National Accounts), which is the income
receivable by the owner of a financial asset or a tangible non-produced asset in return for
providing funds to, or putting the tangible non-produced asset at the disposal of, another
institutional unit. Property income is composed of interest, the distributed income of
corporations, dividends, withdrawals from the income of quasi-corporations, reinvested earnings
on direct foreign investment, property income attributed to insurance policy holders and rents
(ISWG 93, Prg. 7.87-7.133; ESA 95, Prg. 4.41-4.76).
Sources
Generation of income and allocation of primary income accounts of the institutions (II.1.1 and
II.1.2, in integrated economic accounts or in institutional sector accounts – Tables A.1., A.2.1.and
A.2.2.); external account of primary income and current transfers (V.II, in rest of the world accounts
– Table A.3.); use of products at purchasers’ prices (current prices) (Table A.5.).
Methodology
The other compensations of factors, in the gross national income sub-matrix, is the sum of the gross
operating surplus and the balance of the income from property. The gross operating surplus is the
gross added value (production minus intermediate consumption) minus the taxes paid on production
plus the subsidies received on production minus the paid compensation of employees.
6.2. Production
Output of goods and services (transaction P1 of the National Accounts), which consists of the
products created during the accounting period and is subdivided into market output, output
produced for own final use, other non-market output (ISWG 93, Prg. 6.38-6.51; ESA 95, Prg.
Sources
Production account of institutions (I, in integrated economic accounts or in institutional sector
accounts – Tables A.1., A.2.1.); supply of products at basic prices (current prices) (Table A.4.);
goods and services account (see related columns of integrated economic accounts – Table A.1.).
6.3. Intermediate Consumption
Intermediate consumption (transaction P2 of the National Accounts), which consists of the value of
the goods and services consumed as inputs by a process of production, excluding those fixed assets
whose consumption is recorded as consumption of fixed capital. The goods and services may be
either transformed or used up by the production process (ISWG 93, Prg. 6.147-6.178; ESA 95, Prg.
3.69-3.73).
Sources
Production account of institutions (I, in integrated economic accounts or in institutional sector
accounts – Tables A.1. and A.2.1.); use of products at purchasers’ prices (current prices) (Table
A.5.); goods and services account (see related columns of integrated economic accounts – Table
A.1.).
6.4. Gross Capital Formation
Gross capital formation (transaction P5 of the National Accounts), which consists of gross fixed
capital formation, changes in inventories, acquisitions less disposals of valuables (ISWG 93, Prg.
10.32-10.130; ESA 95, Prg. 3.100-3.127).
Sources
Capital account of the institutions (III.1, in integrated economic accounts or in institutional sector
accounts – Tables A.1 and A.2.4.); use of products at purchasers’ prices (current prices) (Table
A.5.); goods and services account (see related columns of integrated economic accounts – Table
A.1.); gross fixed capital formation by products and institutions (supplementary table of Portuguese
National Accounts).
.
Methodology
The total gross capital formation by product(s) was calculated from the use of the products table.
The total gross capital formation by institution(s) was calculated from the capital account of the
The gross fixed capital formation by product(s) and institution(s) was calculated from the
supplementary table of Portuguese National Accounts with the same name.
The changes in inventories and the acquisitions less disposals of valuables by product(s) and
institution(s) were calculated by applying the share of the product(s) in the total to the total value of
the institution(s).
6.5. Net Indirect Taxes or Net Taxes on Production and Imports 6.5.1. Net Taxes on Production
(Other) Taxes on production (transaction D29 of the National Accounts) minus the (other) subsidies
on production (transaction D39 of the National Accounts). The former consist of all taxes that
enterprises incur as a result of engaging in production, regardless of the quantity or value of the
goods and services produced or sold (ISWG 93, Prg. 7.70; ESA 95, Prg. 4.22-4.24), and that are
paid to the government. The latter consist of subsidies, except those subsidies on products which
resident producer units may receive as a consequence of engaging in production (ISWG 93,
Prg.7.79; ESA 95, Prg. 4.36-4.40), received from the government and the rest of the world
(European Union Institutions).
Sources
Primary distribution of income accounts of the institutions (II.1., in integrated economic accounts
or in institutional sector accounts – Tables A.1 and A.2.1. and A.2.2.); external account of primary
income and current transfers account (V.II, in rest of the world accounts – Table A.3.); use of
products at purchasers’ prices (current prices) (Table A.3.).
Methodology
The totals by activity/ies are calculated from the use of the products table.
The totals for the government and for the rest of the world are calculated from the table showing the
allocation of the primary income account of the institutions (the totals for the rest of the world may
also be calculated from the external account of the primary income and current transfers account,
and this must be the case if some disaggregation is needed).
The values by activity/ies for the rest of the world are calculated by applying the share of the
activity/ies in the total to the total value of the rest of the world. The values (by activity/ies) for the
government are calculated by the difference between the total value (by activity/ies) and the rest of
6.5.2. Net Taxes on Products
Taxes on products (transaction D21 of the National Accounts) minus the subsidies on products
(transaction D31 of the National Accounts). The former consist of taxes that are payable per unit of
a good or service produced or transacted (ISWG 93, Prg. 7.62-7.69; ESA 95, Prg. 4.16-4.21), these
being paid to the government and the rest of the world. The latter consist of subsidies payable per
unit of a good or service produced or imported (ISWG 93, Prg. 7.73-7.78; ESA 95, Prg. 4.33-4.35),
received from the government and the rest of the world (European Union Institutions).
Sources
Production account and primary distribution of income accounts of institutions (I and II.1, in
integrated economic accounts or in institutional sector accounts – Tables A.1., A.2.1., A.2.2.);
external account of the primary income and current transfers account (V.II, in the rest of the world
accounts – Table A.3.); supply of products at basic prices (current prices) (Table A.4.); goods and
services account (see related columns of integrated economic accounts – Table A.1.).
.
Methodology
The totals by product(s) are calculated from the supply of products table.
The totals for the government and for the rest of the world are calculated from the table showing the
allocation of the primary income account of the institutions (the totals for the rest of the world may
also be calculated from the external account of the primary income and current transfers account,
and this must always be the case if some disaggregation is needed).
The values by product(s) for the rest of the world, which will be added to imports (the external trade
block), are calculated by applying the share of the product(s) in the total to the total value of the rest
of the world. The values (by product(s)) for the government are calculated by the difference
between the total value (by product(s)) and the rest of the world's value.
6.6. Final Consumption
Final consumption (transaction P3 of the National Accounts) consists of expenditure incurred by
resident institutional units on goods or services that are used for the direct satisfaction of individual
needs or wants or the collective needs of members of the community. Final consumption
expenditure may take place within the domestic territory or abroad. (ISWG 93, Prg. 9.45-9.71; ESA
95, Prg. 3.75-3.80).
Direct purchases abroad by residents are considered in current transfers to the rest of the world (the
Direct purchases by non-residents in the domestic market are considered as exports (the external
trade block).
Sources
Use of products at purchasers’ prices (current prices) (Table A.5.); use of disposable income (II.4,
in integrated economic accounts or in institutional sector accounts – Tables A.1. and A.2.3.).
6.7. External Trade
Transactions in goods and services (purchases, barter, gifts or grants) from non-residents to
residents, or imports (transaction P7 of the National Accounts), and from residents to non-residents,
or exports (transaction P6 of the National Accounts) (ESA 95, Prg. 3.128-3.1464).
Although the National Accounts consider direct purchases abroad by residents as an import, here
they are considered as a current transfer from households to the rest of the world.
Sources
Supply of products at basic prices (current prices) (Table A.4.), for imports; use of products at
purchasers’ prices (current prices) (Table A.5.), for exports; external account of goods and services
(V.I, in the rest of the world accounts – Table A.3a.); goods and services account (see related
columns of the integrated economic accounts – Table A.1.).
.
6.8. Trade and Transport Margins
Trade and transport margins, realised on the goods purchased for resale, are a part of the production
of the wholesale trade services, retail trade services and repair services of motor vehicles,
motorcycles and personal and household goods. They are recorded as part of the product trade and
are therefore included in the various components of aggregate demand. They total zero, since they
are negative in relation to the three above-mentioned activities (because the corresponding value
has already been recorded in the production sub-matrix), but are positive and have the same amount
in relation to all the other ones (ISWG 93, Prg. 6.110-6.114, 15.40-15.44; ESA 95, Prg. 3.60, 9.38-9.41).
Sources
Supply of products at basic prices (current prices) (Table A.4.).
4
6.9. Current Transfers
Current taxes on income, wealth, etc. (transaction D5 of the National Accounts), which cover all
compulsory, unrequited payments, in cash or in kind, levied periodically by general government and
by the rest of the world on the income and wealth of institutional units, as well as some periodic
taxes which are levied on neither income nor wealth (ISWG 93, Prg. 8.43-8.54; ESA 95, Prg.
4.77-4.82).
Social benefits and contributions (transaction D6 of the National Accounts). Social benefits are
transfers to households, in cash or in kind, intended to relieve them of the financial burden of a
number of risks or needs, made either through collectively organised schemes or outside such
schemes by government units and non-profit institutions serving households; they include payments
from general government to producers which individually benefit households and which are made
in the context of social risks or needs. Social contributions include (employers' and employees')
actual social contributions transferred to general government (ISWG 93, Prg. 8.67-8.83 and
8.99-8.106; ESA 95, Prg. 4.83-4.108). Because the amount of the social transfers in kind represents a
final consumption expenditure of the government and the non-profit institutions serving
households, it is not considered here but in the final consumption block.
Other current transfers (transaction D7 of the National Accounts), which consist of net non-life
insurance premiums, non-life insurance claims, current transfers within general government, current
international co-operation and miscellaneous current transfers (ISWG 93, Prg. 8.84-8.98; ESA 95,
Prg. 4.109-4.140).
Adjustment made for the change in the net equity of households in pension fund reserves
(transaction D8 of the National Accounts), which represents the adjustment needed in order to cause
to appear in the saving of households the change in the actuarial reserves on which households have
a definite claim and which are fed by premiums and contributions recorded in the secondary
distribution of income account as social contributions (ISWG 93, Prg. 9.14-9.20; ESA 95, Prg.
4.141-4.144).
As already mentioned above, direct purchases abroad by residents are considered as a current
transfer from households to the rest of the world.
Sources
Secondary distribution of income and use of disposable income accounts of the institutions (II.2 and
II.4, in integrated economic accounts or in institutional sector accounts – Tables A.1., A.2.2. and
accounts – Table A.3); "from whom to whom" matrices, made available particularly by the
Portuguese Institute of Statistics, for the inter-institutional flows (Table A.6.).
6.10. Gross Saving
Gross saving measures the portion of the aggregate income that is not used for final consumption
expenditure and current transfers to Portuguese institutions or to the rest of the world (saving:
ISWG 93, Prg. 9.17-9.20; ESA 95, Prg. 8.96).
Sources
Use of disposable income account of the institutions (II.4, in integrated economic accounts or in
institutional sector accounts – Tables A.1. and A.2.3.).
6.11. Capital Transfers
Capital transfers5 (transaction D9 of the National Accounts), which cover capital taxes, investment
grants and other capital transfers (ISWG 93, Prg. 10.131-10.141; ESA 95, Prg. 4.146-4.167).
Acquisitions less disposals of non-financial non-produced assets (transaction K2 of the National
Accounts) - non-financial non-produced assets consist of land and other tangible non-produced
assets that may be used in the production of goods and services, as well as intangible non-produced
assets (ISWG 93, Prg. 10.120-10.130; ESA 95, Prg. 6.06-6.13).
Sources
Capital accounts of the institutions (III.1, in integrated economic accounts or in institutional sector
accounts – Tables A.1. and A.2.4.); capital accounts, in the external accumulation accounts (V.III.1,
in the rest of the world accounts – Table A.3.); "from whom to whom" matrices, made available
particularly by the Portuguese Institute of Statistics, for the inter-institutional flows (Table A.6.).
6.12. Net borrowing/lending
The net lending (+) or borrowing (-) of the total economy is the sum of the net lending or borrowing
of the institutional sectors. It represents the net resources that the total economy makes available to
the rest of the world (if it is positive) or receives from the rest of the world (if it is negative). The
5
net lending (+) or borrowing (-) of the total economy is equal, but with an opposite mathematical
sign, to the net borrowing (-) or lending (+) of the rest of the world (ESA 95, Prg. 8.98).
Here, these amounts that fall short of (+) or exceed (-) the investment funds used to cover aggregate
investment are registered in the capital and financial accounts, since they are financial transactions
from (in the case of net borrowing) or to (in the case of net lending) the rest of the world – this is
why the mathematical signs defined in the first paragraph of this item (ESA 95, Prg. 8.98) were
exchanged.
Sources
Capital account of the institutions (III.1, in integrated economic accounts or in institutional sector
accounts – Tables A.1. and A.2.4.); external accumulation accounts (V.III, in the rest of the world
accounts – Table A.3.).
Methodology
These values can be taken directly from the sources or calculated as the balance between the totals
of the components of investment funds and aggregate investment or as the difference between the
financial transactions from and to the rest of the world.
6.13. Financial Transactions
Financial transactions (F1-7 of the National Accounts) are transactions in financial assets and
liabilities between institutional units, and between these and the rest of the world. They are
classified as monetary gold and special drawing rights; currency and deposits; securities other than
shares; loans; shares and other equity; insurance technical reserves; and other accounts
receivable/payable.
The outlays (expenditures) side of the (financial) account records changes in the assets, i.e.
acquisitions minus disposals of financial assets. The incomes (receipts) side of the same account
records changes in liabilities and net worth, i.e. the incurrence of liabilities minus their repayment.
The balancing item of the financial account, i.e. the net acquisition of financial assets minus the net
incurrence of liabilities, is net lending (+)/net borrowing (-) (ISWG 93, Prg. 11.1-11.111; ESA 95,
Prg. 5.01-5.151).
Sources