ECML
PKDD
2011
EUROPEAN
CONFERNCE
ON
MACHINE
LEARNING
AND
PRINCIPLES
AND
PRACTICES
OF
KNOWLEDGE
DISCOVERY
IN
DATABASES
The 5th International Workshop on Data Mining in Functional
Genomics and Proteomics: Current Trends and Future Directions
DMFGP ‘11
September 5, 2011
Editors:
José Maria Peña
Universidad Politécnica de Madrid, Spain
And
Fazel Famili
National Research Council of Canada, Ottawa, Canada
Preface
The 5th International Workshop on Data Mining in Functional Genomics and Proteomics:
Current Trends and Future Directions was held in Athens, Greece, on September 5
th, 2011 in
conjunction with the European Conference on Machine Learning and Principles and Practices of
Knowledge Discovery in Data bases (ECML/PKDD 2011).
Life sciences has become a major area of data mining research with genomics and proteomics
being the prime motivators for the need to develop and apply machine learning and data mining
techniques to analyse large amounts of data that is produced all over the world. Data Mining in
Functional Genomics and Proteomics is a multi-disciplinary research area that involves a close
collaboration between researchers from a number of diverse areas, such as computer science,
mathematics, and statistics, to biology, medicine, genomics and proteomics. This collaboration
of disciplines has evolved because of the: (i) advances that have occurred in data production and
acquisition facilities, such as the introduction of high throughput genomics and proteomics
microarrays, (ii) enormous amounts of data that is generated from each experiment or
investigation that cannot be analyzed using ordinary data mining tools and techniques, and (iii)
strong interest from many groups (research institutes, hospitals, academia, pharmaceuticals, etc.)
who want to benefit from this wealth of data. Many efforts are being undertaken by researchers
working in this field.
This workshop was intended to encourage the researchers to present ongoing research and
development that represents either (or both):
Integrated data mining: Approaches that cover from experimental data to preprocessing,
data analysis, presenting/visualizing results and, finally, interpretation of the results. The
contributions following this format should use recent or completely new datasets and
interesting application scenarios.
Exploratory machine learning and data mining techniques, proposing challenging
approaches: They could be new methodologies or adapted techniques from other fields.
The aim of this workshop series has been to bring together researchers working on different
topics related to data mining and machine learning in Life Sciences. In particular we have been
interested to focus on current issues and trends and also emphasize on what should be the future
directions for generic and applied research in this field.
A total of 9 papers were submitted of which we have selected 8 for presentation and
discussion during this workshop. Each submission was evaluated by 2 reviewers. We would like
to thank all authors and attendees of this workshop for their support and participation in this
event. Special thanks also to the ECML/PKDD organization for accepting our workshop
proposal.
Athens, September 2011
José Maria Peña
Fazel Famili
Workshop Chairs
José Maria Peña
Universidad Politécnica de Madrid, Spain
Fazel Famili
National Research Council of Canada, Ottawa, Canada
Organizing committee
* Prof. J.M. Peña (UPM – Spain), Co-Chair [[email protected]]
* Dr. A. Fazel Famili (NRC – Canada), Co-Chair [[email protected]]
* Prof. Ana Teresa Freitas (INESC-ID/IST, Portugal) [[email protected]]
* Prof. Jaakko Hollmén (Helsinki Uni. of Technology, Finland) [[email protected]]
* Prof. Alexander Schliep (Comp. Science, Rutgers Univ. USA) [[email protected]]
* Prof. Henrik Bostrom (Stockholm University, Sweden) [[email protected]]
* Prof. Min-Ling Zhang (South East University, Nanjing, China) [[email protected]]
* Prof. Evgenii Vityaev (Russian Academy of Science, Russia) [[email protected]]
Additional reviewers
* Dr. Santiago Muelas
* Dr. Antonio LaTorre
* Dr. Antonio Gracia
* Dr. Santiago González
* Dr. Jorge Veiga
Table of Contents
Identifying informative genes in highly imbalanced gene expression data ……… 2
Fazel Famili, Ziying Liu and Sieu Phan
Comparing Functional Visualizations of Genes ……….. 12
Hamid Ghous, Nicholas Ho, Daniel R. Catchpoole, and Paul J. Kennedy
Exploiting Gene Expression data for Pharmacogenomics analysis ……… 22
S. Gonzalez, Y. Cheng and V. Robles
Finding HCV NS5A Discriminative Motifs for Assessement of IFN/Ribavarin Therapy Effect … 32
Tu Bao Ho, Saori Kawasaki, Ngoc Tu Le, Tatsuo Kanda, Nhan Ley, Katsuhiro Takabayashi, Osamu
Yokosuka
Analysis and Prediction of Regulatory Regions of Eukaryotic Genes by integrated UGENE and
ExpertDiscovery Systems ……… 43
Irina Khomicheva,, Evgenii Vityaev, Yurii Vaskin, and Timur Shipilov
A Genome-Wide Study of the Effect of Aging on Level-2 Gene-Ontology Categories in Mice Using
Mixed Models ……… 53
Vincenzo Lagani, Ioannis Tsamardinos, Magda Grammatikou, and George Garinis
Characterizing and extracting the synaptic apposition surface for the analysis of synaptic geometry.. 63
Juan Morales, Angel Rodriguez, Jose-Rodrigo Rodriguez, Javier DeFelipe, and Angel Merchan-Perez
Non-Linear Computational Evolutionary Environment (NLCEE): Building High-level Knowledge in
Complex Biological Databases ……….. 73
Laurence Rodrigues do Amaral and Estevam Rafael Hruschka Junior
Non-Linear Computational Evolutionary
Environment (NLCEE): Building High-level
Knowledge in Complex Biological Databases
Laurence Rodrigues do Amaral1,2
and Estevam Rafael Hruschka Junior1
1
Federal University of Sao Carlos, Rod. Washington Luis, Km 235, Sao Carlos - SP, Brazil
2
Federal University of Goias/Jatai, BR 364, Km 192, Jatai - GO, Brazil
Abstract. Computational approaches can be applied to solve differ-ent biology challenges. Tools based on traditional computation meth-ods have shown, however, to be limited to approach complex biological problems in many situations. In this study, a non-linear computational evolutionary environment (NLCEE) is proposed. The main goal of the proposed approach is allowing the discovery of concise, yet accurate, set of high-level rules (from a complex biological database) which can be used as a classification system. The obtained results show that NLCEE is promising and capable of extracting useful non-linear high-level knowl-edge from complex databases, balancing accuracy, comprehensibility and interpretability.
1
Introduction
Genetic Algorithms (GAs) are computational search methods based on natural evolution and genetic mechanisms, simulating Darwins’s natural selection theory [11]. A GA can be classified as an Evolutionary Computation approach, which is a subarea of Artificial Intelligence focused on the study of computational methods based on Darwin’s evolutionary theory. In a nutshell, GAs are parallel algorithms which manipulate a group (populations) of individuals representing chromosomes. Based on the use of reproduction and survival operators, a current population is transformed in a new one. Guided by specific fitness functions this process is repeated a number of times until achieving a stopping criteria [14].
be obtained. Not all the classification rules, however, can be considered ideal for a classification task. In this sense, a number of different objective functions (or fitness fuctions) can be used in order to assess the quality of the IF-THEN rules generated by specific classifiers. Objective functions based on prediction accu-racy, comprehensibility and interpretability[9] are very common in the literature. The search for a suitable set of classification rules usually has to explore a huge search space. Considering also, that such a search space usually contains many local optimum points, GAs can be seen as a promising approach to be applied in data mining tasks related to IF-THEN classification rules [9] [16] [10] [2].
Prediction accuracy is not the only important issue in a classification task. Interpretability and comprehensibility are key aspects in a system designed to help classification in real world domains. In general, prediction alone cannot, itself, give to the users much information to help to better understand the tar-get problem, neither to learn more about the relationships among the variables3 involved in the application domain. In this sense, having a system that sim-ply classifies a given instance, giving no insight (or ”explanation”) about the obtained results, might not be as useful (or suitable) as a system capable of classifying and generating rules describing variable relevance and relations [1].
Taking into consideration the aforementioned ideas on the relevance of clas-sification systems comprehensibility and interpretatability, we propose in this work, a GA to generate classification rules tending to have a reduced set of an-tecedents and which can be used to predict the class of a ”term” (an instance having gene and gene product attributes based on a subset of ”Gene Ontol-ogy” database [6] containing 13,091 records). In addition, the classifier does not make use of a ”default rule”4
. The output, of the GA here proposed, is gener-ated intending to reduce the problem description to few variables for each class and never classifying a given instance based only on the higher frequency class. Therefore, besides outputting classification results, the obtained results can help to reveal relations among variables and to understand which of them are more relevant when predicting each one of the three classes (namely: biological process, cellular component and molecular function) involved in this real world domain application given by the GO Ontology.
The Gene Ontology (GO) project is a collaborative effort addressing the need for consistent descriptions of gene products in different databases. GO collabora-tors are developing three structured and controlled vocabularies (ontologies) that describe gene products in terms of their associated biological processes, cellular components and molecular functions in a species-independent manner. In the GO ontology, each new term insertion or update is performed manually by GO
3
In this work we use the words ”variable” and ”attribute” as synonyms that can refer to any one of the antecedents of a classification rule, as well as, to any one of the characteristic of a term given in the Gene Ontology (GO) database
4
curators. Thus, the high-level knowledge generated by the GA proposed in here can help in new terms classification, making the classification task less complex for GO curators. In [4], Bodenreider and collaborators built cross-subontological relations using lexical and association approaches applied in GO databases, our work does not use such relations.
In the present study, a non-linear computational evolutionary environment (NLCEE) is proposed as a tool to induce classification rules from complex biolog-ical datasets. The main goal of the proposed approach is to allow the discovery of concise, yet accurate, non-linear high-level rules (from a biological database) which can be used as a classification system. More than focusing only on the clas-sification accuracy, the proposed NLCEE aims at balancing prediction precision, interpretability and comprehensibility.
2
Evolutionary Environment
2.1 Introduction
The NLCEE was implemented based on the evolutionary environment proposed by [1] and [9]. The GA in [9] was developed in GALLOPS tool [12] and it was elaborated to generate IF-THEN classification rules in clinical databases. Fidelis et al.’s environment was applied in databases whose registers were characterized by patient’s data such as age, familiar historical and a series of specific symptoms. Our evolutionary environment, developed in the JavaR programming language,
was adapted to work with Gene Ontology data as done in [1]. Instead of only inducing linear IF-THEN rules as done in [1], in this new proposal the classi-fication system is capable of inducing non-linear IF-THEN rules, and this new characteristic has potential to improve results previously obtained in real world domain applications.
2.2 Linear and Non-linear distribution
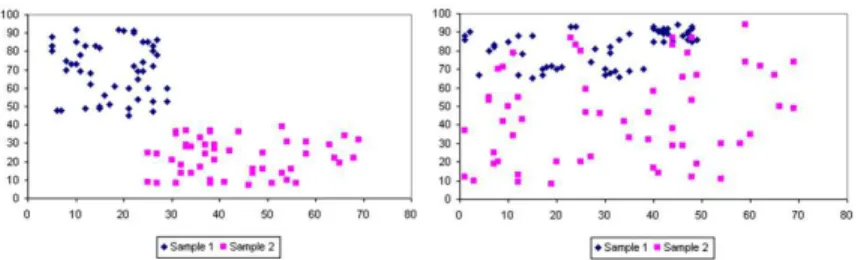
Two subsets X and Y are said to be linearly separable (LS) if there exists a hyperplaneP such that elements ofX andY lie on opposite sides ofP. If does not exist such a hyperplaneP, these subsets are labeled non-linearly separable (NLS). Figure 1 shows an example of LS and NLS set of points. Squares and lozenges denote the two classes [8].
Fig. 1.Linear and Non-Linear Distribution, respectively
The NLCEE can be applied in problems with linear and non-linear distribu-tions, building linear and non-linear high-level knowledge. The main character-istics of our Evolutionary Environment are detailed in the following subsections.
2.3 Dataset
The Gene Ontology (GO) dataset used in our work was generated based on the GO portal (http://www.geneontology.org/) [6]. To have a dataset suitable to our goals, we built an SQL statement selecting thirty five attributes from the seqdb database (go-lite files), distributed in three classes. The Biological Process (BP) class has 7,739 (59.12%) samples, the Cellular Component (CC) class has 1,293 (9.88%) samples and Molecular Function (MF) class has 4,059 (31.00%) samples, total of 13,091 samples. Each record in the database corresponds to a term deposited by a researcher in the GO environment. For more details see [1].
2.4 Individual Representation
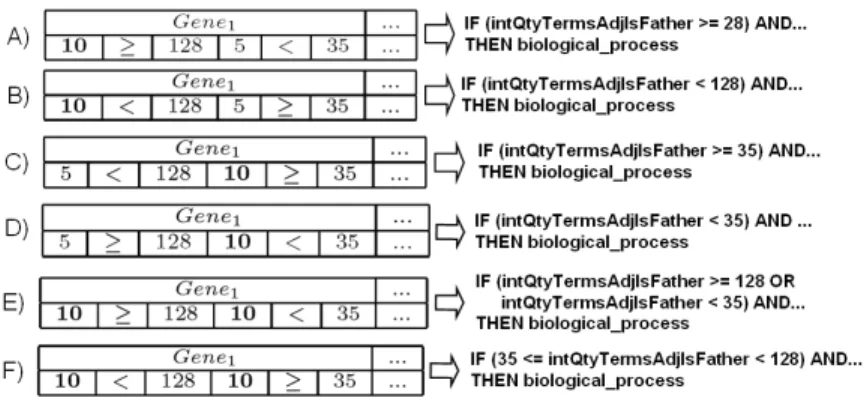
In our evolutionary environment, each individual is composed by thirty four (34) genes (N = 34, one for each attribute in the GO Database, expect strClass). The first gene of the individual corresponds to the first attribute found in the database and successively until all the attribute of the database are represented. An individual example is illustrated in Figure 2.
Fig. 2.Individual representation
1..10). It is important to say that this weight fields determine the insertion or the exclusion of the correspondent gene in the rule antecedent. If its values are less than a boundary-value this gene will not appear in the rule, otherwise the gene appears. In this work, after a preliminary parameter analysis, the value 9 was used as the boundary-value. The operator field can be<or ≥. If the W Li andW Riare larger than 9, andW Liis equal to<, thenW Ri is equal to≥, and vice-versa. The value fields are an integer or floating-point number that can vary between the minor and the larger value found in the database. Below, Figure 3 shows the possible settings for the individual, and the resultant rules for these individuals.
Fig. 3.Possible settings for the individual
2.5 Fitness Function (FF)
In general, the individual fitness quantifies its quality as a solution for the target problem. In this work, FF evaluates the quality of the rule associated to each individual. Some concepts must be explained before defining our FF. When a rule defined for the classification of a specific class C and is applied to a known case, four different types of results can be observed, depending on the class predicted by the rule and the true class of the case [15]: True Positive (tp), False Positive (fp), True Negative (tn) and False Negative (fn). Based on four possible results of a rule, the fitness function used in our evolutionary environment uses two indicators commonly used in medical domains, called sensitivity (Se) and specificity (Sp) which can be defined as follows:
Se= tp
(tp+f n) (1)
Sp= tn
(tn+f p) (2)
Using the sensitivity and specificity concepts, FF is defined as the combina-tion of these two indicators, SeeSp, as follows:
F itness= (Se+Sp)/2 (3)
The objective is to maximize, at the same time, Se as well as Sp. In each execution, the GA works in a binary classification problem, that is, when the GA is searching for rules to a given class C, all the other classes are grouped in one unique class (not C).
2.6 Genetic Operators and Parameters
Based on our experience, we tested various configurations to get the best en-vironments, such as: Population size(Pse): 50, 100 and 200; Generations(Ger): 50 and 100; Mutation rate: Individual(Mil): 5, 10, 20, 30 and 40 - Individual genes(Mig): 5, 10, 20 and 40; Weight field (Wgf): 5, 6, 7, 8 and 9.
Stochastic tournament with Tour of size 3 is used as the selection method for crossover. Two-point crossover with probability equal to 100% is applied to each couple of selected individuals generating two new ones. We also used an elitist reproduction strategy, where the best individual of each generation was passed unaltered to the next generation. We used 100 individuals, evaluate our GA per 100 generations, set the weight field to 9. The mutation rates (Mil and Mig) are equal to 40%.
3
Results
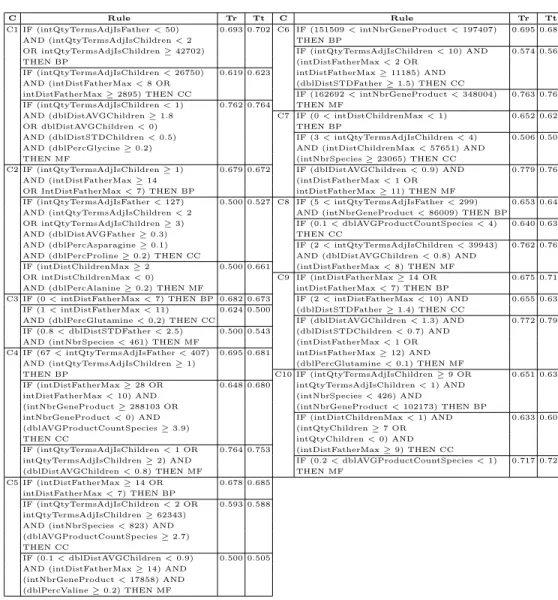
Table 1 shows the results obtained by our environment in a 10-fold cross-validation classification run. Each line of the table show each composition of the 10-fold cross validation. It is possible to see that values obtained for the Biological Pro-cess class are very similar, i.e. there are no big differences in results for each composition. Unfortunately, for Cellular Component and Molecular Function classes the values varied greatly. Also, we obtained an average precision of 0.676 (or 67.6%) using training data and 0.681 (or 68.1%) using test data for the bio-logical process class, 0.6 (or 60%) in training and 0.587 (or 58.7%) in test for the cellular component class and 0.682 (or 68.2%) in training and 0.705 (or 70.5%) in test for the molecular function class. These results are comparable with results published in [1] and other traditional classification methods [1].
Table 1.Precision of the results obtained in a 10-fold cross validation classification task
Biol. proc. Cell. comp. Mol. func. Composition Train Test Train Test Train Test 1111111110 0.693 0.702 0.619 0.623 0.762 0.764 1111111101 0.679 0.672 0.500 0.527 0.500 0.661 1111111011 0.682 0.673 0.624 0.500 0.500 0.543 1111110111 0.695 0.681 0.648 0.680 0.764 0.753 1111101111 0.678 0.685 0.593 0.588 0.500 0.505 1111011111 0.695 0.681 0.574 0.561 0.763 0.769 1110111111 0.652 0.628 0.506 0.507 0.779 0.766 1101111111 0.653 0.640 0.640 0.639 0.762 0.766 1011111111 0.675 0.712 0.655 0.634 0.772 0.791 0111111111 0.651 0.637 0.633 0.609 0.717 0.726
Average 0.676 0.681 0.600 0.587 0.682 0.705
Table 2.Rules obtained in C1-C10 compositions
C Rule Tr Tt C Rule Tr Tt
C1 IF (intQtyTermsAdjIsFather<50) 0.693 0.702 C6 IF (151509<intNbrGeneProduct<197407) 0.695 0.681 AND (intQtyTermsAdjIsChildren<2 THEN BP
OR intQtyTermsAdjIsChildren≥42702) IF (intQtyTermsAdjIsChildren<10) AND 0.574 0.561 THEN BP (intDistFatherMax<2 OR
IF (intQtyTermsAdjIsChildren<26750) 0.619 0.623 intDistFatherMax≥11185) AND AND (intDistFatherMax<8 OR (dblDistSTDFather≥1.5) THEN CC
intDistFatherMax≥2895) THEN CC IF (162692<intNbrGeneProduct<348004) 0.763 0.769 IF (intQtyTermsAdjIsChildren<1) 0.762 0.764 THEN MF
AND (dblDistAVGChildren≥1.8 C7 IF (0<intDistChildrenMax<1) 0.652 0.628 OR dblDistAVGChildren<0) THEN BP
AND (dblDistSTDChildren<0.5) IF (3<intQtyTermsAdjIsChildren<4) 0.506 0.507 AND (dblPercGlycine≥0.2) AND (intDistChildrenMax<57651) AND
THEN MF (intNbrSpecies≥23065) THEN CC
C2 IF (intQtyTermsAdjIsChildren≥1) 0.679 0.672 IF (dblDistAVGChildren<0.9) AND 0.779 0.766 AND (intDistFatherMax≥14 (intDistFatherMax<1 OR
OR IntDistFatherMax<7) THEN BP intDistFatherMax≥11) THEN MF
IF (intQtyTermsAdjIsFather<127) 0.500 0.527 C8 IF (5<intQtyTermsAdjIsFather<299) 0.653 0.640 AND (intQtyTermsAdjIsChildren<2 AND (intNbrGeneProduct<86009) THEN BP
OR intQtyTermsAdjIsChildren≥3) IF (0.1<dblAVGProductCountSpecies<4) 0.640 0.639 AND (dblDistAVGFather≥0.3) THEN CC
AND (dblPercAsparagine≥0.1) IF (2<intQtyTermsAdjIsChildren<39943) 0.762 0.766 AND (dblPercProline≥0.2) THEN CC AND (dblDistAVGChildren<0.8) AND
IF (intDistChildrenMax≥2 0.500 0.661 (intDistFatherMax<8) THEN MF
OR intDistChildrenMax<0) C9 IF (intDistFatherMax≥14 OR 0.675 0.712 AND (dblPercAlanine≥0.2) THEN MF intDistFatherMax<7) THEN BP
C3 IF (0<intDistFatherMax<7) THEN BP 0.682 0.673 IF (2<intDistFatherMax<10) AND 0.655 0.634 IF (1<intDistFatherMax<11) 0.624 0.500 (dblDistSTDFather≥1.4) THEN CC
AND (dblPercGlutamine<0,2) THEN CC IF (dblDistAVGChildren<1.3) AND 0.772 0.791 IF (0.8<dblDistSTDFather<2.5) 0.500 0.543 (dblDistSTDChildren<0.7) AND
AND (intNbrSpecies<461) THEN MF (intDistFatherMax<1 OR C4 IF (67<intQtyTermsAdjIsFather<407) 0.695 0.681 intDistFatherMax≥12) AND
AND (intQtyTermsAdjIsChildren≥1) (dblPercGlutamine<0.1) THEN MF
THEN BP C10 IF (intQtyTermsAdjIsChildren≥9 OR 0.651 0.637 IF (intDistFatherMax≥28 OR 0.648 0.680 intQtyTermsAdjIsChildren<1) AND
intDistFatherMax<10) AND (intNbrSpecies<426) AND
(intNbrGeneProduct≥288103 OR (intNbrGeneProduct<102173) THEN BP
intNbrGeneProduct<0) AND IF (intDistChildrenMax<1) AND 0.633 0.609 (dblAVGProductCountSpecies≥3.9) (intQtyChildren≥7 OR
THEN CC intQtyChildren<0) AND IF (intQtyTermsAdjIsChildren<1 OR 0.764 0.753 (intDistFatherMax≥9) THEN CC
intQtyTermsAdjIsChildren≥2) AND IF (0.2<dblAVGProductCountSpecies<1) 0.717 0.726 (dblDistAVGChildren<0.8) THEN MF THEN MF
C5 IF (intDistFatherMax≥14 OR 0.678 0.685 intDistFatherMax<7) THEN BP
IF (intQtyTermsAdjIsChildren<2 OR 0.593 0.588 intQtyTermsAdjIsChildren≥62343)
AND (intNbrSpecies<823) AND (dblAVGProductCountSpecies≥2.7) THEN CC
IF (0.1<dblDistAVGChildren<0.9) 0.500 0.505 AND (intDistFatherMax≥14) AND
(intNbrGeneProduct<17858) AND (dblPercValine≥0.2) THEN MF
genes each and good fitness values (62.3% and 63.4%, respectively). The C4 com-position resulted in good fitness value (68%, the best value) with three attributes in the induced rule. For Molecular function class, the C6 and C10 composition obtained good results. The rule have only one attribute and a great fitness value (76.9% and 72.6%, respectively). The C4 and C7 compositions obtained rules with two genes and good fitness values (75.3% and 76.6%, respectively). The best fitness value was found in C9 composition, with 79.1%.
Figure 3 shows the length of the rules induced in this work and in the ones presented in [1]. We obtained good results when compared to the previously published numbers for the same dataset. In average, our rules are 23% (1.6 against 2.1), 32.5% (2.7 against 4) and 44% (2.5 against 4.5) smaller than the rules published in [1], for Biological process, Cellular component and Molecular function, respectively.
Table 3.Rules length per composition: NLCEE and published in [1], respectively
NLCEE Published in [1]
Composition Biol. proc. Cell. comp. Mol. func. Biol. proc. Cell. comp. Mol. func.
1111111110 2 2 4 2 4 4
1111111101 2 5 2 1 6 5
1111111011 1 2 2 1 4 4
1111110111 2 3 2 3 4 4
1111101111 1 3 4 3 4 4
1111011111 1 3 1 3 2 3
1110111111 1 3 2 1 5 4
1101111111 2 1 3 3 2 5
1011111111 1 2 4 2 6 5
0111111111 3 3 1 2 3 7
Average 1.6 2.7 2.5 2.1 4.0 4.5
4
Final Remarks
As future works, we intend to keep focusing along these lines of investigation of improving classification rules set accuracy without sacrificing its comprehen-sibility and interpretability. In this sense, high-level knowledge can be induced, bringing insights to biological reasearch areas. Moreover, we intend to apply NLCEE in synthetic LS and NLS datasets to deeply verify its performance in a controlled environment (trying to identify and formaly define specific properties of the proposed method). In addition, we intend to proceed the investigation try-ing to incorporate ”never-endtry-ing learntry-ing” principles [5] to continuously improve the performance of evolutionary algorithms in the biological domain.
References
1. L. R. Amaral and E. R. Hruschka. Gene ontology classification: Building high-level knowledge using genetic algorithms. InIEEE WCCI/CEC. Barcelona, Spain, 2010. 2. L. R. Amaral, G. Sadoyama, F. S. Espindola, and G. M. B. Oliveira. Oncogenes classification measured by microarray using genetic algorithms. InIASTED Int. Conf. on AI and Appl., 2008.
3. A. Atiya. Learning with kernels: Support vector machines, regularization, opti-mization, and beyond. IEEE Trans. Neural Netw., 2005.
4. O. Bodenreider, M. Aubry, and A. Burgun. Non-lexical approaches to identifying associative relations in the gene ontology. InPacific Symp. on Biocomputing, 2005. 5. A. Carlson, J. Betteridge, B. Kisiel, B. Settles, E. R. H. Jr., and T. M. Mitchell. Toward an architecture for never-ending language learning. InProceedings of the Twenty-Fourth Conference on Artificial Intelligence (AAAI 2010), 2010.
6. T. G. O. Consortium. Gene ontology: tool for the unification of biology. Nature Genetics, 2000.
7. N. Cristianini and J. Shawe-Taylor. An Introduction to Support Vector Machines. Cambridge Univ. Press, Cambridge, U.K., 2003.
8. D. Elizondo. The linear separability problem: Some testing method.IEEE
TRANS-ACTIONS ON NEURAL NETWORKS, 2006.
9. M. V. Fidelis, H. S. Lopes, and A. A. Freitas. Discovery comprehensible classifi-cation rules with a genetic algorithm. InIEEE CEC 2000, 805-810. USA, 2000. 10. A. A. Freitas. Advances in Evolutionary Comp., chapter A Survey of Evolutionary
Algorithms for Data Mining and Knowledge Discovery. Springer-Verlag, 2002. 11. D. E. Goldberg. Genetic Algorithms in Search, Optimization and Machine
Learn-ing. Adison-Wesley, 1989.
12. E. D. Goodman. An introduction to gallops - the genetic algorithms optimized for portability and parallelism system. Technical report, Departament of Computer Science - Michigan State University, 1996.
13. D. Hand. Construction and Assessment If Classification Rules. John Wiley and Sons, Chichester, 1997.
14. J. R. Koza. Genetic Programming. On the Programming of Computers by Means of Natural Selection. MIT Press, 1992.
15. H. S. Lopes, M. S. Coutinho, and W. C. Lima. Genetic Algorithms and Fuzzy Logic Systems, chapter An evolutionary approach to simulate cognitive feedback learning in medical domain, pages 193–207. World Scientific, 1997.
![Figure 3 shows the length of the rules induced in this work and in the ones presented in [1]](https://thumb-eu.123doks.com/thumbv2/123dok_br/16913713.758570/14.918.216.712.468.635/figure-shows-length-rules-induced-work-ones-presented.webp)