(Annals of the Brazilian Academy of Sciences)
Printed version ISSN 0001-3765 / Online version ISSN 1678-2690 www.scielo.br/aabc
Biogeochemical processes and the diversity of Nhecolândia lakes, Brazil
TEODORO I.R. ALMEIDA1, MARIA DO CARMO CALIJURI2, PATRÍCIA B. FALCO2, SIMONE P. CASALI2, ELENA KUPRIYANOVA3, ANTONIO C. PARANHOS FILHO4,
JOEL B. SIGOLO1 and REGINALDO A. BERTOLO1
1Instituto de Geociências, Universidade de São Paulo, Rua do Lago, 562, 05508-080 São Paulo, SP, Brasil 2Escola de Engenharia de São Carlos, Universidade de São Paulo,
Avenida Trabalhador Sãocarlense, 400, 13566-590 São Carlos, SP, Brasil
3Institute of Plant Physiology, Russian Academy of Sciences, Botanicheskaya Street 35, Moscow, 127276, Russia 4Centro de Ciências Exatas e Tecnologia, Universidade Federal do Mato Grosso do Sul, Cidade Universitária,
Avenida Costa e Silva, 1524, 79000-060 Campo Grande, MS, Brasil
Manuscript received on February 17, 2010; accepted for publication on October 5, 2010
ABSTRACT
The Pantanal of Nhecolândia, the world’s largest and most diversified field of tropical lakes, comprises approximately 10,000 lakes, which cover an area of 24,000 km2 and vary greatly in salinity, pH, alkalinity, colour, physiography and biological activity. The hyposaline lakes have variable pHs, low alkalinity, macrophytes and low phytoplankton densities. The saline lakes have pHs above 9 or 10, high alkalinity, a high density of phytoplankton and sand beaches. The cause of the diversity of these lakes has been an open question, which we have addressed in our research. Here we propose a hybrid process, both geochemical and biological, as the main cause, including (1) a climate with an important water deficit and poverty in Ca2+in both superficial and phreatic waters; and (2) an elevation of pH during cyanobacteria blooms. These two aspects destabilise the general tendency of Earth’s surface waters towards a neutral pH. This imbalance results in an increase in the pH and dissolution of previously precipitated amorphous silica and quartzose sand. During extreme droughts, amorphous silica precipitates in the inter-granular spaces of the lake bottom sediment, increasing the isolation of the lake from the phreatic level. This paper discusses this biogeochemical problem in the light of physicochemical, chemical, altimetric and phytoplankton data.
Key words:Pantanal, alkaline lakes, saline lakes, cyanobacteria, alkalinization processes.
INTRODUCTION
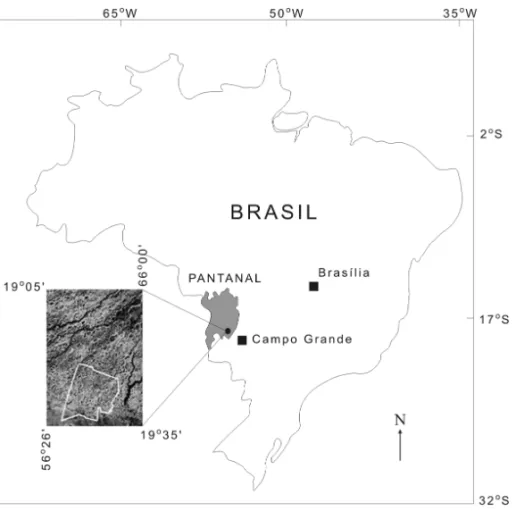
The Pantanal is the largest floodable surface on Earth,
covering approximately 200,000 km2(Fig. 1). It is
lo-cated in the Pantanal Basin (Almeida 1945), an inland tectonic depression that originated from tectonic inter-actions between the South American and Nazca Plates during the Late Tertiary (Assumpção 1998, Ussami et al. 1999). This basin has been filled by several allu-vial fans, generating quaternary sediments dominated by quartzose sands, with maximum thickness of approxi-mately 550 m (Assine 2004). The Pantanal is divided
Correspondence to: Teodoro Isnard Ribeiro de Almeida E-mail: [email protected]
into 11 sub-areas based on characteristics of seasonal floods, physiography and ecology (Silva et al. 1998). Two of these areas, Paiaguás and Nhecolândia, occupy almost the entire alluvial fan of the Taquari River, with
an area of 54,125 km2. This fan is a complex
depo-sitional system with an almost circular form approxi-mately 250 km in diameter, the largest on the planet (Assine 2004).
Nhecolândia, whose 24,000 km2area occupies the
Fig. 1 – Localisation of Pantanal and the studied area (modified from Galvão et al. 2003).
1100 mm, lower than the annual evapo-transpiration rate of 1400 mm (Por 1995). Lower Nhecolândia, which is the study area, corresponds to the oldest depositional lobe of the Taquari alluvial fan (Assine 2004). It is dis-tinguished from other sub-areas of the Pantanal by its uncommon physiography. This is characterised by the presence of seasonally flooded savannas limited by for-est fragments growing over elevations 1-3 m in height
(known locally ascordilheiras) and thousands of lakes
with high spatial, physical, chemical and biological vari-ability. These lakes are shallow, and are usually classi-fied according to their pH and electric conductivity (EC; Almeida et al. 2003), pH and salinity (Costa and Telmer 2007), size, degree of roundedness and orientation (E. Fernandes, unpublished data).
The saline lakes, locally named salinas, have
brackish-to-saline waters and basic pH (often above 10), are rarely deeper than 1 m, with an average depth of approximately 50 cm in the rainy season (Galvão et al. 2003), and rarely become dry. They are distin-guished by beaches devoid of vegetation ringed by
a fringe of carandas palm trees (Copernicia alba
Mo-rang) and Gramineae, which in turn is surrounded by carandas and Bromeliaceae popularly known as
“cara-guatá” (Aechmea spp.) and finally by the forest that
covers the cordilheiras. These elevations completely
surrounding the salinas protect them from the inflow
of water during the floods.
The hyposaline lakes, locally named baías, are
always devoid of beaches, have variable pH and low to-very-low salinity and can surpass 2 m in depth (Fur-quim et al. 2010), although most lakes are around 1 m in depth (Galvão et al. 2003). Aquatic vegetation is
common. While surrounded bycordilheiras, the
protec-tion of the inflow of waters can be only partial.
Caran-das are absent from thesecordilheiras, which have
an-other species of palm tree of equal importance,
popu-larly known asbocaiúva (Acrocomia aculeata Lodd),
which are absent from the cordilheiras that surround
evidence of geochemical erosion of sediments through
quartz dissolution and reprecipitation of SiO2as
amor-phous silica in the inter-granular spaces. This process occurs only in saline lakes, resulting in their location consistently below their hyposaline neighbours. The
depth of the baías increases from the margins to the
centre, unlike thesalinas, which have flat sub-horizontal
bottoms. This was interpreted by Almeida et al. (2009) as related to the interaction between the alkaline, silica-rich solutions and the weakly acidic water table.
The pH variation is very important, ranging from slightly acid to very basic (Almeida et al. 2003, Costa and Telmer 2007). The salinity also varies strongly, with values of up to 286 times in lakes in relatively restricted geographical areas, according to Costa and Telmer (2007). Considering the sodium content as an indicator of salinity, the maximum difference was 27,145-fold (Barbiero et al. 2008). Such differences
are essentially due to the greater isolation of the
sali-nasfrom phreatic recharge by continuous horizons of
greenish and grizzly soil of low porosity (Barbiero et al. 2008). Despite these different salinities, Barbiero et al. (2002) and Furquim et al. (2010) concluded that thesalinasandbaíaswaters belong to the same chem-ical family, excluding the possibility that the salinity is a legacy of past climatic periods. The isolation of the saline lakes is associated with high alkalinity, which helps to attack the quartzose sand and silt, supplying
silica (in solution probably as H3SiO−4 or H2SiO2−4 )to
precipitate Mg silicates (saponite and stevensite), illite and the amorphous silica cementing the grains of quart-zose sand. This has been well described by Barbiero et al. (2008) and Furquim et al. (2008).
The lakes of Nhecolândia have some similarity to the soda lakes of the East African Rift Valley, consid-ering the descriptions of Melack and Kilham (1974), Duckworth et al. (1996) and Jones et al. (1998). Like the Rift Valley lakes, the lakes of Nhecolândia have a water deficit (Por 1995, Barbiero et al. 2008). The
wa-ters are poor in Ca2+ and Mg2+(Barbiero et al. 2002,
Furquim et al. 2010), and there are frequent cyanobac-teria blooms and an increase in salinity during the dry season (De-Lamonica-Freire and Heckman, 1996, Oli-veira and Calheiros, 2000, Medina-Júnior and Rietzeler 2005). It is important to note that the hypothesis that
alkalinisation in the lakes of Nhecolândia originates from carbonate massifs has been completely discarded. A biogeochemical origin, as in the Rift Valley lakes, is the only remaining possible explanation.
De-Lamonica-Freire and Heckman (1996) de-scribed 337 planktonic species in the northern part of the Pantanal, verifying a dominance of cyanobacterial species in the dry season and their absence during floods. Because the region is subjected to an intensely dry period between May and October, these authors suggested that the high proliferation of cyanobacteria is associated with increases in salinity, but did not show a relation between the bloom of these organisms and pH, although there was a positive correlation with salinity, as is normal in alkaline lakes. In their quan-titative study of the plankton species of the Paraguay River and its flood plains, Oliveira and Calheiros (2000) identified 82 species. Similar to De-Lamonica-Freire and Heckman (1996), these authors found that Chloro-phyceae were prevalent and Cyanobacteriae were pres-ent only in the dry season. These studies confirm the general rule of nature, that the more severe the envi-ronmental conditions, the lower the biodiversity and the denser the population of surviving organisms (Sergeev et al. 2002) This explains the prevalence of cyanobacte-rial extremophiles in the saline waters of Nhecolândia, as observed in all prior studies (Oliveira and Calheiros 2000, Santos et al. 2004, Medina-Júnior and Rietzeler 2005, G. Mourão, unpublished data). The high evapo-ration rate during the dry season and the simultaneous
biochemical processes (mainly the absorption of CO2
from zooplankton predation; their accessory pigments such as phycobilins, which increase their capacity to ab-sorb solar electromagnetic radiation in the green wave-length; and their ability to control their buoyancy and thereby migrate through the water column to enhance their photosynthetic activity (Shapiro 1990). It has been observed that shallow lakes favour the development of
dense phytoplanktonic populations and that the salinas
are shallower than thebaías (Galvão et al. 2003). It is
evident that in Nhecolândia there is a correlation be-tween pH and salinity (Almeida et al. 2003, Galvão et al. 2003, Costa and Telmer 2007). This indicates that the alkalinisation and salinisation processes are inter-dependent. A correlation between salinity and phyto-planktonic activity has been described, but the possib-ility of cause and effect relationships among the alka-linity, salinity and phytoplanktonic activities has not been discussed in the literature.
The available data indicate that the Nhecolândia physiography arises from the complex and only partial-ly understood combination of biological, hydrological, climatic, sedimentary, geochemical and neotectonic pro-cesses. To explain the diversity of lakes, however, we propose a hybrid process based on the phytoplankton activity and hydrogeochemistry of the saline and hypo-saline lakes.
ALKALINE LAKES AND THE BIOGEOCHEMICAL PROCESSES INVOLVED
The geochemistry of calcium and its carbonates has a fundamental role in the preservation of the pH balance in waters: pH is increased through the dissolution of
carbonates (releasing HCO2−3 and CO2−3 species into the
water) and reduced through the precipitation of CaCO3
(removing CO2−3 from water). Hence, the condition of
neutral pH, that is conducive for most terrestrial or-ganisms, is attained in the presence of calcium, which stabilises the pH between 5.5 and 8.5 (Zavarzin 2002). According to this author, three routes of calcium cap-ture can be considered: (1) abiotic chemical precipita-tion of carbonates of calcium, caused by physical and chemical imbalance in the water, such as the saturation of the solution because of evaporation; (2) a biological route where the carbonate precipitation is caused by the alkaline barrier created by the activity of
microor-ganisms; and (3) direct precipitation in the construction of skeletons by intracellular mineralisation. The disso-lution of the carbonates is caused by reverse processes:
an increase in CO2concentration by respiration in the
oxygenated zone, or by the anaerobic generation of organic acids.
Soda lakes constitute the most natural alkaline envi-ronment on the planet, with pHs as high as 12. The
for-mation of such lakes requires low Ca2+and high Na2+
contents, tropical arid or semi-arid zones with a water deficit, and salinisation through evaporation. The in-crease in the alkalinity is due to the disequilibrium in
the CO2/ HCO−3/ CO2−3 system to CO2−3 arising from
the impossibility of precipitating CaCO3 (Duckworth
et al. 1996). The persistence of alkaline lakes, how-ever, requires a continuous process of alkalinisation to
annul the buffering effect of CO2 (Jones et al. 1998).
In agreement with McConnaughey and Whelan (1997), the most elementary mechanism of photosynthetic al-kalinisation of water results from the liquid capture of
CO2, leading to the concentration of CO2−3 and OH−.
If the water is oversaturated with CaCO3, precipitation
is induced biogeochemically, with a resulting drop in
pH to near neutrality and an enrichment of Na+ and
Cl− in the solution. By contrast, high primary
photo-synthetic productivity, mainly due to a dense cyanobac-terial population during blooms, will bring a decrease
in the dissolved HCO−
3 and thereby a biogenic
enrich-ment in CO2−3 . With a deficiency in Ca2+to precipitate
CaCO3, the pH necessarily rises (Visscher et al. 1998).
Thompson and Ferris (1990), using cultures of
Syne-chococcus, a cyanobacterium, demonstrated the pericel-lular precipitation of gypsum, calcite and magnesite parallel to an increase of the pH from 7.97 to 8.57 in 72 hours. This is a fast rate of alkalinisation, although
in the experiment there were Ca2+and Mg2+present to
minimise the pH increase.
Until recently, the enzyme carbonic anhydrase (CA) was known as an enzyme that catalyses the reversible
hydration of CO2 (CO2 + H2O ⇆ HCO−3 + H+) in
many eukaryotes. Close to the end of the 1990s it was discovered to be much more common and omnipresent in the domains of Archaea and Bacteria (Smith et al. 1999). Some eukaryotic algae can precipitate
cyanobacteria promote this activity only pericellularly. The internal pH of these organisms is neutral – their
CA promotes external alkalinisation by OH−excretion,
whereas fixing CO2 from HCO−3 generates
pericellu-lar CaCO3 precipitation (Kupriyanova et al. 2007). In
other words, cyanobacteria promote the intense capture
of inorganic carbon in the form of CO2 or HCO−3 not
only by photosynthetic activity during blooms (similar to other microorganisms), but also by the extra cellu-lar activity of CA, which alkalinises their environment. For this reason, these organisms are particularly effi-cient in raising the pH of the water. According to Kupri-yanova et al. (2007), the intensity of cyanobacterial CA activity is strictly controlled by pH, with a maximum at pH 9.8, which is the ideal pH for these organisms. Thus,
at pH>9.8 the CA probably becomes increasingly less
effective at raising alkalinity.
MATERIALS AND METHODS
Lakes were chosen for sampling using remote sensing images whose spectra were influenced by the phyto-plankton content (Galvão et al. 2003). Real-colour TM-Landsat 5 and AVNIR2-ALOS images were employed.
Three field campaigns were conducted to collect water samples in different seasons. Initially, these stud-ies were planned for the same group of lakes at the Rio Negro farm, but only one set of water samples could be collected there, so the other two sets were acquired from the neighbouring Barranco Alto farm. The first set of samples was collected from 18 to 25 August 2007, in the middle of a rigorous drought. The second collection period was from 10 to 19 July 2008, at the beginning of drought, as the rainy season had extended into June. The third was from 6 to 10 October 2008, at the end of the normal dry season, but in a less intense drought than that of August 2007.
The three different groups of data are independent, considering the dynamics of the environment. At the same time, it was possible to compare a sub-set of sam-ples, collected at two different climatic situations, from the same group of lakes. Finally, although the ensemble had problems (being sampled over two years), it is pos-sible to consider three sets of samples: those taken at the beginning (July 2008), the middle (October 2008) and the end of the dry season (August 2007).
The temperature of the water (◦C), the EC
(µS.cm−1), the dissolved oxygen (% and mg.L−1)and
the pH were measuredin situwith a multi-probe
instru-ment (Yellow Springer, 556 MPS). Samples of water were collected close to the centre of the lakes in poly-ethylene flasks, filtered with Millex filters with a 0.45 membrane and then frozen. The samples of the first campaign were taken to the Laboratory of Groundwa-ter Research Centre at the Institute of Geosciences of
São Paulo University (USP) for cations analysis. Na+
and K+ were analysed by flame photometry, and the
other cations by atomic absorption spectrophotometry. The samples from the two other collection sets were sent to Activation Laboratories (Toronto, Canada) for simi-lar cation analysis by ICP-OES or ICP-MS, according to the salinity identified in the field by EC. The anions were analysed by ion chromatography in the laborato-ries of the Engineering School of São Carlos (USP).
For the determination of phytoplankton, the water samples were collected and fixed with an acetic Lugol solution. The phytoplankton was counted using the sed-imentation method (Uthermohl 1958). From the
quant-itative analysis, the total density (organisms.mL−1)was
calculated according to the equation below (APHA 1995):
D(org/mL)= C×At
A f ×F×V
where
D=total density (organisms.mL−1);
C=number of organisms counted;
At=total surface area of the sedimentary bed (mm2);
A f =surface area of the field of counting (mm2);
F =number of counted fields;
V =volume of the sediment (mL).
The relative abundance was estimated considering the number of individuals of each species and the total number of individuals, according to the classification of McCullough and Jackson (1985): 50 to 100%, domi-nant organisms; 30 to 49%, abundant organisms; 10 to 29%, common organisms; 1 to 9%, occasional
organ-isms;<1%, rare organisms.
To determine the concentrations of chlorophyll a
and pheophytin, the samples were filtered through glass microfibre membranes (Millipore AP 20; 47 mm
TABLE I
Classification by EC (µS.cm−1) adopted for the lake waters studied and the approximate content of total dissolved solids (TDS)
calculated by the mean value reported in APHA (1995).
Classes of waters EC Approximated
(µS.cm−1) TDS (g.L−1)
Freshwater <100 <0.06
Water with low or average salinity 100 to 750 0.06 to 0.5 Water with high salinity 750 to 2250 0.5 to 1.4 Water with very high salinity 2250 to 5000 1.4 to 3.1 Hypersaline water >5000 >3.1
moment of extraction. Ethanol at 80% was used for the extraction. The spectrophotometric analysis of the ex-tracts was performed according to APHA (1995), and the reading was done between wavelengths of 665 and
750 nm. For the determination of chlorophylla(µgL−1)
and pheophytin (µg.L−1), the following formulas were
used as in Nush (1980):
Chlorophylla =29.6
× {(Eu665−Eu750)−(Ea665−Ea750)} (1) ×v/V ×s
Pheophytin=29.6
× {[1.7×(Ea665−Ea750)] −(Eu665−Eu750)} (2) ×v/V ×s
where:
Eu=absorbance of the unacidified sample;
Ea=absorbance of the acidified sample;
v=volume of the bed (mL);
V =volume of the filtered sample (L);
s=thickness of the cuvette (cm);
29.6=specific absorption coefficient of chlorophylla;
1.7=ratio of the yield of unacidified to acidified
chlo-rophylla.
The quantitative and qualitative analyses of the phy-toplankton and chlorophyll concentrations were done in the Laboratory of Biotoxicology of Continental Waters, of the USP School of Engineering, São Carlos campus.
The Rio Negro farm samples were given the gen-eral acronym RN, added to the lake code according to
the sampling order, and the letter “s” forsalinasor “b”
for baías. Samples from the Barranco Alto farm have only the BA acronym followed by the lake number. All
water samples were classified by their EC proportional to the salinity according to Table I, modified from the classification by USSL (1954).
RESULTS AND DISCUSSION
In August 2007 at the Rio Negro farm, water from 15 lakes was sampled for limnological and
hydrogeochem-ical analyses. Eight of these lakes weresalinas(EC>
750µS.cm−1). In July 2008, 28 lakes were sampled, of
which 14 weresalinas. In October 2008, 19 lakes were
sampled for hydrogeochemistry and 14 for
limnologi-cal analyses, of which seven were EC<750µS.cm−1
and 12 EC>2,000µS.cm−1. The results of the
chem-ical analyses showed that all the waters were extremely
poor in Ca2+and Mg2+but, in thesalinas,rich in Na+
and K+, as stated in the general literature (Zavarzin
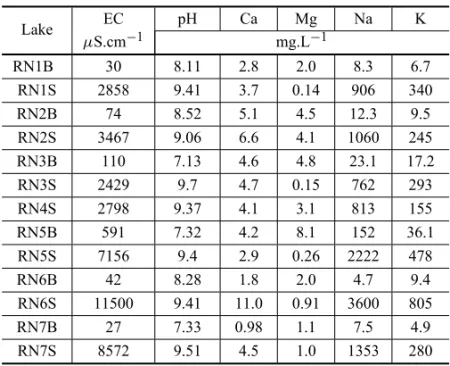
2002) and that on Nhecolândia (Barbiero et al. 2002, Furquim et al. 2008). Table II presents the results of the
August 2007 sampling, where the poverty in Ca2+and
Mg2+ions is clear. The independence of these cations
with regard to EC and pH is evident. The Na and K cations have a high correlation with EC, as expected,
it being almost perfect in the case of Na+if we ignore
sample RN7S (R2= 0.9997).
The fieldwork at the Barranco Alto estate, in July and October 2008 yielded similar results (Table III). For most of the water samples with a high pH, the con-tent of dissolved calcium was below the detection limit,
as expected, because, in these conditions, Ca2+
precipi-tates as CaCO3. It is important to observe that the high
Na+and K+content occurred only in the saline lakes
TABLE II
EC, pH and content in mg.L−1of Ca2+, Mg2+, Na+and K+ of samples from the Rio Negro farm lakes (August 2007).
Lake EC pH Ca Mg Na K
µS.cm−1 mg.L−1
RN1B 30 8.11 2.8 2.0 8.3 6.7
RN1S 2858 9.41 3.7 0.14 906 340
RN2B 74 8.52 5.1 4.5 12.3 9.5
RN2S 3467 9.06 6.6 4.1 1060 245
RN3B 110 7.13 4.6 4.8 23.1 17.2
RN3S 2429 9.7 4.7 0.15 762 293
RN4S 2798 9.37 4.1 3.1 813 155
RN5B 591 7.32 4.2 8.1 152 36.1
RN5S 7156 9.4 2.9 0.26 2222 478
RN6B 42 8.28 1.8 2.0 4.7 9.4
RN6S 11500 9.41 11.0 0.91 3600 805
RN7B 27 7.33 0.98 1.1 7.5 4.9
RN7S 8572 9.51 4.5 1.0 1353 280
material, 28 lakes (salinasandbaías) were sampled in
the first round and 19 in the second.
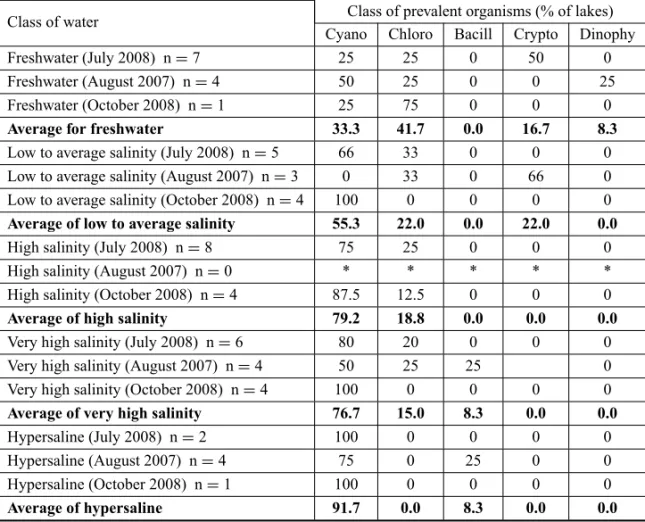
Table IV shows the percentages of lakes in relation to the classes of the prevalent phytoplanktonic organ-isms in each of the five classes of water as described in Table I. The 61 samples, as well as each contempora-neous set, confirm the conclusion of Oliveira and Cal-heiros (2000), Santos et al. (2004), Oduor and Schagerl (2007) and Santos and Sant’Anna (2010) that cyanobac-teria are more prevalent in more saline waters. When the results from the same groups of lakes sampled in July and October 2008 are compared, the seasonal vari-ations replicate the findings of other authors. The sam-pling of August 2007 does not represent a climatically intermediate situation, as indicated by the salinity and stable isotope data, possibly reflecting climatic differ-ences between 2007 and 2008. Two readings could be made from Table IV: the seasonal evolution and, for each sample collection, the distribution of classes of organisms as a function of salinity. For the July 2008 collection, a continuous increase in the proportion of cyanobacteria was observed in relation to the salinity. For the August 2007 sample collection, the distribution was irregular, though with a clear tendency towards the growing dominance of cyanobacteria in the high-salin-ity lakes. However, this does not give an intermediary
view between the sample collections of July and Octo-ber 2008. These data show the difficulty in comparing, for detailed observations, different lakes and sample col-lections from different years. We were surprised to find,
among the high salinity lakes, with EC>5000µS.cm−1,
a lake with a predominance of Bacillariophyceae rather than Cyanobacteriae. Finally, for the October 2008 col-lection, normally the most adverse situation because it would be at the end of the dry season, cyanobacteria were prevalent even in lakes with low-to-medium salin-ity. However, Chlorophyceae were dominant in a lake of high salinity. The seasonal tendency is clear for the sample collections taken from the same lakes; namely, there is an increase of cyanobacterial dominance dur-ing the dry season. In relation to the salinity, the water classes have the same tendency, with the prevalence of cyanobacteria in the most saline waters. Considering the number of genera and species (Table V), the tend-ency for the increase of cyanobacteria is continuous from the freshwater to very saline waters. However, there is an unexpectedly reduced presence of cyanobacteria in the hypersaline water class.
TABLE III
EC, pH and content in mg/L of Ca2+, Mg2+, Na+and K+of samples from the Barranco Alto farm lakes in July and October 2008.
Lake
First sampling (July 2008) Second sampling (October 2008) EC
pH Ca Mg Na K EC pH Ca Mg Na K
uS/cm mg/L mg/L mg/L mg/L uS/cm mg/L mg/L mg/L mg/L
BA01 25 6.02 1.4 0.8 2.1 3.6 36 7.89 1.7 0.848 1.53 4.27
BA02 113 7.09 4.3 2.3 12.4 13.6 161 8.35 4.6 1.62 22 17.5
BA03 172 7.77 4.6 2.6 22.3 17.9 229 8.77 6.3 1.95 40.1 19.8
BA04 77 4.88 2.5 0.6 22.8 5.4 – – – – – –
BA05 3185 9.3 <0.6 0.29 744 128 4567 9.21 <0.6 0.57 871 148 BA07 2932 9.31 <0.6 0.99 803 178 5641 9.6 <0.6 1.21 1130 250
BA08 27 5.89 0.7 0.4 5.2 3 – – – – – –
BA09 4140 9.44 <0.6 5.56 837 148 6607 9.67 <0.6 3.19 1330 198
BA12A 1045 8.71 <0.6 0.74 14.6 3.9 – – – – – –
BA12B 1160 8.98 7.4 2.15 0.448 98.2 – – – – – –
BA14 2517 9.49 <0.6 0.45 542 166 – – – – – –
BA16 3618 9.46 12 1.16 1320 359 8410 9.77 13 2.87 1680 430
BA21 7188 9.33 15 1.97 2730 324 16360 9.78 22 4.05 3340 799
BA22 5357 9.25 <0.6 1.69 1770 207 12870 9.67 <0.6 1.57 2410 597
BA23 40 6.74 2.8 0.8 9.6 5 79 5.69 3.4 0.956 13.7 6.63
BA24 1590.5 9.38 13 1.75 527 139 3976 10.06 11 2.8 843 159
BA25 710 9.28 <0.6 0.41 260 103 2317 9.68 <0.6 0.71 332 141
BA26 2671 9.5 12 1.41 980 227 6857 9.85 25 3.85 1540 342
BA27 10 6.5 0.6 0.4 2.8 2.8 67 6.9 2.5 0.98 5.72 5.37
BA30 81 7.69 5.9 2.3 16.2 19 225 6.35 2.2 0.867 15.8 37.7
BA31 95 6.5 2.1 1.08 18.2 34 170 8.69 6.8 2.73 14.5 20.2
BA32 154 7.74 5.5 3.2 35.9 29.5 – – – – – –
BA33 438 9.52 1.9 0.2 356 110 – – – – – –
BA34 1001 9 2.9 0.26 0.321 158 – – – – – –
BA35 780 9.09 <0.6 1.23 229 196 2032 9.45 <0.6 1 199 191 BA36 940 8.89 3.7 1.42 0.316 111 2116 9.19 <0.6 0.84 320 128 BA37 1750 9.28 <0.6 0.28 600 127 3940 7.98 <0.6 0.47 791 173
BA40 36 7.89 1.8 0.911 2.5 6.26 – – – – – –
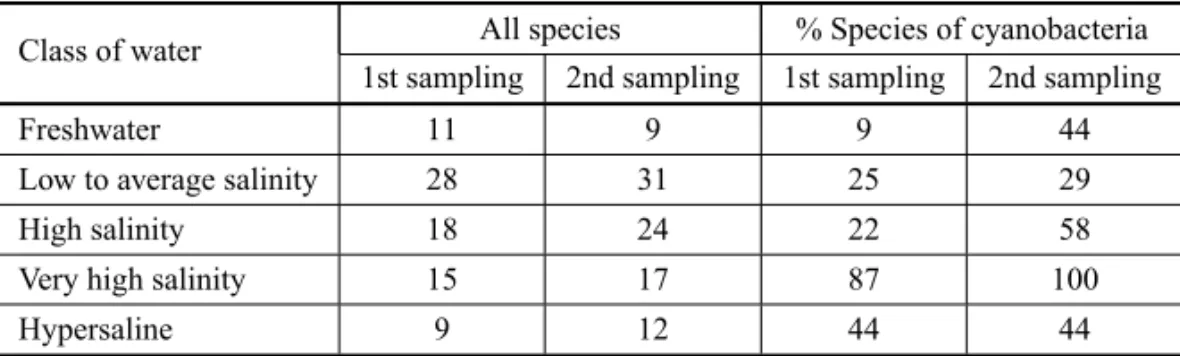
genera and species in the freshwater lakes could be because more complete limnological data were taken from only one freshwater lake, thereby artificially re-ducing the diversity. For the other classes, the pattern of diversity reduction with salinity increase is clear, above all when all data are considered. It is clear that this cyanobacteria association is more prevalent in more saline waters, except for the hypersaline class (Table VI and VII). In the latter, only cyanobacteria were expected, because they are extremophiles organ-isms, thus more adaptable at a hypersaline
TABLE IV
Distribution of the percentage of classes of prevalent phytoplankton organisms in relation to the total number of phytoplanktonic classes described for the groups of lakes classified according
to Table I. Cyanobacteria = Cyano; Chlorophyceae = Chloro; Bacillariophyceae = Bacill; Cryptophyceae = Crypto; Dinophyceae = Dinophy.
Class of water Class of prevalent organisms (% of lakes) Cyano Chloro Bacill Crypto Dinophy
Freshwater (July 2008) n=7 25 25 0 50 0
Freshwater (August 2007) n=4 50 25 0 0 25
Freshwater (October 2008) n=1 25 75 0 0 0
Average for freshwater 33.3 41.7 0.0 16.7 8.3
Low to average salinity (July 2008) n=5 66 33 0 0 0 Low to average salinity (August 2007) n=3 0 33 0 66 0 Low to average salinity (October 2008) n=4 100 0 0 0 0 Average of low to average salinity 55.3 22.0 0.0 22.0 0.0
High salinity (July 2008) n=8 75 25 0 0 0
High salinity (August 2007) n=0 * * * * *
High salinity (October 2008) n=4 87.5 12.5 0 0 0
Average of high salinity 79.2 18.8 0.0 0.0 0.0
Very high salinity (July 2008) n=6 80 20 0 0 0
Very high salinity (August 2007) n=4 50 25 25 0 Very high salinity (October 2008) n=4 100 0 0 0 0
Average of very high salinity 76.7 15.0 8.3 0.0 0.0
Hypersaline (July 2008) n=2 100 0 0 0 0
Hypersaline (August 2007) n=4 75 0 25 0 0
Hypersaline (October 2008) n=1 100 0 0 0 0
Average of hypersaline 91.7 0.0 8.3 0.0 0.0
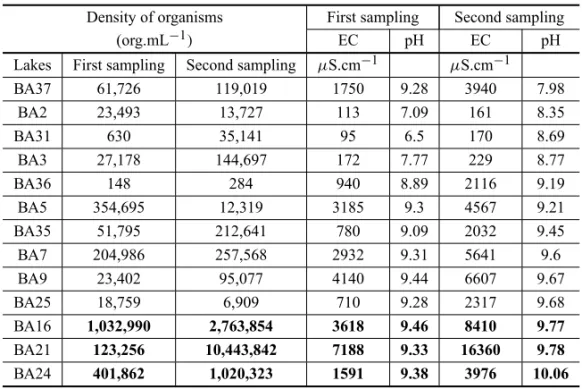
Analysis of the density of organisms in the two sample collections from the Barranco Alto farm with the EC and pH data (Table VIII) demonstrated two differ-ent behaviours. The freshwater lakes with the phreatic recharge had a small increase in salinity with increased pH, essentially because of the activity of microorgan-isms. The lakes with saline water had a pH increase re-lated to more intense activity of microorganisms, includ-ing blooms, but with a large increase in salinity because of evaporation. The greatest geochemical imbalance was caused by intense evaporation over lakes that are neces-sarily isolated from the water table. It was observed that:
(1) in the sample collections at the end of the dry
sea-son, three lakes showed cell densities>106;
(2) these lakes have higher pHs;
(3) the lakes with higher EC had a low density of or-ganisms at the beginning of the dry season and the greatest density at the end of dry season;
(4) the highest pH in the samples collected at the end of the dry season was related to an EC far lower
than that of the lakes with pH>9.
sim-TABLE V
Number of genera and species described by salinity of water classes adopted (G = Genus; sp = species).
Class of organisms
Class of water (all the lakes)
Freshwater Low to average High Very high Hypersaline salinity salinity salinity
Cyanobacteria G 8 9 15 23 6
sp 8 13 20 27 7
Chlorophyceae G 25 27 16 0 6
sp 33 44 17 0 6
Bacillariophyceae G 5 4 – 6 0
sp 5 4 0 6 0
Cryptophyceae G 2 3 9 0 3
sp 2 3 9 0 3
Dinophyceae G 1 2 0 1 0
sp 1 2 0 1 0
Chrysophyceae G 1 1 0 0 0
sp 1 1 0 0 0
Euglenophyceae G 3 3 0 3 0
sp 3 3 0 3 0
All the organisms G 45 49 40 33 15
sp 53 70 46 37 16
TABLE VI
Number of species of phytoplanktonic organisms observed in the lake samples from the Rio Negro farm and the relative percentage
of cyanobacteria. Sampling was done in August 2007.
Class of water All % Species of
species cyanobacteria
Freshwater (four lakes) 52 15
Low to average salinity (three lakes) 69 19 High salinity (five lakes) 46 43 Very high salinity (four lakes) 37 73
Hypersaline (two lakes) 16 44
TABLE VII
Species of phytoplankton observed in the lake samples from the Barranco Alto farm and the relative percentage of cyanobacteria. The first sample collection was done
in July 2008 and the second in October 2008.
Class of water All species % Species of cyanobacteria 1st sampling 2nd sampling 1st sampling 2nd sampling
Freshwater 11 9 9 44
Low to average salinity 28 31 25 29
High salinity 18 24 22 58
Very high salinity 15 17 87 100
TABLE VIII
Density of organisms, EC and pH of the samples of October 2008. The highest pHs are related to the highest density of organisms in extreme dryness
(bold characters and grey lines). Data ordered by pH of the second sampling. Density of organisms First sampling Second sampling
(org.mL−1) EC pH EC pH
Lakes First sampling Second sampling µS.cm−1 µS.cm−1
BA37 61,726 119,019 1750 9.28 3940 7.98
BA2 23,493 13,727 113 7.09 161 8.35
BA31 630 35,141 95 6.5 170 8.69
BA3 27,178 144,697 172 7.77 229 8.77
BA36 148 284 940 8.89 2116 9.19
BA5 354,695 12,319 3185 9.3 4567 9.21
BA35 51,795 212,641 780 9.09 2032 9.45
BA7 204,986 257,568 2932 9.31 5641 9.6
BA9 23,402 95,077 4140 9.44 6607 9.67
BA25 18,759 6,909 710 9.28 2317 9.68
BA16 1,032,990 2,763,854 3618 9.46 8410 9.77
BA21 123,256 10,443,842 7188 9.33 16360 9.78
BA24 401,862 1,020,323 1591 9.38 3976 10.06
ilar pattern to the average of all the lakes – 2.1 times), whereas the density of organisms increased 85 fold. This suggests that two processes act to increase the pH and alkalinity: one geochemical and other biogenic. Analysis of the densities of organisms in lakes BA16, BA21 and BA24 show that the latter had the highest pH of the group and the lowest density of organisms. The data could indicate that, in this case, the alkalini-sation was simply dominated by physicochemical pro-cesses, such as evidenced by the geochemical imbalance in evaporation. Another possibility is that when the pH attain the peak of 9.8, there are a fall in CA activity, reducing the productivity of these organisms. Both hy-potheses could explain a small increase in the cyano-bacterial population in the most alkaline lake, with a
pH>10, but the latter seems more convincing because
the EC of lake BA24 was not particularly high.
Arranging the data according to the population density of the organisms, the six lakes with density
>150,000 org.mL−1coincided with the five lakes with
the highest pHs and with five of the eight lakes with a
EC>750 gS.cm−1, indicating a significant correlation
(Table IX). By contrast, the lake with the highest EC had one of the lowest densities of organisms, and one of the lakes with the highest density of organisms had
one of the lowest ECs, an evidence that phytoplank-ton blooms are not strictly dependent on EC (or salin-ity). However, ordering the data by pH, the five high-est pHs were associated with five of the six highhigh-est mi-croorganism densities. Finally, in these two groups of independent data (the lakes from the Rio Negro and Bar-ranco Alto farms), the highest densities were linked to the highest salinities, suggesting that the most intense blooms occur in those lake waters more isolated from the phreatic zone. The fact that all the studied lakes with
pH>9.0 in October had very high salinity or
hypersalin-ity suggests a causal relationship between the processes of isolation and alkalinisation of these lakes.
In the August 2007 fieldwork data (Table X), there is an evident correlation between the chlorophyll and pheophytin pigments with pH. Considering that only cyanobacteria have pheophytin and that organisms of other classes were described in all the classes of wa-ter, the sum of these two pigments was considered more representative of the biogenic contribution to increased pH.
TABLE IX
Density of organisms, EC and pH of the August 2007 sampling. The data are ordered by pH on the left and by EC on the right. The highest pHs are related to
the highest density of organisms, and there is a greater independence from EC. The data showing the higher density of organisms, pH and EC are in bold characters.
Density of
EC Density of EC
Lake organisms pH Lake organisms pH
org.mL−1 µS.cm−1 org.mL−1 µS.cm−1
RN 3b 300 7.13 110 RN 7b 1100 7.33 27
RN 4b 900 7.17 286 RN 1b 12900 8.11 30
RN 5b 84800 7.32 591 RN 6b 3200 8.28 42
RN 7b 1100 7.33 27 RN 2b 164400 8.52 74
RN 1b 12900 8.11 30 RN 3b 300 7.13 110
RN 6b 3200 8.28 42 RN 4b 900 7.17 286
RN 2b 164400 8.2 74 RN 5b 84800 7.32 591
RN 8s 700 9.03 12593 RN 3s 649500 9.7 2429
RN 2s 2900 9.06 3467 RN 4s 1059 9.37 2798
RN 4s 1059 9.37 2798 RN 1s 150200 9.41 2858
RN 5s 423400 9.4 7156 RN 2s 2900 9.06 3467
RN 1s 15020 9.41 2858 RN 5s 423400 9.4 7156
RN 6s 5914600 9.41 11500 RN 7s 159400 9.51 8572
RN 7s 159400 9.51 8572 RN 6s 5914600 9.41 11500
RN 3s 649500 9.7 2429 RN 8s 700 9.03 12593
TABLE X
Pigments in phytoplankton (chlorophyllaand pheophytin),
pH and EC. Bold characters: samples with pH>9. The data are ordered by the sum of the chlorophylla+pheophytin values.
Lake Chla Pheo Chla+ pheo pH EC µg.L−1 µS.cm−1
RN 4b 4.44 4.37 8.81 7.17 286
RN 3b 2.22 6.59 8.81 7.13 110
RN 2b 10.36 2.07 12.43 8.52 74
RN 7b 14.06 7.44 21.50 7.33 27
RN 7s 21.90 4.20 26.10 9.51 8572
RN 1b 23.68 7.4 31.08 8.11 30
RN 6b 18.94 15.87 34.81 8.28 42
RN 2s 22.20 15.10 37.30 9.06 3467
RN 5b 22.69 18.06 40.75 7.32 591
RN 4s 29.60 18.75 48.35 9.37 2798
RN 8s 29.6 28.42 58.02 9.03 12593
RN 5s 51.06 10.06 61.12 9.4 7156
RN 3s 231.9 123.8 355.7 9.7 2429
RN 1s 237.9 120.9 358.87 9.41 2858
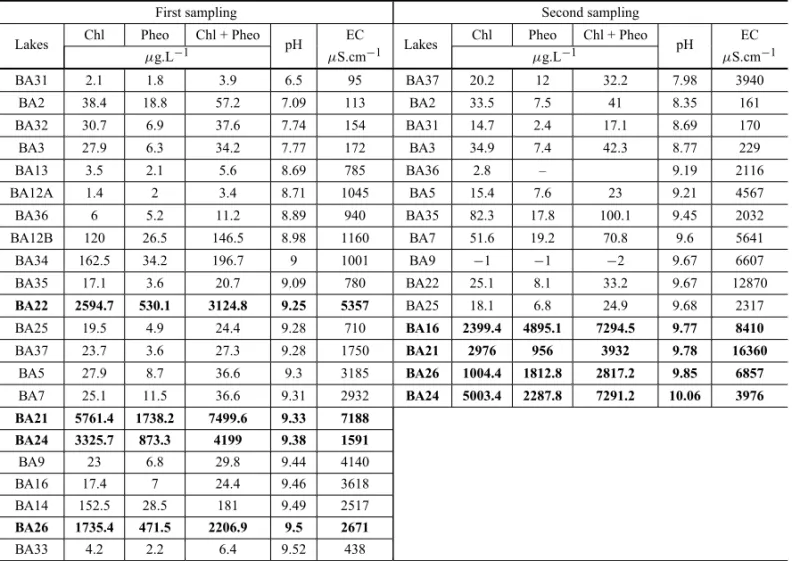
TABLE XI
Contents of chlorophylla, pheophytin, pH and EC of the samples collected in July (first sampling) and October 2008
(second sampling). Both tables are ordered by pH. Bold characters: the samples in which the sum of the pigment values is significant.
First sampling Second sampling
Lakes Chl Pheo Chl + Pheo pH EC Lakes Chl Pheo Chl + Pheo pH EC
µg.L−1 µS.cm−1 µg.L−1 µS.cm−1
BA31 2.1 1.8 3.9 6.5 95 BA37 20.2 12 32.2 7.98 3940
BA2 38.4 18.8 57.2 7.09 113 BA2 33.5 7.5 41 8.35 161
BA32 30.7 6.9 37.6 7.74 154 BA31 14.7 2.4 17.1 8.69 170
BA3 27.9 6.3 34.2 7.77 172 BA3 34.9 7.4 42.3 8.77 229
BA13 3.5 2.1 5.6 8.69 785 BA36 2.8 – 9.19 2116
BA12A 1.4 2 3.4 8.71 1045 BA5 15.4 7.6 23 9.21 4567
BA36 6 5.2 11.2 8.89 940 BA35 82.3 17.8 100.1 9.45 2032
BA12B 120 26.5 146.5 8.98 1160 BA7 51.6 19.2 70.8 9.6 5641
BA34 162.5 34.2 196.7 9 1001 BA9 −1 −1 −2 9.67 6607
BA35 17.1 3.6 20.7 9.09 780 BA22 25.1 8.1 33.2 9.67 12870
BA22 2594.7 530.1 3124.8 9.25 5357 BA25 18.1 6.8 24.9 9.68 2317
BA25 19.5 4.9 24.4 9.28 710 BA16 2399.4 4895.1 7294.5 9.77 8410
BA37 23.7 3.6 27.3 9.28 1750 BA21 2976 956 3932 9.78 16360
BA5 27.9 8.7 36.6 9.3 3185 BA26 1004.4 1812.8 2817.2 9.85 6857
BA7 25.1 11.5 36.6 9.31 2932 BA24 5003.4 2287.8 7291.2 10.06 3976
BA21 5761.4 1738.2 7499.6 9.33 7188 BA24 3325.7 873.3 4199 9.38 1591
BA9 23 6.8 29.8 9.44 4140
BA16 17.4 7 24.4 9.46 3618
BA14 152.5 28.5 181 9.49 2517
BA26 1735.4 471.5 2206.9 9.5 2671
BA33 4.2 2.2 6.4 9.52 438
with very high levels. In the July sample collection at the beginning of the dry season, there was no correla-tion between pigment content and pH, indicating that the action of the microorganisms during this period did not significantly influence the pH. For the samples col-lected in October 2008 at the end of the dry season, the samples with high pigment content corresponded to the highest pHs. The interpretation seems to be clear: the action of the phytoplanktonic organisms to increase the pH occurs in the dry season, concomitant to the blooms, as observed.
Evaporation, in an environment with a water defi-cit, will cause intense salinisation in the lakes isolated from phreatic recharge. Most of the lakes (those that remain with fresh water all year round) interact with the phreatic zone and thereby do not suffer an intense salinisation. The diversity of the lakes of Nhecolândia
in colouration (in the function of microorganisms), the presence or absence of sand beaches (the high salinity
of the salinas hinders the growth of Gramineae), the
presence of macrophytes (which do not survive in saline
waters) and the lower topographic level of thesalinas
in relation to the neighbouringbaíascould be explained
by the biogeochemical process presented here.
Chemical analyses of the water sampled in July and October of 2008 revealed negative values of satu-ration indexes for amorphous silica in all samples from the baías (Fig. 2), which indicates undersaturation of the solutions, and values close to zero for the samples
from thesalinas, indicating a predominant condition of
Fig. 2 – Stability of pH×amorphous silica (left) and quartz (right) diagram. Modified from Freeze and Cherry’s (1971).
quartz sand and a cement of amorphous silica, is ex-tremely impermeable. This promotes hydraulic isola-tion of the lake from the shallow and locally confined aquifer waters. Figure 2 also indicates that the amor-phous silica was in chemical equilibrium with the
wa-ter samples collected fromsalinas in July 2008, at the
beginning of the dry season. Samples taken in October 2008 (at the end of the dry season) had a higher con-tent of total dissolved solids, but lower concentrations of dissolved silica, as well as relatively lower saturation of amorphous silica, indicating that an removal of silica from the solution to the solid phase, during the monitor-ing period, probably occurred.
According Freeze and Cherry’s (1971) data, the saturation indexes for quartz have positive values (Fig.
2), both forsalinasandbaíassamples (except for three
baías samples), indicating that the mineral is mostly not dissolved. This observation is apparently discordant with the hypothesis that the geochemical erosion of
quartz insalinaswould explain their lower altitudes
rel-ative to these from hyposaline lakes, although the quartz dissolution may occur in physicochemical conditions not sampled in the survey, as solutions that precipitate
amorphous silica in the sand of thesalinasbottom.
Fur-thermore, the adopted model explains the data for all the various types of observations made in the study. These include the relative altitude of the saline and hyposaline lakes, the ratios of stable isotopes of O and H, the differences in salinity and the origin of the silica in solution and, in images from scanning
elec-tron microscopy of the sediments below salinas, amor-phous silica in the inter-grain spaces of the sediments under saline-alkaline lakes, corrosion figures at quartz grains and irregular grains surfaces in perfectly adjusted contact to each other. The authors have no alternative model to explain all the data from seven years of re-search in the region.
CONCLUSION
This paper presents an original interpretation of the origin of the diversity of Nhecolândia lakes, based on both geochemical and biogenic processes. The poverty
in Ca2+in the regional waters determines an imbalance
of the calcium cycle, because this ion is responsible for maintaining the neutral pH of most surface water on Earth. We propose that this geochemical process was the first to increase the alkalinity of these lakes, according to
a shift in the balance in the system CO2/ HCO−3/ CO2−3
to CO2−3 because of the inability to precipitate CaCO3.
The phytoplankton, mainly cyanobacteria, help to raise the pH by consuming inorganic carbon in the form of
CO2and, markedly, HCO−3 (which predominates in the
solution from pH>6), and by excreting OH−.
Originally the water in the lakes should have been fresh, lacking a basis for high salinity. During the evo-lution of these lakes, the biogeochemical process raised the pH of the water, facilitating the dissolution of quart-zose sand and silt. The silica-rich water (possibly as
H4SiO4)penetrated the sediments below the lake
the clasts. This precipitation could be caused by ex-cessive salinity (during extreme droughts) or drops in pH (due to contact with the water table). The repe-tition of this process, including the dissolution of the fraction of amorphous silica precipitated at the surface and of additional amounts of quartz (sand and silt), gradually increases the isolation of the lakes due to the precipitation of amorphous silica, which acts as a ce-ment between the grains of sand, allowing the genera-tion of high-salinity waters. Note that this repeated pro-cess will lead to a progressive lowering of the bed of the saline-alkaline lakes. The limit for this lowering may be the groundwater level in extreme drought, which ex-plains the horizontal bottom of the saline-alkaline lakes.
ACKNOWLEDGMENTS
The authors are grateful to Fundação de Amparo à Pes-quisa do Estado de São Paulo (FAPESP – Process 06/ 61052-4) and to Conselho Nacional de Desenvolvimen-to Científico e Tecnológico (CNPq – Process 483272/ 2007-8) for financing the project. Thanks to the land-lords of the Barranco Alto farm, Marina Schweizer and Lucas Leuzinger, for their enormous support and hos-pitality in the field.
RESUMO
O Pantanal da Nhecolândia é o maior e mais diversificado campo de lagos da região tropical do planeta, com cerca de 10.000 lagos de variadas salinidade, pH, alcalinidade, cor, fi-siografia e atividade biológica dispostos em uma área de 24.000 km2. Os lagos hipossalinos têm pH variável, baixa al-calinidade, macrófitas e baixa densidade de fitoplâncton. Os lagos salinos tem pH acima de 9 ou 10, elevada alcalinidade, alta densidade de fitoplâncton e praias de areia. A causa da diversidade desses lagos é uma questão ainda em aberto que é abordada nesta pesquisa. Propõe-se como principal causa um processo híbrido, geoquímico e biológico, baseado em (1) clima com um déficit hídrico importante e pobreza em Ca2+na água superficial e do freático e (2) na elevação do pH durante florações de cianobactérias. Estes dois aspectos desestabilizam a tendência geral de pH neutro para as águas superficiais da Terra. Este desequilíbrio resulta em aumento do pH e dissolução da areia quartzosa do fundo dos lagos salino-alcalinos. Durante secas extremas há precipitação de sílica amorfa nos espaços inter-granulares dos sedimentos de
fundo destes lagos, aumentando seu isolamento do freático. O artigo discute este processo biogeoquímico, à luz de dados físico-químicos, químicos, fitoplânctonicos e de altimetria de precisão.
Palavras-chave:Pantanal, lagos alcalinos, lagos salinos, cia-nobactérias, processos de alcalinização.
REFERENCES
ALMEIDAFFM. 1945. Geologia do sudoeste Matogrossense. Bol DNPM/DGM 116: 1–118.
ALMEIDA TIR, PARANHOS FILHO AC, ROCHA MM, SOUZAGF, SIGOLOJBANDBERTOLORA. 2009. Um estudo sobre as diferenças de altimetria do nível da água de lagoas salinas e hipossalinas no Pantanal da Nheco-lândia: um indicativo de funcionamento do mega sistema lacustre. Geociências 28: 401–415.
ALMEIDA TIR, SÍGOLO JB, FERNANDES E, QUEIROZ NETO JP, BARBIERO L AND SAKAMOTO AY. 2003. Proposta de classificação das lagoas da Baixa Nhecolân-dia-MS com base em sensoriamento remoto e dados de campo. R Bras Geoc 33: 83–90.
APHA– AMERICANPUBLICHEALTHASSOCIATION. 1995. Standard methods for the examination of water and waste-water. Springfield, USA, Byrd Prepress.
ASSINEML. 2004. Quaternary of the Pantanal, west-central Brazil. Quatern Int 114: 23–34.
ASSUMPÇÃOM. 1998. Focal mechanisms of small earth-quakes in the southeastern Brazilian shield: a test of stress models of the South American plate. Geophys J Int 133: 490–498.
BARBIEROL, QUEIROZNETOJP, CIORNEIG, SAKAMOTO AY, CAPELLARI B AND FERNANDES E. 2002. Geo-chemistry of water and ground water in the Nhecolândia, Pantanal of Mato Grosso, Brazil: Variability and associ-ated processes. Wetlands 22: 528–540.
BARBIEROL, REZENDEFILHOA, FURQUIMSAC, FURIAN S, SAKAMOTO AY, VALLESV, GRAHAMVRC, FORT M, FERREIRARPDANDQUEIROZNETOJP. 2008. Soil morphological control on saline and freshwater lake hy-drogeochemistry in the Pantanal of Nhecolândia, Brazil. Geoderma 148: 91–106.
COSTAMPFANDTELMERKH. 2007. Mapping and moni-toring lakes in the Brazilian Pantanal wetland using syn-thetic aperture radar imagery. Aquat Conservat Mar Freshwat Ecosyst 17: 277–288.
algal communities in the Pantanal of Mato Grosso, Brazil, with a comprehensive list of the known species and revi-sion of two desmid taxa. Int Rev ges Hydrobiol Hydrogr 81: 253–280.
DUCKWORTH AW, GRANT WD, JONES BE AND VAN STEENBERGENR. 1996. Phylogenetic diversity of soda lake alkaliphiles. FEMS Microbiology Ecol 19: 181–191. ESTEVESFA. 1998. Fundamentos de Limnologia. Rio de
Janeiro, Brazil, Interciência.
FREEZEAANDCHERRYJ. 1971. Groundwater. Englewood Cliffs, USA, Prentice Hall.
FURQUIM SAC, GRAHAM RC, BARBIERO L, QUEIROZ NETO JP AND VALLÈS V. 2008. Mineralogy and gen-esis of smectites in an alkaline-saline environment of Pantanal wetland, Brazil. Clays Clay Miner 56: 580–596. FURQUIM SAC, GRAHAM R, BARBIERO L, QUEIROZ NETOJPANDVIDAL-TORRADOP. 2010. Soil mineral genesis and distribution in a saline lake landscape of the Pantanal wetland, Brazil. Geoderma 154: 518–528. GALVÃO LS, PEREIRA FILHO W, ABDON MM, NOVO
EMLM, SILVA JSVEANDPONZONI FJ. 2003. Spec-tral reflectance characterization of shallow lakes from the Brazilian Pantanal wetlands with field and airborne hyper-spectral data. Int J Remote Sens 24: 4093–4112. JONES BE, GRANTWD, DUCKWORTH AWAND
OWEN-SONGG. 1998. Microbial diversity in soda lakes. Ex-tremophiles 2: 191–200.
KUPRIYANOVAE, VILLAREJOA, MARKELOVAA, GERA-SIMENKOL, ZAVARZING, SAMUELSSONG, LOSDA AND PRONINA N. 2007. Extracellular carbonic anhy-drases of the stromatolite-forming cyanobacterium Micro-coleus chthonoplastes. Microbiology 153: 1149–1156.
MCCONNAUGHEYTAANDWHELANJ F. 1997. Calcifica-tion generates protons for nutrient and bicarbonate up-take. Earth-Sci Rev 42: 95–117.
MCCULLOUGHJDANDJACKSONDW. 1985. Composition and productivity of the benthic macroinvertebrate com-munity of a subtropical reservoir. Int Rev Ges Hydrobiol Hydrogr 70: 221–235.
MEDINA-JÚNIORPBANDRIETZELERAC. 2005. Limno-logical study of a Pantanal saline lake. Braz J Bio 65: 651–659.
MELACK JMANDKILHAMP. 1974. Photosynthetic rates of phytoplankton in East African alkaline, saline lakes. Limnol Oceanogr 19: 743–755.
NUSHEA. 1980. Comparisons of different methods for chlo-rophyll and phaepigment. Arch Hydrobiol 14: 14–36. ODUOR SOANDSCHAGERLM. 2007. Temporal trends of
ion contents and nutrients in three Kenyan Rift Valley saline-alkaline lakes and their influence on phytoplankton biomass. Hydrobiologia 584: 59–68.
OLIVEIRAMDANDCALHEIROSDF. 2000. Flood pulse in-fluence on phytoplankton communities of the south Pan-tanal floodplain, Brazil. Hydrobiologia 427: 101–112. PORFD. 1995. The Pantanal of Mato Grosso (Brazil). World’s
Largest Wetlands. London, UK, Kluwer Academic Pub-lisher.
SANTOS KRS, SAKAMOTO AY, NETO MJ, BARBIERO L ANDQUEIROZNETOJP. 2004. Ficoflora do Pantanal da Nhecolândia, MS, Brasil: um levantamento preliminar em três lagoas alcalinas e uma salitrada. In: SIMPÓSIO SO-BRERECURSOSNATURAIS ESÓCIO-ECONÔMICOS DO PANTANAL, 4, Corumbá, Brazil. Proceedings... Brasília: EMBRAPA, 2004, CD ROM.
SANTOSKRSANDSANT’ANNACL. 2010. Cianobactérias de diferentes tipos de lagoas (“salina”, “salitrada” e “baía”) representativas do Pantanal da Nhecolândia, MS, Brasil. Rev Bras Bot 33: 61–83.
SERGEEV VN, GERASIMENKO LMAND ZAVARZIN GA. 2002. The Proterozoic history and present state of cyano-bacteria. Microbiologia 71: 623–637.
SHAPIROJ. 1990. Currents beliefs regarding dominance by blue-greens: the case of the importance of CO2and pH. Verh Internat Verein Theor Angew Limnol 24: 38–54. SILVAJSV, ABDONMM, BOOCKAANDSILVAMP. 1998.
Delimitation of the Brazilian Pantanal and its sub-regions. Braz J Agric Res 33: 1703–1713.
SILVALHS, DAMAZIOCMANDIESPAAAC. 2008. Identi-ficação de Cianobactéricas em Sedimentos da Lagoa Pitanguinha, Estado do Rio de Janeiro, Brasil. Anu Inst Geoc 31: 11–16.
SMITHKS, JAKUBZICKC, WHITTAMTSANDFERRYJG. 1999. Carbonic anhydrase is an ancient enzyme wide-spread in prokaryotes. PNAS 96: 15184–15189. THOMPSONJBANDFERRISFG. 1990. Cyanobacterial
pre-cipitation of gypsum, calcite, and magnesite from natural alkaline lake water. Geology 18: 995–998.
TILMAN DL. 1977. Resource competition between phy-toplanktonic algae: an experimental and theoretical ap-proach. Ecology 58: 338–348.
USSL – UNITEDSTATESSALINITYLABORATORY. 1954. Diagnosis and improvement of saline and alkali soils. Washington, USA, U.S. Dept Agricult.
UTHERMOHL H. 1958. Zur Vervolkommung der quanti-tative Phytoplankton-Methodik. Mitteilungen. Internat Verein Limnol 9: 1–38.
VISSCHERPT, REIDPR, BEBOUTBM, HOEFTSE, MAC-INTYREIGANDTHOMPSONJRJA. 1998. Formation of lithified micritic laminae in modern marine stromatolites (Bahamas); the role of sulfur cycling. Am Mineral 83: 1482–1493.
WESTALL F. 2005. Life on the early earth: a sedimentary view. Science 308: 366–367.