DOI: 10.4301/S1807-17752011000200007
_____________________________________________________________________________________ Recebido em/Manuscript first received: 08/03/2010 Aprovado em/Manuscript accepted: 20/07/2010 Endereço para correspondência/ Address for correspondence
Luís Kalb Roses, Catholic University of Brasília – Master Program in Knowledge and Information Technology Management - SGAN 916 Norte, Módulo B, Sala A125, 70790-160, Brasília (DF), Brazil. Telefone: 55 (61) 34487182. E-mail: [email protected].
ISSN online: 1807-1775
Publicado por/Published by: TECSI FEA USP – 2011
ANTECEDENTS OF END-USER SATISFACTION WITH AN ERP
SYSTEM IN A TRANSNATIONAL BANK
:EVALUATION OF USER
SATISFACTION WITH INFORMATION SYSTEMS
Luís Kalb Roses
Catholic University of Brasilia – Brasilia, Brazil
__________________________________________________________________________________
ABSTRACT
The main objective of this study is to identify the antecedents of end-user satisfaction with an Enterprise Resource Planning (ERP) system, in the context of a transnational Bank. The Information System (IS) success theory is applied for the end-user computing satisfaction (EUCS) assessment. Quantitative data is analyzed through multivariate statistical techniques whereas qualitative data is analyzed through content analysis technique. The results indicate that the EUCS model is pertinent to the context of ERP systems for a fast data collection and overall perception of user satisfaction; nevertheless it is suggested the continuity of its evaluation in other research contexts and additional categories should be considered as antecedents to IS end-user satisfaction.
Keywords: ERP system, information system success, end-user satisfaction, system quality, information quality.
1. INTRODUCTION
Chain Management (SCM), and Supplier Relationship Management (SRM) are among the ERP solutions offered by software suppliers.
According to Arc Advisory (2009), the worldwide market for enterprise applications is expected to grow US$43 billion by 2011, what represents a compounded annual growth rate of 8.3 percent over the next five years. The ERP market is worth US$18 billion and is expected to reach US$25 billion by 2011 at a compounded annual growth rate of 6.7 percent. These numbers reflect the need of enterprises to reengineer their processes through the adoption of an ERP, integrating them, as well as becoming more business focused and competitive. Supporting the adoption of an ERP, the market (ERP suppliers) is assumed to have competence in offering the appropriate technology for the main organization processes. Diverse sectors like health, tourism, transport, education, government, banking, etc., are users of ERP solutions.
Despite the significance of the business opportunities that these data suggest, the ERP client-supplier relationship is not always an easy and simple task. According to Rockford Consulting Group (2009), more than 60% ERP implementations historically fail. While most studies have focused on the factors related to the adoption, unsuccessful implementations, or even in identifying approaches for a better ERP implementation (Huang, Chen, Hung, & Ku, 2004; Ioannou & Papadoyiann, 2004), few have been dedicated to evaluate the perception of its users (Yang, Ting, & Wei, 2006).
In this sense, this study explores the end-user satisfaction with an ERP, in the context of six European branches of a South American transnational bank, with the purpose to answer the following question: What are the antecedents of end-user satisfaction with a bank ERP? For this, the main objective of this work was to assess the end-user satisfaction regarding a strategic ERP system, which has been used for more than eight years by those branches. The Doll, Deng, Raghunathan, Torkzadeh and Xia (2004) End-User Computing Satisfaction (EUCS) model was adopted. The validity of EUCS model was tested as a secondary objective of this study, along with the identification of opportunities for its improvement.
2. END-USER SATISFACTION IN ERP SUCCESS
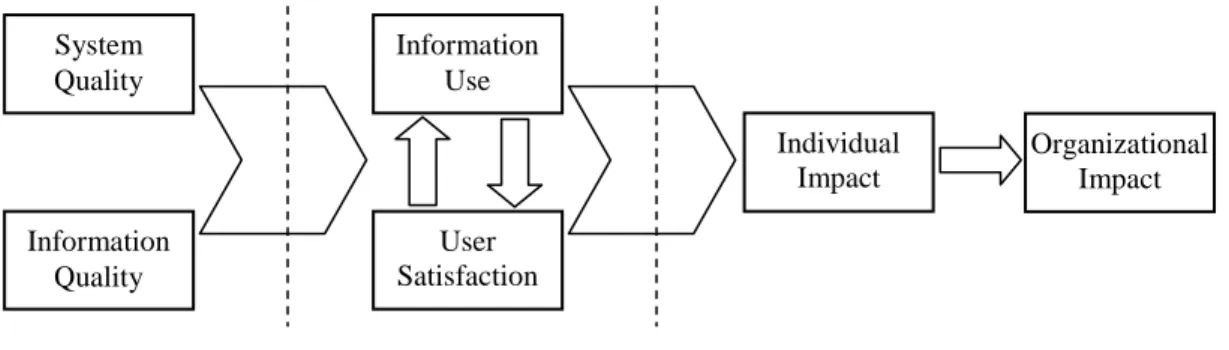
Looking for the dependent variable of IS success, DeLone and McLean (1992) identified six categories: system quality, information quality, information use, user
satisfaction, individual impact, and organizational impact. Through these categories,
they proposed a model for IS success with a process type approach, as illustrated in Figure 1, instead of treating them independently. According to the model, system
quality and information quality, singularly or jointly, affect positively or negatively information use and user satisfaction. Moreover, the amount of information use can
affect user satisfaction, as well as the contrary, the latter affecting the former. They also posited that information use and user satisfaction are direct antecedents of
individual impact, which would suggest some organizational impact.
used this perspective to some extent to assess IS success based on the DeLone and McLean model (Zviran, Pliskin, & Levin, 2005; Nelson & Wixom, 2005), where user
satisfaction category was reported as the one of the most researched (Ives, Olson, &
Baroudi, 1983; Baroudi & Orlikowski, 1988; Chang & King, 2000; Adamson & Shine, 2003; Doll et al., 2004; Wixom & Todd, 2005). Chin and Lee (2000, p. 554) define
end-user satisfaction with an IS as an “overall affective evaluation an end-user has
regarding his or her experience related with the information system [IS]”, being both IS use and other activities related (e.g., training, participation or involvement in development or selection) “of value in predicting subsequent behavior (e.g., utilization) or performance”.
Figure 1 – IS Success Model
Source – DeLone and McLean (1992)
The real-time environment of current IS applications is characterized by end-users interacting with them directly to input data as well as making queries (search for data) for specific decision making purposes. In this environment, end-users assume more responsibility in operating these applications and, as a consequence, they obtain an adequate perception about how they are served by them. This perception is extended to management level personnel who do not necessarily interact directly with the applications, but are mainly end-users of the information produced by them to run the business. The first kind of user would be characterized by Doll and Torkzadeh (1988) as a computing user, while the latter an information user. They also defined end-user
computing satisfaction (EUCS) as an “affective attitude towards a specific computer
application by someone who interacts with the application directly” (p. 260), definition that can be adapted to information user regarding the information they receive from the application.
The Information quality category is associated with the output of an IS (Yang et al., 2006), be the data on paper, electronic file or even on a monitor screen; while
system quality category refers to the system that processes the information required to
output, which represents user perceptions about his or her interaction with the system during the tasks performed (Nelson & Wixom, 2005). Individual impact category is the effectiveness of the IS in decision making by users, helping their understanding, problem identification, learning, etc., predicting the organizational impact category in terms of cost reductions, productivity gains, increased market share, return on investment or assets, staff reduction, etc. (DeLone & McLean, 1992).
System Quality
Information Quality
Individual Impact
Organizational Impact Information
Use
For the six categories presented in the IS Success Model, DeLone and McLean (1992, p. 88) recommended “further development and validation before it could serve as a basis for the selection of appropriate I/S [IS] measures. In the meantime, it suggests that careful attention must be given to the development of I/S [IS] success installments”. That’s what this study is all about as it evaluates end-user computing satisfaction with an ERP system.
3. METHODOLOGY
The descriptive-exploratory survey strategy was developed with the objective to investigate a contemporary organizational phenomenon, which is complex and non dissociable from its real-life context. The site was six European branches of a large retail South American bank whereas the unit of analysis was the end-user satisfaction with an ERP system adopted for process automation of these branches.
The selection of the bank (assets over US$500 billion and among the 10 largest American banks) in the context of the ERP used by its European branches resulted from: a) the ERP is viewed as a strategic tool in the management of internal processes and business performance of the branches; b) the license contract with the ERP supplier being more than US$2 million; c) the same ERP automates the six branches in six different countries, which creates an opportunity for a wider perception of the system; d) ERP is a market leader; e) ERP has been used by the branches for more than eight years, a situation which allows for a deeper perception of the end-users; and f) authorization of the bank to develop this research.
3.1 DATA COLLECTION AND INSTRUMENT
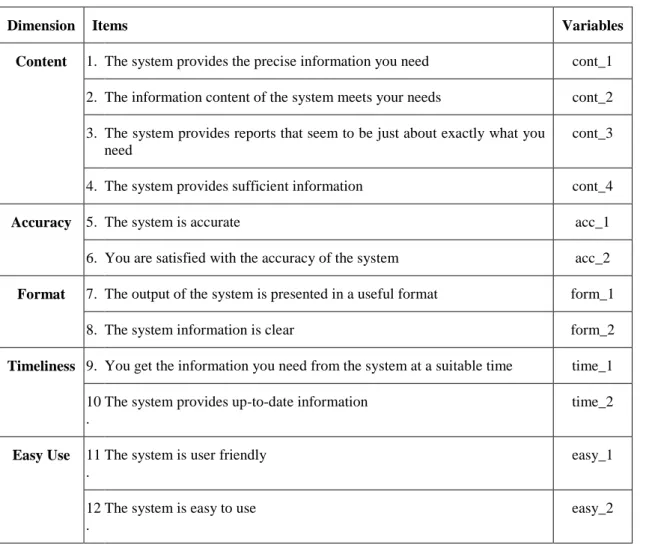
Data collection process took place in the period between December 8th 2005 and January 20th 2006. The survey used the EUCS instrument from Doll et al. (2004), which has 12 items distributed in five dimensions (see Table 1), where the corresponding variables treated in this study were also associated. Content, accuracy, and format can be considered constructs (or dimensions) of information quality, as they refer to the output of the IS; while timeliness and easy use to system quality, timeliness being partially related to information quality as it evaluates the currency of information (if it is up-to-date).
The Doll et al. (2004) model seems to be very appropriate for the objectives of this study as it has been “widely used and cross validated to measure a user’s satisfaction with a specific application”, evaluating in few items aspects of information and system quality dimensions shared by other models that use more extensive items (Rivard, Poirier, Raymond, & Bergeron, 1997; Nelson & Wixom, 2005). In this sense, the model facilitates data collection for a fast overall perception, besides being considered a “surrogate for system success” (p. 229) from the user satisfaction standpoint, which is the focus of this paper.
to Hair, Anderson, Tatham, & Black (1998, p. 186-187), “the more points you use, the higher the precision you will obtain with regards to the intensity with which the person agrees or disagrees with the statement". The results of Cronbach's Alpha (see Table 4) show that the internal consistency of the scale was maintained, which assured the reliability of the instrument.
The instrument also aggregate an item (variable satisf) to evaluate the overall satisfaction of the respondent with the ERP system (“You are satisfied with the system”), using the same scale interval as the prior 12 items, besides an open-ended question (“Below, feel at ease to write any commentaries you’d like to do regarding your use of the system”), aiming to obtain general perceptions of the respondent about the ERP system. For Patton (2002, p. 21), the purpose of this question is to “enable the researcher to understand and capture the points of view of other people without predetermining those points of view through prior selection of questionnaire categories”. In this sense, the open-ended question provided flexibility and openness to respondent exposure about his or her points of view relating to the ERP system, which enhanced the richness of the research.
Table 1 – The Five Dimensions of End-User Computing Satisfaction
Dimension Items Variables
Content 1. The system provides the precise information you need cont_1 2. The information content of the system meets your needs cont_2 3. The system provides reports that seem to be just about exactly what you
need
cont_3
4. The system provides sufficient information cont_4
Accuracy 5. The system is accurate acc_1
6. You are satisfied with the accuracy of the system acc_2 Format 7. The output of the system is presented in a useful format form_1
8. The system information is clear form_2
Timeliness 9. You get the information you need from the system at a suitable time time_1 10
.
The system provides up-to-date information time_2
Easy Use 11 .
The system is user friendly easy_1
12 .
The system is easy to use easy_2
Closing the instrument, a demographic item (variable demogr) asked about the length of time the respondent had interacted with the system (less than 1 year, between 1 and 3 years, between 3 and 5 years, and more than 5 years). The instrument was pre-tested respecting the content of the 12 EUCS items, even in relation to the English language, which is considered a common language in the six branches. No difficulty or suggestion for modification was reported, which can be viewed as a result of past validation of the EUCS instrument.
3.2 SAMPLE AND DEMOGRAPHIC PROFILE
The sample was formed by the end-user computing employees of the branches, whose tasks are executed in direct interaction with the ERP system. The survey instrument was sent by e-mail to the branch executive managers who asked the employees to respond. A total of 63 responded instruments distributed in the six branches were collected electronically and returned by e-mail.
The demographic profile of the respondents is showed in Table 2, where the quantity (Qty) per branch is also shown. Only one respondent from the BRAN-5 branch participated in the survey, while BRAN-2 branch had the most participants (20). Moreover, there is a major concentration of respondents with more than five years’ experience (58.5%) in using the ERP system. Considering a population of around 100 respondents in the branches researched, the sample was considered representative as it reached 63% of the total, showing characteristics of independence and randomness in their selection from the researcher standpoint.
Table 2 – Time of the end-user with the IS
Branch
< 1 year 1 - 3 years 3 – 5 years > 5 years Total
Qty % Qty % Qty % Qty % Qty %
BRAN-1 - - 1 11.1 - - 8 88.9 9 100
BRAN-2 2 10.0 7 35.0 4 20.0 7 35.0 20 100
BRAN-3 2 15.4 2 15.4 1 7.7 8 61.5 13 100
BRAN-4 - - - 9 100.0 9 100
BRAN-5 - - - - 1 100.0 - - 1 100
BRAN-6 2 18.2 2 18.2 2 18.2 5 45.5 11 100
4. RESULTS AND ANALYSIS
Two main methods of analysis were applied to the data collected: structural equation modeling (SEM) and content analysis (CA). The first, a second generation statistical technique, was used with the purpose of confirmatory factor analysis (CFA) of the EUCS model. The second was applied to qualitative data (text) from the open-ended question.
4.1 STRUCTURAL EQUATION MODELING
SEM is a technique to examine a series of dependence relationships at the same time, which is attractive for two main reasons (Hair et al., 1998): a) it deals with multiple relationships simultaneously while providing statistical significance; and b) it assesses the relationships comprehensively and provides a transition from exploratory to confirmatory analysis. This study intends to present the confirmatory analysis as it works with a validated model (Doll & Torkzadeh, 1988). Before this, it was analyzed the quality of the data.
4.1.1 DATA QUALITY ANALYSIS
As recommended before, the application of any multivariate data analysis technique aiming at a better prediction and more accurate dimensionality measuring (Kline, 1998), the quality assessment of the data collected was evaluated in terms of missing data, outliers, and assumptions of multivariate analysis. The SPSS™ software was used in the analysis of data quality.
Missing data per variable stayed below the conservative limit of 5% (Tabachnik & Fidell, 2001), one being identified as missing in time_2 and in demogr variables, which were estimated by the expectation-maximization method. No outlier with either a univariate, bivariate, or multivariate perspectives was identified. From a univariate perspective, the cases remained outside the limit of 2.5 standard deviations, considering a sample of fewer than 80 cases (Hair et al., 1998). From a bivariate perspective, when the combinations of two variables were analyzed through scatterplots (dispersion graphics), there was no observation that could be considered for deletion. Nor from a multivariate perspective, as the Mahalanobis distance (D2) didn’t indicate any case with a D2 value larger than twice the next highest value (Hair et al., 1998).
time_1 and time_2 (more discrepancy between each other than in relation to normality)
exposing proportional variability (Tabachnik & Fidell, 2001).
Indeed, the quality of the data was considered appropriate for the CFA application, mainly because of the sample size, which reached slightly more than the minimum recommended of five observations per item (Hair et al., 1998), being in fact 5.25 (63 observations per 12 items).
4.1.2 CONFIRMATORY FACTOR ANALYSIS
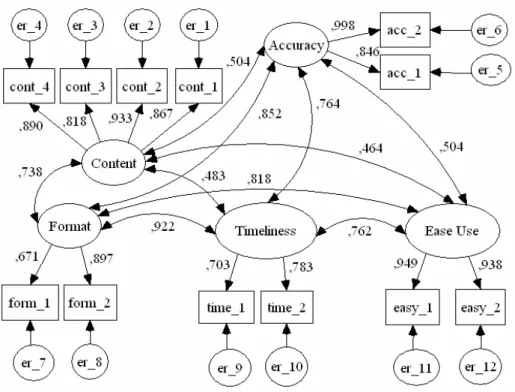
CFA measured the fitness between the model and observations collected through statistic significance, generated by the AMOS™ software (see Figure 2). Once the fitness of the model to data researched was assured, the next step was to evaluate reliability (composite reliability and extracted variance) and construct validity (convergent and discriminant).
The estimation technique defined was maximum likelihood estimation (MLE), since it is the most common and has provided valid results for small samples like 50 observations (Hair et al., 1998). The estimation process was direct estimation, when the model is directly estimated from the chosen estimation technique (MLE). Therefore, each parameter is estimated with its confidence interval, which is originated from the sampling error. This process is executed just one time over the study sample.
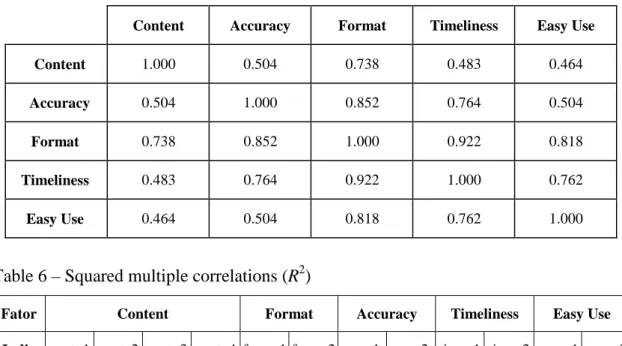
The next steps were an initial evaluation of unreasonable estimations and the analysis of model fitness. In relation to the initial estimation, high correlation was perceived between the following pairs of constructs: format and content (0.738),
format and accuracy (0.852), format and timeliness (0.922), format and easy use
Figure 2 – Results of Confirmatory Factor Analysis (factor loadings)
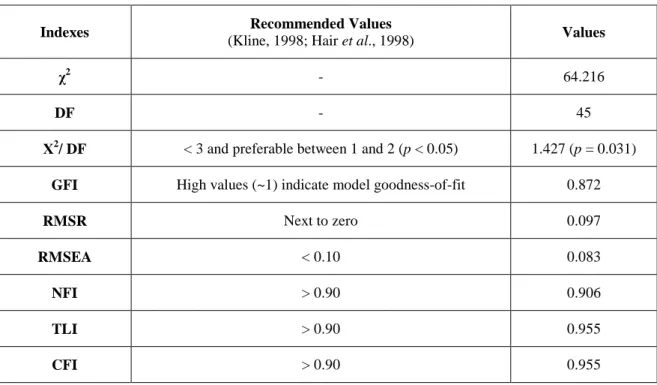
In CFA, the fit of the generic model shows the degree to which the indicators represent their constructs, being evaluated through three measure sets (goodness-of-fit measures) of observed variance matrix and that previewed from the proposed model (Hair et al., 1998): a) absolute fit measures, that assess only the overall model fit (structural and measurement, collectively) with normed chi-square (ratio chi-square over degree of freedom or χ2/ DF), goodness-of-fitness index (GFI), root mean square
residual (RMSR), and root mean square error of approximation (RMSEA); b) incremental fit measures, which compare the proposed model to a null model, using Tucker-Lewis Index (TLI) and normed fit index (NFI); and c) parsimonious fit measures, that measures the fit of the model per estimated parameter with goodness-of-fit index (GFI), normed-chi-square, and comparative goodness-of-fit index (CFI).
The application of multiple measures provides greater consensus regarding the acceptability of the model. These measures are presented in Table 3 and their overall values are within the minimum limits recommended for overall model acceptance, suggesting the model is an acceptable representation of the established constructs.
Table 3 – Indexes of measurement model fit
Indexes Recommended Values
(Kline, 1998; Hair et al., 1998) Values
χ2 - 64.216
DF - 45
Χ2/ DF < 3 and preferable between 1 and 2 (p < 0.05) 1.427 (p = 0.031) GFI High values (~1) indicate model goodness-of-fit 0.872
RMSR Next to zero 0.097
RMSEA < 0.10 0.083
NFI > 0.90 0.906
TLI > 0.90 0.955
CFI > 0.90 0.955
Table 4 shows the values of the composite reliability, through Cronbach’s Alpha, and extracted variance. All constructs had composite reliability superior to the minimum recommended of 0.70 (Nunnally, 1978), being impressive in the constructs
content, accuracy, and easy use, which presented values superior to 0.90. Regarding
extracted variance, all the constructs had values above the acceptable minimum of 0.50 (Fornell & Larcker, 1981). Then, based on the examination of the indicator weights, composite reliability, and extracted variance, the convergent validity was observed. So, the measurement model was accepted.
Table 4 – Composite reliability and extracted variance per construct
Composite Reliability Extracted Variance
Content 0.928 0.789
Accuracy 0.914 0.946
Format 0.751 0.805
Timeliness 0.709 0.775
Easy Use 0.942 0.827
format and accuracy (0.852), and format and easy use (0.818). Another criteria is the
squared multiple correlations (R2), or covariance, having the indicators form_1 and
time_1 obtained less than 50% of explained variance (Kline, 1998), or R2 x 100, by their respective factors format and timeliness (see Table 6), for p<0,001. As a result, the discriminant validity wasn’t confirmed and the structural model couldn’t be considered accepted. Kline (1998, p. 198) suggests that “no single method provides a definitive test of whether the researcher’s specifications about measurement are correct. Also, construct validity in not typically established in a single study”.
Table 5 – Matrix of construct correlations
Content Accuracy Format Timeliness Easy Use
Content 1.000 0.504 0.738 0.483 0.464
Accuracy 0.504 1.000 0.852 0.764 0.504
Format 0.738 0.852 1.000 0.922 0.818
Timeliness 0.483 0.764 0.922 1.000 0.762
Easy Use 0.464 0.504 0.818 0.762 1.000
Table 6 – Squared multiple correlations (R2)
Fator Content Format Accuracy Timeliness Easy Use
Indic .
cont_1 cont_2 cont_3 cont_4 form_1 form_2 acc_1 acc_2 time_1 time_2 easy_1 easy_2
R2 0.752 0.870 0.669 0.792 0.450 0.805 0.715 0.998 0.494 0.613 0.900 0.880
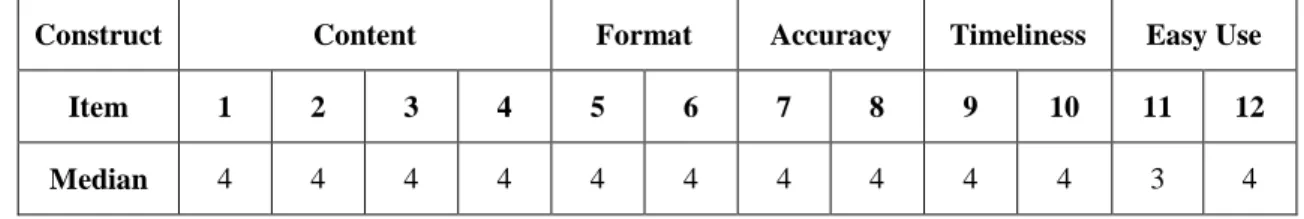
Table 7 – End-user satisfaction with the ERP system
Construct Content Format Accuracy Timeliness Easy Use
Item 1 2 3 4 5 6 7 8 9 10 11 12
Median 4 4 4 4 4 4 4 4 4 4 3 4
4.2 CONTENT ANALYSIS
CA was the method adopted to investigate the textual answers from the open-ended question of the survey. On analysis of the data collected from the documents, interviews and researcher observation, the technique of qualitative content analysis was applied through categorical analysis (Bardin, 1977, p. 153). The unit of significance, or register, was themes (thematic analysis). In this way, the categorization criteria were semantic and non syntactic (aggregating verbs, adjectives, pronouns, etc.) or lexical (aggregating by the sense of the words) (p. 118).
The themes are clippings of units with variable length extensions, including several sentences. For the categorization of the themes a category system was designed based on the target of the open question - user satisfaction. Nevertheless, the category system was not sufficiently exhaustive to restrict the analysis with the tunnel vision effect (Miles and Huberman, 1994, p. 85), which would jeopardize the perception of unusual data having important significance to the research (Marshall and Rossman, 1995).
This prior category system took into account the constructs of the Doll et al. (2004) EUCS model as well as from other variant end-user satisfaction models (Rivard, Poirier, Raymond, & Bergeron, 1997; Nelson & Wixom, 2005; Wixom & Todd, 2005) that were based on DeLone and McLean (1992) IS Success Model. These categories were segmented in system quality and information quality, referring to the first as “perceptions of the system itself and the way it delivers information”, and to the second as “dimensions that determine the user’s perception of the quality of the information included in the system” (Wixom & Todd, 2005, p. 91). The categories were illustrated with a respondent citation in quotation marks between parentheses (e.g., “My limited exposure [to the system] has not been a positive experience…”).
System quality defined categories were: a) timeliness or the degree to which
continued performance (“Would it be useful to have an option which could prevent us from paying the same invoice twice…”).
Information quality defined categories were: a) accuracy or the user’s
perception that the information is correct (“The profit figures produced by the system in 2000 were completely incorrect …”); b) currency or the user’s perception of the degree to which the information is up to date (“General ledger [monetary transactions in the form of debits and credits] is not real time…”); c) content or the degree to which the system provides all necessary information (“The system doesn’t provide us with all the information we need for our control…”, “The available information does not quite meet our requirements…”); and d) format or the user’s perception of how well the information is presented (“There are a lot of reports for each [system] module but none for an overall view…”).
Even though the category system proved its adequacy according to respondent´s answers, other categories were needed to support a broader view for the assessment of
system and information quality. One of them was functionality, conceptualized in this
study as being the degree to which the system functionalities provided satisfaction to end-user needs (“As we are in Administration and Accounts, payable is one of our functions which [the system] doesn't support…”), being linked to system quality. Two more categories were also identified for the context of supplier service quality, defined as an attitude or global judgment of how superior the service is (Robinson, 1999) if compared to prior expectations (Parasuraman, Zeithaml, & Berry, 1988): a)
dependability (Russell & Chatterjee, 2003), a synonym for reliability in SERVQUAL
model (Berry, Zeithaml, & Parasuraman, 1990) meaning the supplier’s ability to meet schedule and provide a reliable and accurate service (“Any new product [feature of the system] is always delivered late…”); and b) support or supplier providing easy access for clients questions related to system problems (“We can not ask the system supplier directly to solve problems or user-questions...”).
The claim for the service quality category was already identified by DeLone and McLean (2003) when they discussed the utility of IS Success Model updated with this category for measuring the e-commerce system success, category that was confirmed in the model by Petter and McLean (2010) in a meta-analysis assessment. De Lone and McLean (2003) argued for service quality category “as a consequence of the changes in the role of IS over the last decade” (p. 18) and made reference to SERVQUAL model. Even though this model has its origin in marketing discipline and has been applied to different services areas (Prayag, 2007; Kumar, Kee, & Charles, 2010) it has been a reference to evaluate IT services (Landrun, Prybutok, & Zhang, 2010).
The categories list was completed with two more ones, both related to
knowledge quality of the employees to permit a better interaction with the ERP system
satisfaction, both in an individual sense (“A number of manual adjustments are necessary to obtain information [as needed]…”), producing task overload, as in an organizational one (“For more efficient and better software services the market presents better products and the Bank is able to save a lot of money…”), associate with the
benefit- cost ratio.
Analyzing the categories and respective respondent citations, it can be considered that an instrument for end-user satisfaction assessment needs a broader range of items to obtain a more precise picture of the respondent´s perceptions. In this sense, the categories of system and information quality must have their constructs incremented, according to the category system defined. Other categories must also be taken into account, mainly in relation to service quality, as the differentiation between product (ERP system) and corresponding services becomes even more blurred for a quality perspective (Parasuraman et al., 1988), giving importance to the client-supplier relationship (Gronroos, 1988). The process defined for this relationship must guarantee the appropriate knowledge for using the product (i.e., ERP system) by end-users. If the end-users don’t know the system very well, it’s difficult for them to express a suitable perception.
Indeed, as there is an extensive use of alternative ways for an ERP system to perform the tasks in the branches (“Our reporting requirements may be obtained by queries and a special module [local applications]…”, “We use lots of queries and excel sheets to prepare the reports…”), which compensate the lack of information or functionalities in the system, it seems that the day-to-day tasks of the branches don’t suffer from the risk of discontinuity. Nevertheless, this surely impacts their efficiency, be it from an individual (work overload) or organizational (benefit-cost ratio) standpoint, which points to more two DeLone and McLean (1992) categories –
individual and organizational impacts.
5. FINAL CONSIDERATIONS
This study explored the antecedents of end-user satisfaction related to a specific ERP system used by a bank using the Doll et al. (2004) EUCS model as an empirical reference. The results obtained demonstrated the need for a broader range of constructs so as to have a more precise assessment of that satisfaction, like those of service (dependability and support) and knowledge quality (training level and system
understanding) categories. Variant end-user satisfaction models helped in the
identification of these two categories, which were not part of the original DeLone and McLean (1992) IS Success Model, even though service quality was included in the model revision (DeLone and McLean, 2003; Petter and McLean, 2010).
It is not possible to disqualify the appropriateness of Doll et al. (2004) instrument, as it facilitates data collection (only 12 items) and covers both system and
information quality categories as antecedents of end-user satisfaction. It can be very
DeLone and McLean (1992, p. 88) suggestion “…careful attention must be given to the development of I/S [IS] success installments”.
Among the identified limitations of this research are (a) the lack of discriminant validity of the EUCS model did not permit construct validity, even though the convergent validity was confirmed; (b) with the exception of the content construct of this model, all others have only just two indicators, limiting the effect of indicator exclusion as a corrective action in confirmatory factor analysis; (c) the limited possibility of generalization of the findings, as the study was restricted to a specific bank with a specific ERP system; and (d) the new categories identified through content analysis technique may be subject to question, since the content, as a whole, is not exhaustively treated (Bardin, p. 115). Regarding this last item, Bardin (1977, p. 115) emphasizes the fact that, although valid in the making of specific deductions on a precise inference category, it is not valid in general inferences. But its potential remains precise in exploring the reduced corpus of data and establishing more discriminating categories. So, it is suggested the continuity of assessing the EUCS model fit.
As practical contributions, the present study applied an end-user computing satisfaction model to an ERP solution, whose projections for increased adoption by enterprises imposes a close examination of how well it is perceived by end-users. As an assessment model, end-user satisfaction helps the management of ERP client-supplier relationship. Moreover, the suggested improvement of antecedent categories, along with their respective constructs, has a practical effect in IS managerial practices for business success from an end-user satisfaction perspective. Finally, future research is expected to integrate system, information, and service quality in the assessment of end-user satisfaction, in which the perception of information user will also be considered.
REFERENCES
Adamson, I., & Shine, J. (2003). Extending the New Technology Acceptance Model to Measure the End User Information Systems Satisfaction in a Mandatory Environment: A Bank’s Treasury. Technology Analysis & Strategic Management, 15(4).
Aalders, R. (2001). The IT Outsourcing Guide. Chichester, England: John Wiley & Sons.
Arc Advisory. ERP Market to Reach $25B by 2011. Retrieved September 3th, 2009, from http://parts.ihs.com/news/arc-erp-market.htm.
Bailey, J. E., & Pearson, S. W. (1983). Development of a tool for measuring and analyzing computer user satisfaction. Management Science, 29(5), 530-545.
Bardin, L. (1977). Análise de Conteúdo. Lisboa, Portugal: Edições 70.
Baroudi, J., & Orlikowski, W. (1988). A short-form measure of user information satisfaction: A psychometric evaluation and notes on use. Journal of Management Information Systems, 4(4), 44–59.
Chang, J. C.-J., & King, W. R. (2000, December). The development of measures to assess the performance of the information systems function: a multiple-constituency approach. Twenty-First International Conference on Information Systems, 640-646, Brisbane, Australia.
Chin, W. W., & Lee, M. K. O. (2000, December) A Proposed Model and Measurement Instrument for the Formation of IS Satisfaction: The Case of End-User Computing Satisfaction. Twenty-First International Conference on Information Systems, 553-563, Brisbane, Australia.
DeLone, W. H., & McLean, E. (1992). The Quest for de Dependent Variable. Information Systems Research, 3(1), 60-95.
DeLone, W. H., & McLean, E. (2003). The DeLone and McLean Model of Information System Success: A Ten-Year Update. Journal of Management Information System, 19(4), 3-30.
Dillon, W., Kumar, A., & Mulani, N. (1987). Offending Estimates in Covariance Structure Analysis – Comments on the Causes and Solutions to Heywood Cases. Psychological Bulletin, 101, 126-135.
Doll, W. J., & Torkzadeh, G. (1988). The measure of end-user computing satisfaction. MIS Quarterly, 12(2), 259–274.
Doll, W. J., Deng, X., Raghunathan, T. S., Torkzadeh, G., & Xia, W. (2004). The Meaning and Measurement of User Satisfaction: A Multigroup Invariance Analysis of the End-User Computing Satisfaction Instrument. Journal of Management Information Systems, 21(1), 227-262.
Fornell, C.R., & Larcker, D.F. (1981). Structural Equation Models With Unobservable Variables and Measurement Error. Journal of Marketing Research, 18, 39-50.
Free On-line Dictionary of Computing. (2009). Retrieved April 21st, 2006, from http://dictionary.reference.com/search?q=ERP.
Gronroos, C. (1988). Service Quality: The Six Criteria Of Good Perceived Service Quality. Review of Business, 9(3), 10-13.
Hair, J. F., Anderson, R. E., Tatham, R. L., & Black, W. C. (1998). Multivariate Data Analysis. 5th ed. New Jersey: Prentice Hall.
Huang, S. M., Chen, H. G., Hung, Y. C., & Ku, C.Y. (2004). Transplanting the Best Practice for Implementation of an ERP System: A Structured Inductive Study of an International Company. Journal of Computer Information Systems, 44(4), 101-110. Ioannou, G., & Papadoyiann, S. (2004). Theory of constraints-based methodology for effective ERP implementations. International Journal of Production Research, 42(23), 4927-4954.
Ives, B., Olson, M. H., & Baroudi, J. J. (1983). The measurement of user information satisfaction. Communications of ACM, 26(10), 785–793.
Kumar, M., Kee, F. T., & Charles, V. (2010). Comparative evaluation of critical factors in delivering service quality of banks: An application of dominance analysis in modified. International Journal of Quality & Reliability Management, 27(3), 351-377. Lacity, M. C., & Willcocks, L. P. (2004). Global Information Technology Outsourcing: In Search of Business Advantage. Chichester, England: John Wiley & Sons.
Landrun, H., Prybutok, V. R, & Zhang, X. (2010). The moderating effect of occupation on the perception of information services quality and success. Computers & Industrial Engineering, 58(2010), 133–142.
Marshall, C., & Rossman, G. B. (1995). Designing Qualitative Research. Thousand Oaks, London, New Delhi: Sage Publications.
Miles, M. B., & Huberman, A. M. (1994). Qualitative Data Analysis: An Expanded Sourcebook. 2nd ed. London, Thousand Oaks, New Delhi: Sage Publications.
Nelson, R. R., & Wixom, B. H. (2005). Antecedents of Information and System Quality: An Empirical Examination Within the Context of Data Warehousing. Journal of Management Information Systems, 21(4), 199-235.
Nunnally, J.C. (1978). Psychometric Theory. New York: McGraw-Hill.
Parasuraman, A., Zeithaml, V. A., & Berry, L. L. (1988). A multiple-item scale for measuring consumer perceptions of service quality. Journal of Retailing, 64(1), 12-37. Patton, M. Q. (2002). Qualitative research and evaluation methods. 3rd. ed. Newbury Park: Sage.
Petter, S., & McLean, E. R. (2010). A meta-analytic assessment of the DeLone and McLean IS success model: An examination of IS success at the individual level. Information & Management, 46, 159-166.
Prayag, G. (2007). Assessing international tourists’ perceptions of service quality at Air Mauritius. International Journal of Quality & Reliability Management, 24(5), 492-514. Rivard, S., Poirier, G., Raymond, L., & Bergeron, F. (1997). Development of a Measure to Assess the Quality of User-Developed Applications. The DATA BASE for Advances in Information Systems, 28(3), 44-58.
Robinson, S. (1999). Measuring service quality: current thinking and future requirements. Marketing Intelligence & Planning, 17(1), 21-32.
Rockford Consulting. (2009). The 12 Cardinal Sins of ERP Implementation. Retrieved September 3th, 2009, from http://rockfordconsulting.com/the-12-cardinal-sins-of-erp-implementation.htm.
Russell, B., & Chatterjee, S. (2003). Relationship Quality: The Undervalued Dimension of Software Quality. Communications of ACM, 46(8), 85-89.
Tabachnik, B., & Fidell, L. (2001). Using Multivariate Statistics. 4th. ed. Boston, London, Toronto, Sydney, Tokyo, and Singapore: Allyn & Bacon.
Wixom, B. H., & Todd, P. A. (2005). A Theoretical Integration of User Satisfaction and Technology Acceptance. Information Systems Research, 16(1), 85-102.
Yang, C.-C., Ting, P.-H., & Wei, C.-C. (2006). A Study of the Factors Impacting ERP System Performance from the Users’ Perspectives. The Journal of American Academy of Business, 8(2), 161-166.