Food items in the food intake of
children aged seven to ten years
Itens alimentares no consumo
alimentar de crianças de 7 a 10
anos*
Patrícia de Fragas Hinnig
Denise Pimentel Bergamaschi
Faculdade de Saúde Pública da Universidade de São Paulo (FSP-USP)
* Funded by MS/CNPq Edital 30, Process number 506162/04-4
PFH - Master´s Scholarship awarded by CAPES. The article is based on PFH´s Master´s Dissertation, entitled “Building a Quantitative Food-Intake Frequency Questionnaire for 7-to-10-year-old chil-dren”. Post-Graduate Program in Nutrition in Public Health – FSP/USP, 2010.
The authors airm that they have no conlicts of interest.
Correspondence: Denise Pimentel Bergamaschi. Faculdade de Saúde Pública, Universida-de Universida-de São Paulo. Av. Dr. Arnaldo, 715, Cerqueira César, São Paulo-SP CEP 01246-904. E-mail: [email protected]
Abstract
Objective: To describe the most repre-sentative food items regarding the total intake of energy, carbohydrates, proteins and lipids in children with ages between 7 and 10 years. Methods: A list was prepared with all food intake and quantities, and the diet composition in relation to energy and macronutrients was calculated. The list was based on information provided by a 3-day-Food Diary completed by 85 scho-olchildren ranging from seven to ten years old and enrolled in a public school in São Paulo, Brazil. After dividing the food into 129 items, we calculated the percentage in which each item contributed to diet nutrient intake and identified those which contributed to up to 95% of the total intake of calories and selected nutrients. Results:
The items “White rice, Greek rice, rice with vegetables” and “Brown, black and white beans, lentils” contributed significantly to the total intake of energy and carbohydrates. The item “Whole milk, powdered milk” had a significant participation in the total intake of lipids, protein and energy. We emphasize the importance of carbohydrates and energy intake from sugar-sweetened beverages (sodas and processed juices) in the total diet intake of the children. Conclusions: the contribution of rice in the total food intake of energy and carbohydrates; of beans in energy, carbohydrates and proteins; of milk and meat in energy, protein and lipids; and bread in energy and carbohydrates is notice-able. The participation of sugar-sweetened beverage in the total intake in energy and carbohydrates and of candies in the total intake of lipids is also evident.
Resumo
Objetivo: Descrever os itens alimentares mais representativos para o consumo total de energia, carboidratos, proteínas e lipí-dios de crianças de 7 a 10 anos. Métodos:
Elaborou-se uma lista com todos os alimen-tos consumidos com suas respectivas quan-tidades e quantificou-se a composição da dieta em energia e macronutrientes. A lista foi baseada em informações fornecidas pelo preenchimento de três Diários Alimentares (DA) por 85 escolares de 7 a 10 anos que frequentavam uma escola pública na cida-de cida-de São Paulo. Obteve-se o agrupamento dos alimentos em 129 itens, calculou-se o percentual de contribuição de cada item no consumo alimentar dos nutrientes e identificaram-se aqueles que contribuíram com até 95% da ingestão total de calorias e dos nutrientes selecionados. Resultados:
Os itens“Arroz branco, arroz à grega, arroz com legumes” e “Feijão marrom, preto, branco, lentilha”contribuíram de forma importante para o consumo de energia e carboidratos. O item “Leite integral fluido, leite integral em pó” foi representativo para o consumo de lipídios, além de proteínas e energia. Ressalta-se a importância no con-sumo em energia e carboidratos das bebidas doces (refrigerantes e sucos industrializa-dos) na dieta deste grupo populacional.
Conclusões: É evidente a participação do arroz no consumo alimentar total de energia e carboidratos; do feijão em energia, car-boidratos e proteínas; do leite em energia, proteínas e lipídios; carnes em energia, proteínas e lipídios; e pão em energia e carboidratos. Merece destaque a participa-ção das bebidas doces no consumo total de energia e carboidratos e das guloseimas no consumo total de lipídios.
Palavras-chave: Consumo de alimentos. Crianças. Macronutrientes. Ingestão de energia. Nutrição da criança. Saúde pública.
Introduction
There is evidence that an unsuitable diet from an early stage of life is associated with the occurrence of diseases such as obesity, heart disease, some cancers, osteoporosis, and hypertension in adult life1. From this
standpoint, early investigation of unsuitable eating practices among children is impor-tant so as to establish intervention strategies to promote health, particularly because the years preceding adolescence are a critical period for developing dietary habits2.
Identifying foodstuffs that are important contributors in total nutrient consumption may help investigate the role of diet in heal-th and disease, plan public healheal-th programs so as to target interventions, and develop dietary evaluation instruments3.
The list of foodstuffs that are the basis for building instruments to evaluate dietary consumption must reflect the eating habits of a population so as suitably to represent consumption1,3. If constructed for children,
such measuring instruments must contain the foodstuffs that this group habitually consumes.
There is little scientific output inten-ded to identify foodstuffs that contribute significantly to the dietary consumption of 7-to-10-year-old children, making it di-fficult to build measuring instruments for the consumption of this population group. The present study thus intends to des-cribe the most representative food items in total energy, carbohydrate, protein and lipid intake in 7-to-10-year-old children.
Methods
coefficient ρ = 0.3, which, when applied to
the formula , where
4, resulted in 115
parti-cipants after adding 25% for losses. No exclusion criterion was adopted, so every schoolchild was eligible to take part in the study provided they presented a signed Free and Informed Consent Agreement.
Foodstuffs were identified on the basis of three daily food diaries, one of which had to refer to the weekend. The schoolchildren received prior training under procedures put forward by Consolmagno et al.5. Two
30-minute sessions were held so that the necessary skills could be acquired to record food consumption in detail and with quality. The first session aimed to introduce the food diary and provide information on the fields to be filled out, including the characteristics and quantity of each foodstuff consumed. The goal of the second session was to review and reinforce concepts learnt in the first session. The instruments used for recording information are described by Hinnig et al.6.
The food diary data were transcribed to an ancillary document in order to standardi-ze data entry into the NutWin software pro-gram, version 2.57 to convert home-made
measurements into grams and determining quantities in energy and nutrients. National foodstuff composition tables were used8-11,
as well as the Manual of Recipes and Home-made Measurements for Calculation in Foodstuff Studies by Fisberg and Villar12, as
were the labels of industrially-produced foo-dstuffs in order to key in information lacking from the program’s database. The data were transferred to an Excel (2003) spreadsheet and analyzed in Stata version 9.013.
An initial list of quantities of foodstuffs (grams or milliliters), and their respective energy and macronutrient values, was drawn up. Different types of foodstuff and modes of preparation were numbered as 393 codes and later grouped together as 129 items using criteria of conceptual similarity, physical characteristics, and quantity of
nutrients per portion3. This grouping was
reviewed by two other nutritionists in case foodstuffs had been improperly classified within the items.
The most representative foodstuffs accounting for up to 95% of energy and macronutrient consumption were identified by an approach put forward by Block et al.3,
which determines obtaining a percentage of the relative contribution of each foodstuff in the diet, for the nutrient of interest, given by:
For i=1, 2...k, where i represents the foodstuff.
The numerator of the formula is made up of the sum of all quantities of the nutrient from all portions of the foodstuff consumed by all the schoolchildren. The denominator is made up of the amount of nutrients pre-sent in all foodstuffs consumed, estimated by the sum of this nutrient in all portions of all items listed.
The foodstuffs were put into descending order by the percentage of relative contribu-tion to energy and each macronutrient. The accumulated percentage was also calcula-ted, and foodstuffs contributing up to 95% were identified.
This study was approved by the Committee of Ethics in Research of the School of Public Health of USP, in complian-ce with Resolution 196, published October 10, 1996, by the National Council for Health (Conselho Nacional de Saúde).
Results
the request of their parents, and 1.7% (n=2) brought in empty food diaries.
Eighty-two schoolchildren filled out three daily food diaries; one filled out two food diaries, and two filled out four, giving a total of 256. It was decided to fill out four food diaries to balance the days of the week. Since any information provided could contribute to making up the lists of representative foodstuffs, it was decided to take into consideration all data irrespective of the number of food diaries filled in by the participant.
The ten most frequently mentioned items by at least 49% of the schoolchildren were: “White Rice, Greek rice, rice with vegetables”; “Brown, black, white beans, lentils”; “Whole milk, powdered whole milk”; “Normal soft drink, powdered choco-late drink, and other flavors”; “French roll, French roll toast”; “Industrially-produced juices in a carton”; “Unfilled sweet bread and other types of bread (hot dog rolls, baps, sliced bread, cornbread, pita bread, mini roll)”; “Margarine, butter”; “Beef (roast, stewed, minced, cooked)”.
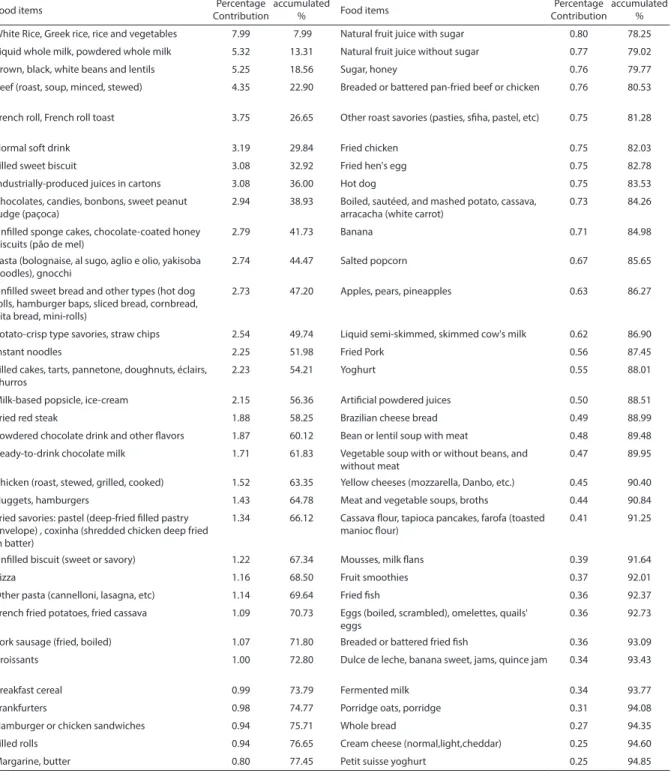
Of those foodstuffs that most contribu-ted to total energy consumption, the first 13 (Table 1) accounted for approximately 50% of consumption. It should be stated that of these, the items “White Rice, Greek rice, rice with vegetables”, “Whole milk, powdered whole milk”, “Brown, black, white beans, lentils”, “French roll, French roll to-ast”, “Normal soft drink” and “Industrially-produced juice in a carton” are among the most commonly cited foodstuffs on the food diaries.
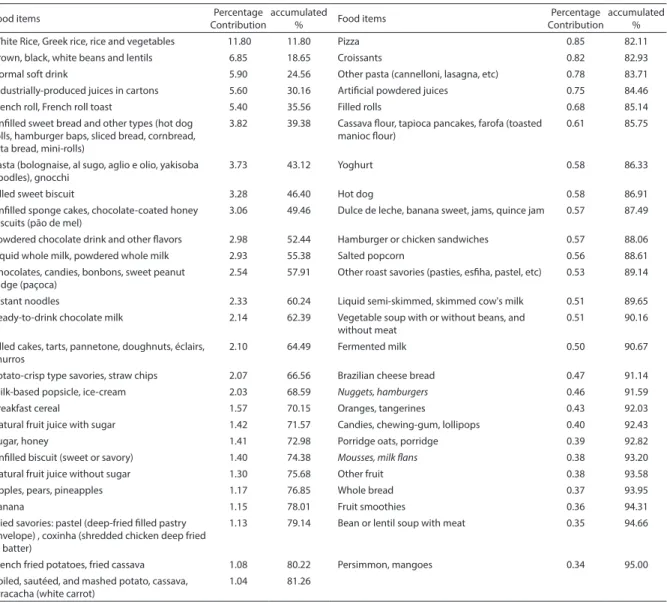
In the case of carbohydrates (Table 2), if the percentage contributions of the sweet beverages: “Normal soft drink” and “Industrially-produced juice in a carton” were summed, they would account for 11.5%, which is very close to the percentage of the first item on the list. The roles of the items “Filled sweet biscuits”, “Unfilled spon-ge cakes, chocolate-coated honey biscuits (lebkuchen or pão de mel)”, “Chocolate, candies, bonbons, sweet peanut fudge ( pa-çoca)”, and “Filled cakes, tarts, Panettone,
doughnuts, éclairs, churros” are significant, and along with “normal soft drink” account for approximately 17% of carbohydrates consumed.
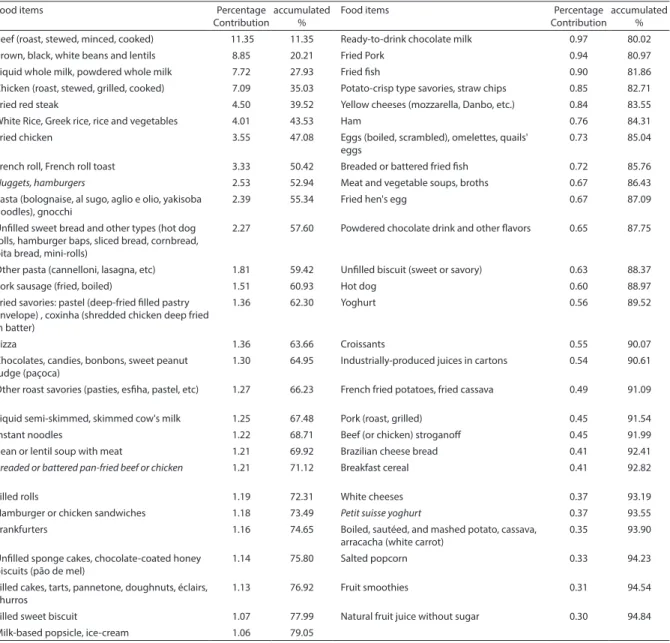
For proteins (Table 3), it should be poin-ted out that two very traditional foodstuffs in the Brazilian diet – “Brown, black, white beans, lentils” and “White rice, Greek rice, rice with vegetables” – accounted for ap-proximately 13% of the schoolchildren’s total protein consumption. Despite being important sources of proteins, “fried fish” and “battered or breaded pan-fried fish”, ranked low, were infrequently consumed, and accounted for less than 2% of the con-sumption of this macronutrient. On the list of foodstuffs accounting for up to 95% of protein consumption is “industrially-pro-duced juice in a carton”. This item includes soy-based juices, which, when compared to other foodstuffs such as meats, have a low protein value, but since they are consumed so often, eventually figure as a representa-tive item for this nutrient.
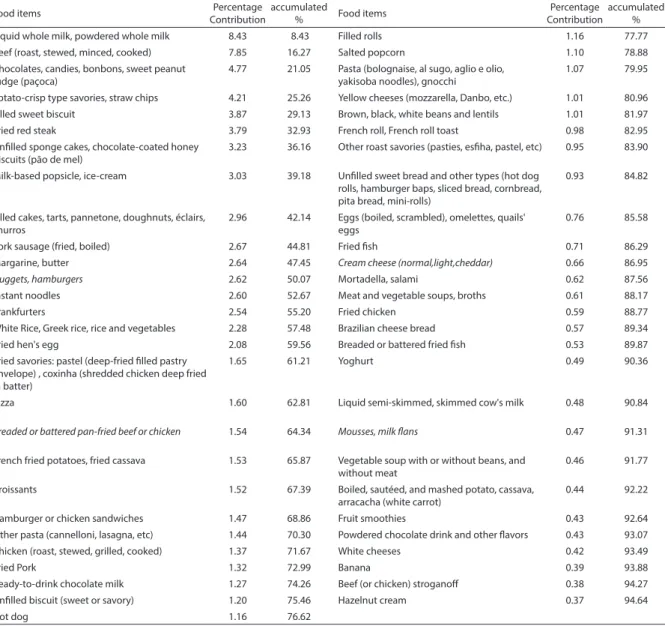
In table 4, if the treats “Chocolate, can-dies, bonbons, sweet peanut fudge ( paço-ca)” (4.77%), “potato crisp-type savories, straw chips” (4.21%), “Filled sweet biscuits” (3.87%), “Unfilled sponge cakes, chocolate--coated honey biscuits (lebkuchen or pão de mel)” (3.23%), “Milk-based popsicle, ice cream” (3.03%) and “Filled cakes, tarts, Panettone, doughnuts, éclairs, churros” (2.96%) are grouped together, they can be seen to account for roughly one quarter of total lipid consumption.
Discussion
This study describes the most repre-sentative food items in total energy, car-bohydrate, protein and lipid intake in 7 to 10-year-old children based on dietary information given in a food diary.
information on the most important foods-tuffs in present-day diet, thus containing indications for inclusion in a question-naire. Based on the tables we present, it is
obviously important to include, for example, treats (cakes, chocolates, savories, biscuits) and sweetened drinks (soft drinks, juices) in instruments for evaluating children’s diets, Table 1 – Description of food items that contributed to up to 95% to the total intake ofenergyin the diet of the
schoolchildren. Escola de Aplicação da USP, São Paulo, SP, Brazil, 2009.
Tabela 1 – Descrição dos itens alimentares que contribuíram com até 95% do consumo em energia na dieta dos escolares. Escola de Aplicação da USP, São Paulo, 2009.
Food items ContributionPercentage accumulated % Food items ContributionPercentage accumulated %
White Rice, Greek rice, rice and vegetables 7.99 7.99 Natural fruit juice with sugar 0.80 78.25 Liquid whole milk, powdered whole milk 5.32 13.31 Natural fruit juice without sugar 0.77 79.02 Brown, black, white beans and lentils 5.25 18.56 Sugar, honey 0.76 79.77 Beef (roast, soup, minced, stewed) 4.35 22.90 Breaded or battered pan-fried beef or chicken 0.76 80.53
French roll, French roll toast 3.75 26.65 Other roast savories (pasties, siha, pastel, etc) 0.75 81.28
Normal soft drink 3.19 29.84 Fried chicken 0.75 82.03 Filled sweet biscuit 3.08 32.92 Fried hen's egg 0.75 82.78 Industrially-produced juices in cartons 3.08 36.00 Hot dog 0.75 83.53 Chocolates, candies, bonbons, sweet peanut
fudge (paçoca)
2.94 38.93 Boiled, sautéed, and mashed potato, cassava, arracacha (white carrot)
0.73 84.26
Unilled sponge cakes, chocolate-coated honey biscuits (pão de mel)
2.79 41.73 Banana 0.71 84.98
Pasta (bolognaise, al sugo, aglio e olio, yakisoba noodles), gnocchi
2.74 44.47 Salted popcorn 0.67 85.65
Unilled sweet bread and other types (hot dog rolls, hamburger baps, sliced bread, cornbread, pita bread, mini-rolls)
2.73 47.20 Apples, pears, pineapples 0.63 86.27
Potato-crisp type savories, straw chips 2.54 49.74 Liquid semi-skimmed, skimmed cow's milk 0.62 86.90
Instant noodles 2.25 51.98 Fried Pork 0.56 87.45
Filled cakes, tarts, pannetone, doughnuts, éclairs, churros
2.23 54.21 Yoghurt 0.55 88.01
Milk-based popsicle, ice-cream 2.15 56.36 Artiicial powdered juices 0.50 88.51 Fried red steak 1.88 58.25 Brazilian cheese bread 0.49 88.99 Powdered chocolate drink and other lavors 1.87 60.12 Bean or lentil soup with meat 0.48 89.48 Ready-to-drink chocolate milk 1.71 61.83 Vegetable soup with or without beans, and
without meat
0.47 89.95
Chicken (roast, stewed, grilled, cooked) 1.52 63.35 Yellow cheeses (mozzarella, Danbo, etc.) 0.45 90.40 Nuggets, hamburgers 1.43 64.78 Meat and vegetable soups, broths 0.44 90.84 Fried savories: pastel (deep-fried illed pastry
envelope) , coxinha (shredded chicken deep fried in batter)
1.34 66.12 Cassava lour, tapioca pancakes, farofa (toasted manioc lour)
0.41 91.25
Unilled biscuit (sweet or savory) 1.22 67.34 Mousses, milk lans 0.39 91.64
Pizza 1.16 68.50 Fruit smoothies 0.37 92.01
Other pasta (cannelloni, lasagna, etc) 1.14 69.64 Fried ish 0.36 92.37 French fried potatoes, fried cassava 1.09 70.73 Eggs (boiled, scrambled), omelettes, quails'
eggs
0.36 92.73
Pork sausage (fried, boiled) 1.07 71.80 Breaded or battered fried ish 0.36 93.09 Croissants 1.00 72.80 Dulce de leche, banana sweet, jams, quince jam 0.34 93.43
Table 2 – Description of food items that contributed to up to 95% to the total intake of carbohydrates in the diet of the schoolchildren. Escola de Aplicação da USP, São Paulo, SP, Brazil, 2009.
Tabela 2 – Descrição dos itens alimentares que contribuíram com até 95% do consumo em carboidratosna dieta dos escolares. Escola de Aplicação da USP, São Paulo, 2009.
Food items Percentage Contribution
accumulated
% Food items
Percentage Contribution
accumulated % White Rice, Greek rice, rice and vegetables 11.80 11.80 Pizza 0.85 82.11 Brown, black, white beans and lentils 6.85 18.65 Croissants 0.82 82.93 Normal soft drink 5.90 24.56 Other pasta (cannelloni, lasagna, etc) 0.78 83.71 Industrially-produced juices in cartons 5.60 30.16 Artiicial powdered juices 0.75 84.46 French roll, French roll toast 5.40 35.56 Filled rolls 0.68 85.14 Unilled sweet bread and other types (hot dog
rolls, hamburger baps, sliced bread, cornbread, pita bread, mini-rolls)
3.82 39.38 Cassava lour, tapioca pancakes, farofa (toasted manioc lour)
0.61 85.75
Pasta (bolognaise, al sugo, aglio e olio, yakisoba noodles), gnocchi
3.73 43.12 Yoghurt 0.58 86.33
Filled sweet biscuit 3.28 46.40 Hot dog 0.58 86.91
Unilled sponge cakes, chocolate-coated honey biscuits (pão de mel)
3.06 49.46 Dulce de leche, banana sweet, jams, quince jam 0.57 87.49
Powdered chocolate drink and other lavors 2.98 52.44 Hamburger or chicken sandwiches 0.57 88.06 Liquid whole milk, powdered whole milk 2.93 55.38 Salted popcorn 0.56 88.61 Chocolates, candies, bonbons, sweet peanut
fudge (paçoca)
2.54 57.91 Other roast savories (pasties, esiha, pastel, etc) 0.53 89.14
Instant noodles 2.33 60.24 Liquid semi-skimmed, skimmed cow's milk 0.51 89.65 Ready-to-drink chocolate milk 2.14 62.39 Vegetable soup with or without beans, and
without meat
0.51 90.16
Filled cakes, tarts, pannetone, doughnuts, éclairs, churros
2.10 64.49 Fermented milk 0.50 90.67
Potato-crisp type savories, straw chips 2.07 66.56 Brazilian cheese bread 0.47 91.14 Milk-based popsicle, ice-cream 2.03 68.59 Nuggets, hamburgers 0.46 91.59 Breakfast cereal 1.57 70.15 Oranges, tangerines 0.43 92.03 Natural fruit juice with sugar 1.42 71.57 Candies, chewing-gum, lollipops 0.40 92.43 Sugar, honey 1.41 72.98 Porridge oats, porridge 0.39 92.82 Unilled biscuit (sweet or savory) 1.40 74.38 Mousses, milk lans 0.38 93.20 Natural fruit juice without sugar 1.30 75.68 Other fruit 0.38 93.58 Apples, pears, pineapples 1.17 76.85 Whole bread 0.37 93.95
Banana 1.15 78.01 Fruit smoothies 0.36 94.31
Fried savories: pastel (deep-fried illed pastry envelope) , coxinha (shredded chicken deep fried in batter)
1.13 79.14 Bean or lentil soup with meat 0.35 94.66
French fried potatoes, fried cassava 1.08 80.22 Persimmon, mangoes 0.34 95.00 Boiled, sautéed, and mashed potato, cassava,
arracacha (white carrot)
1.04 81.26
since they are representative within the total consumption of energy and macronutrients. Based on the information about the frequency of consumption of foodstuffs and how representative they are in the total consumption of energy and macronutrients, certain important aspects deserve to be hi-ghlighted, since they show low rates of con-sumption for fruit and fish, and an overwhel-ming participation of rice, beans, milk, red meat, treats and sweetened beverages.
The low consumption of fruit that we found is worrying. Assis et al.14 evaluated
foodstuff consumption for seven-to-ten--year-old schoolchildren in the city of Florianópolis and found that only 15% of children attained nutritional recommenda-tions for this group contained in the Food Guidance for the Brazilian Population (Guia Alimentar para a População Brasileira). Low consumption was also found by Conceição et al.15 in the town of São Luís, Maranhão,
among 9-to-16-year-old school children. Although the Family Budget Survey (Pesquisa de Orçamentos Familiares – POF)16
Table 3 – Description of food items that contributed to up to 95% to the total intake of proteinsin the diet of the schoolchildren. Escola de Aplicação da USP, São Paulo, SP, Brazil, 2009.
Tabela 3 – Descrição dos itens alimentares que contribuíram com até 95% do consumo em proteínas na dieta dos escolares. Escola de Aplicação da USP, São Paulo, 2009.
Food items Percentage Contribution
accumulated %
Food items Percentage Contribution
accumulated % Beef (roast, stewed, minced, cooked) 11.35 11.35 Ready-to-drink chocolate milk 0.97 80.02 Brown, black, white beans and lentils 8.85 20.21 Fried Pork 0.94 80.97 Liquid whole milk, powdered whole milk 7.72 27.93 Fried ish 0.90 81.86 Chicken (roast, stewed, grilled, cooked) 7.09 35.03 Potato-crisp type savories, straw chips 0.85 82.71 Fried red steak 4.50 39.52 Yellow cheeses (mozzarella, Danbo, etc.) 0.84 83.55 White Rice, Greek rice, rice and vegetables 4.01 43.53 Ham 0.76 84.31 Fried chicken 3.55 47.08 Eggs (boiled, scrambled), omelettes, quails'
eggs
0.73 85.04
French roll, French roll toast 3.33 50.42 Breaded or battered fried ish 0.72 85.76
Nuggets, hamburgers 2.53 52.94 Meat and vegetable soups, broths 0.67 86.43 Pasta (bolognaise, al sugo, aglio e olio, yakisoba
noodles), gnocchi
2.39 55.34 Fried hen's egg 0.67 87.09
Unilled sweet bread and other types (hot dog rolls, hamburger baps, sliced bread, cornbread, pita bread, mini-rolls)
2.27 57.60 Powdered chocolate drink and other lavors 0.65 87.75
Other pasta (cannelloni, lasagna, etc) 1.81 59.42 Unilled biscuit (sweet or savory) 0.63 88.37 Pork sausage (fried, boiled) 1.51 60.93 Hot dog 0.60 88.97 Fried savories: pastel (deep-fried illed pastry
envelope) , coxinha (shredded chicken deep fried in batter)
1.36 62.30 Yoghurt 0.56 89.52
Pizza 1.36 63.66 Croissants 0.55 90.07
Chocolates, candies, bonbons, sweet peanut fudge (paçoca)
1.30 64.95 Industrially-produced juices in cartons 0.54 90.61
Other roast savories (pasties, esiha, pastel, etc) 1.27 66.23 French fried potatoes, fried cassava 0.49 91.09
Liquid semi-skimmed, skimmed cow's milk 1.25 67.48 Pork (roast, grilled) 0.45 91.54 Instant noodles 1.22 68.71 Beef (or chicken) stroganof 0.45 91.99 Bean or lentil soup with meat 1.21 69.92 Brazilian cheese bread 0.41 92.41
Breaded or battered pan-fried beef or chicken 1.21 71.12 Breakfast cereal 0.41 92.82
Filled rolls 1.19 72.31 White cheeses 0.37 93.19
Hamburger or chicken sandwiches 1.18 73.49 Petit suisse yoghurt 0.37 93.55 Frankfurters 1.16 74.65 Boiled, sautéed, and mashed potato, cassava,
arracacha (white carrot)
0.35 93.90
Unilled sponge cakes, chocolate-coated honey biscuits (pão de mel)
1.14 75.80 Salted popcorn 0.33 94.23
Filled cakes, tarts, pannetone, doughnuts, éclairs, churros
1.13 76.92 Fruit smoothies 0.31 94.54
Filled sweet biscuit 1.07 77.99 Natural fruit juice without sugar 0.30 94.84 Milk-based popsicle, ice-cream 1.06 79.05
and beans in the diet of families residing in Greater São Paulo between 1974-1975 and 2002-2003,these foodstuffs in the present study figure strongly as representative in the children’s diet. Mahan and Arlin17 state
that in combination these items provide ideal quantities of amino acids for protein synthesis, above all in children nutritionally at risk owing to insufficient consumption of foodstuffs that are sources of high biological value proteins.
Another foodstuff that draws our at-tention is “French roll, French roll toast”. Its importance in contributing to energy, carbohydrates and proteins may be partially justified by the fact that people replace tra-ditional meals (lunch and dinner) by rolls and cooked meats and sausages, and soft drinks18.
maintains eating habits common to youn-ger age brackets as described by Colucci et al.19, who found that liquid milk was one of
the most important foodstuffs in the total energy consumption of two-to-five-year--old children.
Studies carried out on schoolchildren have shown a fall in milk consumption in the last decade, possibly associated with an increase in the consumption of sweetened beverages14,20,21. In the present study, the
role of sweetened beverages such as “soft
drinks”, “industrially-produced juice in cartons” and “powdered artificial juices” in the diets of schoolchildren is striking. Blum et al.21 state that there is strong evidence of
increased consumption of soft drinks by American children and adolescents, affec-ting the quality of diet, and total energy consumption thereof.
Although sugar is commonly consumed in isolation (42.1%) by the group under consideration, its share of the total contri-bution to energy was not representative,
Table4 – Description of food items that contributed to up to 95% to the total intake of lipids in the diet of the schoolchildren. Escola de Aplicação da USP, São Paulo, SP, Brazil, 2009.
Tabela 4 – Descrição dos itens alimentares que contribuíram com até 95% do consumo em lipídios na dieta dos escolares. Escola de Aplicação da USP, São Paulo, 2009.
Food items Percentage Contribution
accumulated
% Food items
Percentage Contribution
accumulated % Liquid whole milk, powdered whole milk 8.43 8.43 Filled rolls 1.16 77.77 Beef (roast, stewed, minced, cooked) 7.85 16.27 Salted popcorn 1.10 78.88 Chocolates, candies, bonbons, sweet peanut
fudge (paçoca)
4.77 21.05 Pasta (bolognaise, al sugo, aglio e olio, yakisoba noodles), gnocchi
1.07 79.95
Potato-crisp type savories, straw chips 4.21 25.26 Yellow cheeses (mozzarella, Danbo, etc.) 1.01 80.96 Filled sweet biscuit 3.87 29.13 Brown, black, white beans and lentils 1.01 81.97 Fried red steak 3.79 32.93 French roll, French roll toast 0.98 82.95 Unilled sponge cakes, chocolate-coated honey
biscuits (pão de mel)
3.23 36.16 Other roast savories (pasties, esiha, pastel, etc) 0.95 83.90
Milk-based popsicle, ice-cream 3.03 39.18 Unilled sweet bread and other types (hot dog rolls, hamburger baps, sliced bread, cornbread, pita bread, mini-rolls)
0.93 84.82
Filled cakes, tarts, pannetone, doughnuts, éclairs, churros
2.96 42.14 Eggs (boiled, scrambled), omelettes, quails' eggs
0.76 85.58
Pork sausage (fried, boiled) 2.67 44.81 Fried ish 0.71 86.29 Margarine, butter 2.64 47.45 Cream cheese (normal,light,cheddar) 0.66 86.95
Nuggets, hamburgers 2.62 50.07 Mortadella, salami 0.62 87.56
Instant noodles 2.60 52.67 Meat and vegetable soups, broths 0.61 88.17
Frankfurters 2.54 55.20 Fried chicken 0.59 88.77
White Rice, Greek rice, rice and vegetables 2.28 57.48 Brazilian cheese bread 0.57 89.34 Fried hen's egg 2.08 59.56 Breaded or battered fried ish 0.53 89.87 Fried savories: pastel (deep-fried illed pastry
envelope) , coxinha (shredded chicken deep fried in batter)
1.65 61.21 Yoghurt 0.49 90.36
Pizza 1.60 62.81 Liquid semi-skimmed, skimmed cow's milk 0.48 90.84
Breaded or battered pan-fried beef or chicken 1.54 64.34 Mousses, milk lans 0.47 91.31
French fried potatoes, fried cassava 1.53 65.87 Vegetable soup with or without beans, and without meat
0.46 91.77
Croissants 1.52 67.39 Boiled, sautéed, and mashed potato, cassava, arracacha (white carrot)
0.44 92.22
Hamburger or chicken sandwiches 1.47 68.86 Fruit smoothies 0.43 92.64 Other pasta (cannelloni, lasagna, etc) 1.44 70.30 Powdered chocolate drink and other lavors 0.43 93.07 Chicken (roast, stewed, grilled, cooked) 1.37 71.67 White cheeses 0.42 93.49
Fried Pork 1.32 72.99 Banana 0.39 93.88
Ready-to-drink chocolate milk 1.27 74.26 Beef (or chicken) stroganof 0.38 94.27 Unilled biscuit (sweet or savory) 1.20 75.46 Hazelnut cream 0.37 94.64
as mentioned for younger ages by Colucci et al19. However, one should consider this
foodstuff to be present in other dietary items that stood out as contributing to energy, such as “filled sweet biscuits”, “chocolate, candies, bonbons, sweet peanut fudge ( pa-çoca)”, “Unfilled sponge cakes, chocolate--coated honey biscuits (lebkuchen or pão de mel)” and “normal soft drinks”. Ebbeling et al.22 state that sugar is an important
com-ponent of a number of foodstuffs considered unhealthy. This aspect shows how difficult it is to combat this “hidden enemy”, much more so than sugar itself in isolation, since people may not realize they are consuming it, making it difficult to quantify, and unli-kely to be reported.
The highly frequent consumption of treats rich in fat and sugar has also been in found in other studies of children20,23.
McPherson et al.23 found in a study of
chil-dren and adolescents in Texas, that among the main foodstuffs accounting for total con-sumption of saturated fat were chocolate and ice cream, the latter also being mentioned for total cholesterol consumption. Although in the present study the percentage contribu-tion of foodstuffs was not calculated by the type of fat and cholesterol, it is assumed that these foodstuffs are also major contributors to saturated fat and cholesterol.
The consumption of fish as found by the POF16 and in the present study contributes
little to total calories, showing how little this foodstuff is appreciated or how little it is appreciated by families responsible for purchasing and preparing it. In this respect, Drewnowski e Darmon24 also point out
that family purchasing power predicts the purchase of highly nutritive but expensive foodstuffs such as fresh fish.
Some comments may be made about the methodology used to identify representative foodstuffs, and about the samples studied. The method of Block et al.3 enables certain
foodstuffs that might otherwise be ignored— since they are not good sources of a given nu-trient – to be selected as representative, since a high frequency of consumption offsets the low content of the nutrient of interest.
One example was the surprising presence of “industrially-produced juice in a carton” on the list of foodstuffs accounting for up to 95% of protein consumption, since in itself it has low protein content, but was consumed by a considerable number of schoolchildren.
The fact that other professional nu-tritionists reviewed the foodstuffs makes misclassification of items unlikely, a factor that might have an influence in calculating the percentage contribution proposed by Block et al.3.
The use of the food diaries also has certain limitations. The literature discusses whether dietary recordings depend on the respondent’s cognitive maturity, a fact cer-tainly to be taken into consideration with the age bracket studied here25. However, if
skills are developed for filling out the food diary, and training is given before the instru-ment is used by the child, or before dietary models and home-made measurements are used, children in this age bracket can fill out the instrument with quality5.
For food diaries, it should be pointed out that: i) although it is a time-consuming method that demands collaboration and motivation of the participant, in the present study the behavior of those schoolchildren who undertook to fill out the diary as a school activity was surprising; ii) important methodological steps were taken to improve recording of dietary intake, such as the trai-ning of evaluators and participants before filling out the food diary, checking of food diaries one day after they were filled out, monitoring the record-keeping and deli-very by using a letter in the school’s activity notebook, and telephone contact to inform participants of the activity day.
Conclusion
drinks in the total energy and carbohydrate consumption, and of candies and sweets in the total consumption of lipids, stand out.
The data described in the present article provide input for building or enhancing questionnaires constructed for this age group, and for carrying out educational interventions to encourage or discourage the consumption of foodstuffs which, from a nutritional point of view, are desirable or harmful for proper health, growth and development.
Acknowledgments
To MS/CNPq for financial support. We
thank the parents and students who took part in this survey, as well as the teachers who made it possible to carry out the sur-vey during the school period, and above all we thank the director of the University of São Paulo’s Escola de Aplicação in 2008, Professor Vanderlei Pinheiro Bispo, and the educational pedagogical supervisor for “Fundamental I” in 2008, professor Luciana Sedano de Souza. We also thank Thaysa L Giovannetti, Aline B Mariath and Sílvia R M Freaza for their help in data collection, Giovanny V A de França and Professor Ana Maria D Gambardella of the Department of Nutrition (FSP/USP) for their review of the grouping of foodstuffs.
References
1. Willett WC. Nutritional Epidemiology. New York: Oxford University Press; 1988.
2. Serra-Majem L., García-Closas R, Ribas L, Pérez-Rodrigo, Aranceta J. Food patterns of Spanish schoolchildren and adolescents: The EnKid Study. Public Health Nutr2001; 4(6A): 1433-38.
3. Block G, Dresser Cm, Hartman Am, Carroll Md. Nutrient sources in the American diet: quantitative data from the NHANES II survey. I. Vitamins and minerals. Am J Epidemiol 1985; 122(1): 13-26.
4. Machin D, Campbell M, Fayers P, Pinol A. Sample size table for clinical studies, 2. ed. Oxford: Blackwell Scientific Publications; 1997.
5. Consolmagno DC, AssunçãoNA, GiovannettiTL, ZeraibDP, HinnigPF, FreazaSRM, et al. Treinamento de escolares de 7 a 10 anos para o preenchimento de um Diário Alimentar. Rev Bras Epidemiol 2009; 12(3): 404-12.
6. Hinnig PF, Mariath AB, Freaza SRM, Consolmagno DC, Giovannetti TL, Assuncao NA, et al. Preenchimento de Registro Alimentar por escolares de 7 a 10 anos. Nutrire
2010; 35(1): 47-57.
7. NutWin: Programa de Apoio à Nutrição. [programa computacional]. Versão 2.5. São Paulo: Departamento de Informática em Saúde - Universidade Federal de São Paulo; 2005.
8. Instituto Brasileiro de Geografia e Estatística. Estudo nacional da despesa familiar: tabela de composição de alimentos. 5ª ed. Rio de Janeiro: IBGE; 1999.
9. Philippi ST. Tabela de composição de alimentos: suporte para decisão nutricional. 2ª ed. São Paulo: Coronário; 2002.
10. Pinheiro ABV, Lacerda EMA, Benzecry EH, Gomes MCS, Costa VM. Tabela para avaliação de Consumo Alimentar em medidas caseiras. 3ª ed. Rio de Janeiro; 1996.
11. Tabela brasileira de composição de alimentos - TACO / UNICAMP. Versão II. 2. ed. Campinas: NEPA-UNICAMP; 2006.
12. Fisberg RM, Villar BS. Manual de Receitas e Medidas Caseiras para Cálculo de Inquéritos Alimentares. São Paulo: Signus; 2002.
13. StataCorp: Stata Statistical Software. [computer program]. Version 9.0. Texas: Stata Corporation LP; 2005.
14. Assis MAA, Calvo MCM, Kupek E, Vasconcelos FAG, Campos VC, Machado M et al. Qualitative analysis of the diet of a probabilistic sample of schoolchildren from Florianópolis, Santa Catarina State, Brazil, using the
Previous Day Food Questionnaire. Cad Saúde Pública
2010; 26(7): 1355-65.
15. Conceição SIO, Santos CJN, Silva AAM, Silva JS, Oliveira TC. Consumo alimentar de escolares das redes pública e privada de ensino em São Luís, Maranhão. Rev Nutr
2010; 23(6): 993-1004.
16. Instituto Brasileiro de Geografia e Estatística. Pesquisa de Orçamentos Familiares (POF) 2002-2003: análise da disponibilidade domiciliar de alimentos e do estado nutricional no Brasil. Rio de Janeiro; 2004.
17. Mahan LK, Arlin MT. Krause: alimentos, nutrição e dietoterapia. 8ª ed. São Paulo: Roca; 1994.
19. Colucci ACA, Philippi ST, Slater B. Desenvolvimento de um questionário de frequência alimentar para avaliação do consumo alimentar de crianças de 2 a 5 anos de idade. Rev Bras Epidemiol 2004; 7(4): 393-401.
20. Inchley J, Todd J, Bryce C, Currie C. Dietary trends among Scottish schoolchildren in the 1990s. J Hum Nutr Dietet 2001; 14: 207-16.
21. Blum JW, Jacobsen DJ, Donnelly JE. Beverage Consumption Patterns in Elementary School Aged Children across a Two-Year Period. J Am Coll Nutr 2005; 24(2): 93-8.
22. Ebbeling CB, Pawlak DB, Ludwig DS. Childhood obesity: public health crisis, common sense cure. Lancet 2002; 360: 473-82.
23. McPherson RS, Nichaman MZ, Kohl HW, Reed DB, Labarthe DR. Intake and Food Sources of Dietary Fat Among Schoolchildren in The Woodlands, Texas.
Pediatrics 1990; 86: 520-6.
24. Drewnowski A, Darmon N. Food choices and diet costs: an economic analysis. J Nutr 2005; 135: 900-4.
25. Livingstone MBE, Robson PJ. Measurement of dietary intake in children. Proc Nutr Soc 2000; 59: 279-93.
Errata
Correction
Where it reads:
• Patrícia de Fragas Hinnigi
• Denise Pimental Bergamaschi
Replace by: