AR
TICLE
1 Departamento de Vigilância de Doenças e Agravos Não Transmissíveis e Promoção da Saúde, Secretaria de Vigilância em Saúde, Ministério da Saúde. SAF Sul, Trecho 2/ Lote 05/06, Bloco F, Torre I, Ed. Premium, sala 14, SAF Sul. 70070-600 Brasília DF Brasil.
[email protected] 2 Faculdade de Medicina, Universidade Federal de Ouro Preto.
3 Departamento de Clínica Médica, Faculdade de Medicina, Universidade Federal de Minas Gerais (UFMG).
4 Departamento de Medicina Preventiva e Social, Faculdade de Medicina, UFMG.
Elderly patients attended in emergency health services in Brazil:
a study for victims of falls and traffic accidents
Abstract The article aims to describe the pro-file of elderly victims of falls and traffic accidents from the data of the Surveillance Survey of Vio-lence and Accidents (VIVA). The VIVA Survey was conducted in the emergency health-services of the Unified Health System in the capitals of Brazil in 2011. The sample of elderly by type of accident was subjected to the two-step cluster procedure. Of the 2463 elderly persons in question, 79.8% suf-fered falls and 20.2% were the victims of traffic accidents. The 1812 elderly who fell were grouped together into 4 clusters: Cluster 1, in which all had disabilities; Cluster 2, all were non-white and falls took place in the home; Cluster 3, younger and active seniors; and Cluster 4, with a higher proportion of seniors 80 years old or above who were white. Among cases of traffic accidents, 446 seniors were grouped into two clusters: Cluster 1 of younger elderly, drivers or passengers; Cluster 2, with higher age seniors, mostly pedestrians. The main victims of falls were women with low school-ing and unemployed; traffic accident victims were mostly younger and male. Complications were similar in victims of falls and traffic accidents. Clusters allow adoption of targeted measures of care, prevention and health promotion.
Key words Health of the elderly, External causes,
Traffic accidents, Accidental Falls, Health services for the elderly
Mariana Gonçalves de Freitas 1
Palmira de Fátima Bonolo 2
Edgar Nunes de Moraes 3
Fr
eitas MG
Introduction
In Brazil, there are 20.5 million individuals aged
≥ 60 years, representing approximately 10.8% of
the population, of whom 55.5% are women. The increased life expectancy at all ages, even among
elderly people1, reflects advances and
achieve-ments but also demands the development of sus-tained public policies for the social inclusion of the elderly. Such policies are needed to ensure ac-tive aging, with autonomy, independence, access to information, security, health promotion, and
disease prevention1,2.
It is the responsibility of the state and society to invest in a healthy lifestyle for this growing so-cial group with specific needs. The strategies for health promotion include intersectoral actions aimed at creating supportive environments, in-cluding work and leisure. Among these, we high-light public spaces and urban infrastructure that meet the expectations and needs for improved quality of life and maintenance of the
econom-ically productive capacity3,4. Ayres et al. propose
evaluating the individual, social, and program-matic vulnerabilities to assess the characteristics of illnesses and mortality of distinct population groups. Social vulnerability involves aspects re-lated to social risk, education, income, and labor; programmatic vulnerability involves aspects re-lated to government investment actions and the degree and quality of engagement. Therefore, the process of health and disease is associated with individual aspects and with environmental
fac-tors and strategic resources5.
National and international studies have shown the epidemiology of external causes such as abuse, accidents, traumas, and injuries among
the elderly6-9. Violence and accidents represent
a significant cause of morbidity (sixth-lead-ing cause of hospitalization) and mortality (third-leading cause of death) in the general
pop-ulation10. With regard to environmental factors,
Phillips et al.11 indicate that the combination of
individual factors, e.g., reduced physical and cog-nitive ability, poor hearing and vision, combined with inadequate urban planning, have a negative impact on the mobility of the elderly as pedestri-ans and trpedestri-ansportation users.
In other countries, elderly people classified as such often do not consider themselves old and therefore have no perception of the increased risk of accidents and injuries. In the elderly, falls are impactful events. This lack of awareness of their vulnerable situation can lead to increased risk of falls and should be properly managed by health
care professionals to promote health and
pre-vent accidents12. There is evidence that falls are
common events and are more prevalent among women. Extrinsic environmental factors contrib-uting to falls include the inadequacy of floors, lighting, stairs, bathrooms, and physical barriers in general. Intrinsic factors, including the use of medications – particularly benzodiazepines, an-tidepressants, and some antiarrhythmic drugs
– add to these factors13. In addition, programs
that provide information support and evaluation and stimulate daily activities are fundamental to
healthy aging12.
This study aimed to describe the profile of el-derly people according to information on traffic accidents and falls obtained from the Violence and Injury Surveillance System (Sistema de Vig-ilância de Violências e Acidentes – VIVA) in 2011. It also aimed to provide information to support public policies on comprehensive health care to prevent, treat, rehabilitate, and promote health in the elderly.
Methods
2011 VIVA survey
The VIVA survey was a cross-sectional study conducted in urgent care and emergency services of the Unified Health System (SUS) in Brazilian capitals and the Federal District in 2011, with the exception of São Paulo and Manaus. The estab-lishments that composed the study sample were selected on the basis of records obtained from the National Record of Health Units (Cadastro Na-cional de Estabelecimentos de Saúde – CNES). Subsequently, these establishments were classified according to the number of health care services for external causes obtained from the Hospital Information System (Sistema de Informações Hospitalares – SIH) of SUS (SIH/SUS) and ac-cording to data from the VIVA surveys conduct-ed in 2006, 2007, or 2009 (for health units
partic-ipating in those years)14. The units selected were
reference centers in urgent and emergency care in each municipality and were validated by the sur-veillance team for non-communicable diseases (doenças e agravos não transmissíveis – DANT) in the State and Municipal Secretariats of Health
of the respective participating municipalities14.
coef-e C
ole
tiv
a,
20(3):701-712,
2015
ficient of variation of <30% and standard error of <3, defined a minimum of 2000 health care services for external causes per municipality, regardless of the number of participating units. Data were collected during day and night shifts, lasting 12 hours each, for 30 consecutive days (between September and October 2011) using a standardized data collection form. The number of work shifts drawn for each establishment was calculated using the ratio of the minimum num-ber of health care services for external causes (de-fined as 2000) to the average number of health care services for external causes in the same
es-tablishment in previous years14.
The random selection was conducted by single-stage cluster sampling, stratified by es-tablishment, and the work shift was the primary sampling unit. All health care services for exter-nal causes performed in the selected shift were sampled. The health care services were classified as addressing violence or accidents according to the International Classification of Diseases (Clas-sificação Internacional de Doenças – CID-10). The respondent was the victim or the responsi-ble companion/guardian (in case the victim was under 18 years old or unable to answer the
ques-tions)14.
The forms were input into Epi Info software version 3.5.1 by the health surveillance team of each municipality and later transferred to the database of the Ministry of Health, which
per-formed the consistency and duplicity analyses14.
The 2011 VIVA survey was approved by the Na-tional Research Ethics Committee (Comissão Nacional de Ética em Pesquisa – CONEP) of the Ministry of Health.
Two-step cluster method and variables used
The two-step cluster method has an explor-atory nature. It has been used to identify natural groups of cases or individuals in large databas-es and is very effective in thdatabas-ese situations. This method allows for the identification of groups using quantitative and qualitative variables (clusters) and continuous or categorical/ordinal variables and automatically calculates the num-ber of empirical clusters on the basis of Bayesian and Akaike information criteria, which are used jointly and comparatively to empirically provide
the optimal solution15.
We implemented a two-step clustering
algo-rithm in SPSS software16. The qualitative
vari-ables were categorized on the basis of the liter-ature. Later, these variables were used with the
option for determining whether they were qual-itative or quantqual-itative (continuous or
categori-cal). According to Shih et al.16, an algorithm that
automatically recategorizes the most common variables is feasible, but this option has not been incorporated into the SPSS software.
The analysis was conducted separately for two groups: elderly people who were victims of falls and victims of traffic accidents. For cluster formation, the variables that could define groups for which interventions could be made to prevent falls and traffic accidents were used. Therefore, for the definition of clusters containing fall and traffic accident victims, the following sociode-mographic variables were selected: age (contin-uous), gender (female, male), ethnicity (white, non-white), schooling (0-4 years, 5-8 years, 9-11 years, >12 years), work status (employed or not at the date of occurrence), whether the oc-currence was related to work (yes, no), and the event location (urban, rural, or peri-urban). The vulnerability variable was used when the victim had a permanent disability on the date of the occurrence (yes, no). With regard to the circum-stantial aspects of the event, we used the day of the week (Sunday to Saturday; seven categories) and whether the patient had consumed alcohol within six hours before the occurrence (yes, no). With regard to severity, the variables used were the nature of the injury (no injury, occurrence of bruises, cuts/lacerations, sprains/dislocations, fractures, etc.) and the outcome within 24 hours (discharge, admission, outpatient referral, indi-cation to another service, death, etc.).
To create clusters of fall victims, the variables associated with the circumstance, place of oc-currence (public road, residence, etc.), and type of fall (relative to victim’s own height, hole, bed, furniture, scaffolding, ladder/step, tree, roof/slab, other levels) were used. To create clusters of ac-cident victims, we used the variables type of vic-tim (pedestrian, driver, or passenger) and objects involved other than the victim (car, motorcycle, bus/minibus, bicycle, other).
Fr
eitas MG
values. In addition, when detailing the data in the results tables, broader categories were created de-pending on the similarity of these categories with each other in the clusters formed. The data were processed using SPSS software version 19.0 and Stata software version 6.0.
To apply the clustering method, all assump-tions were met. The criteria used for selecting the number of clusters was the Bayesian information criterion (BIC), and the distance measure used was the log-likelihood distance. Both BIC and distance were the default options in the SPSS soft-ware. Furthermore, the available sample weights were not used, considering that the application of the clustering method does not allow the
in-corporation of weights17. The assumptions
in-cluded the use of variables with binomial or mul-tinomial distribution and independence between the variables. However, even if these assumptions existed, the SPSS algorithm was robust to small
violations of these assumptions18. The technical
limitations included severe violations of the as-sumptions and the difficulty of finding patterns in a sample in which individuals are very
hetero-geneous (high degree of entropy)16.
Naming the clusters was a subjective process. However, attempts were made to standardize the names assigned to each cluster so that they would represent the most significant findings and guide the reader in understanding the main charac-teristics demarcated by the empirically obtained groups.
Results
General Information about the Sample Analyzed
The study sample included 2463 elderly peo-ple, of whom 1965 (79.8%) experienced falls and 498 (20.2%) were victims of traffic accidents. The two-step cluster analysis revealed four clusters of fall victims and two clusters of traffic accident victims. Both analyses indicated that part of the study sample could not be clustered in either of the two groups, and these individuals were desig-nated the unclassified group.
Fall victims
Among the elderly people grouped using the two-step cluster method (92.8% of the 1965 subjects), the average age was 73 ± 9.5 years, the median age was 72 (IQR: 65; 79), and 42.9% of
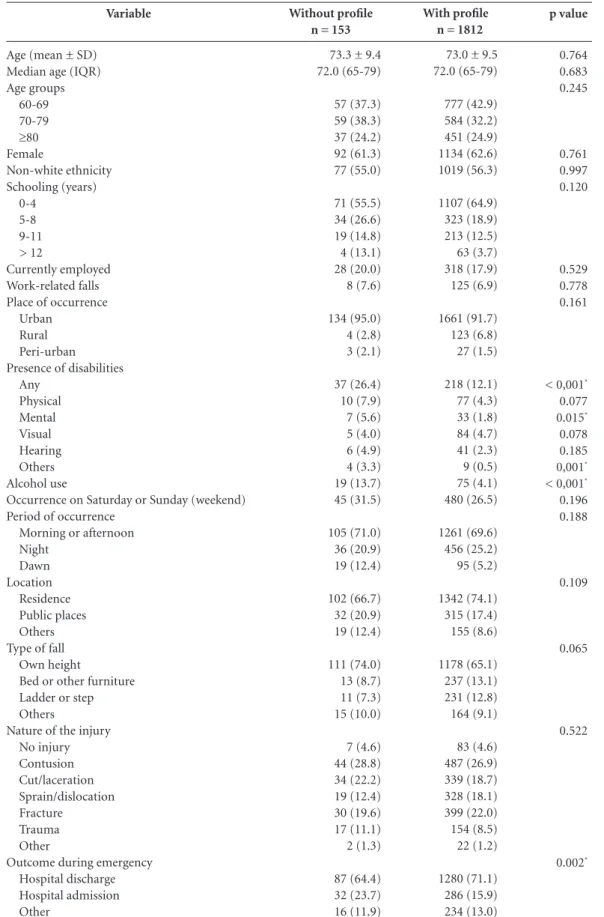
the study population was aged 60-69 years (Ta-ble 1). Most were women (62.6%), of non-white ethnicity (56.3%), with fewer than 5 years of schooling (64.9%), and most of the accidents oc-curred in urban areas (91.7%). Moreover, 17.9% of the study sample were employed, and 6.9% experienced work-related falls; 12.1% had some disability, the most common of which was visual disability (4.7%) followed by physical disability (4.3%); 4.1% of the study population consumed alcohol, and 26.5% of these cases occurred during the weekend, most often in the morning or afternoon (69.6%) and in the victim’s resi-dence (74.1%); 65.1% of the elderly experienced falls from their own height. Bruises and fractures were the most common injuries (26.9% and 22.0%, respectively). The most frequent outcome in emergencies was hospital discharge (71.1%).
The unclassified group included 153 elderly people (7.8%). The frequencies of any disabili-ty, mental disabilidisabili-ty, other disabilidisabili-ty, alcohol use, and hospitalization were significantly higher for elderly people in this group compared with the two-step clustered groups (p < 0.05). No other significant differences were observed between the groups.
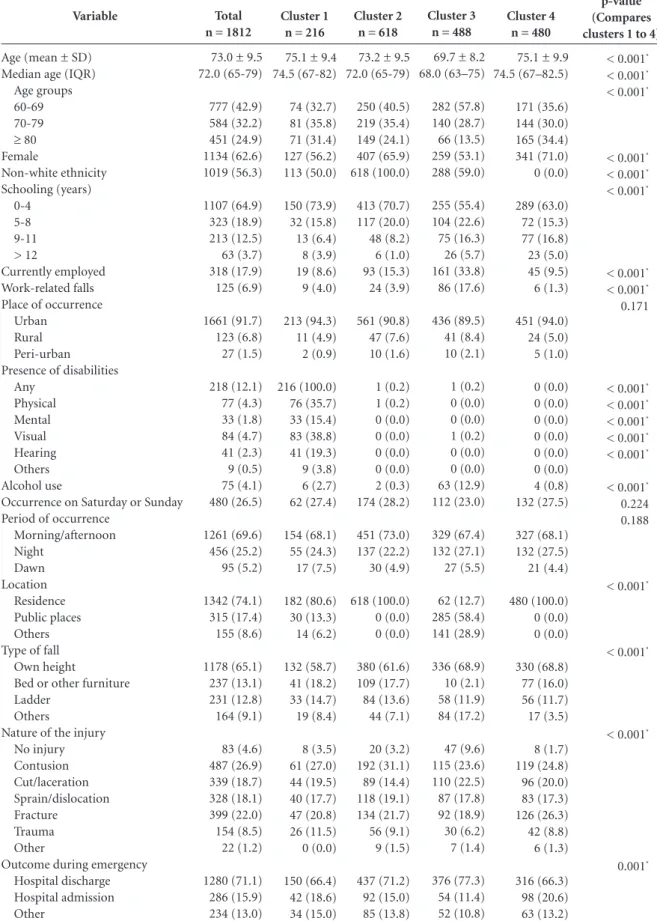
In the analysis of groups assigned to each cluster, the individuals in cluster 1 had a mean age (SD) of 75.1 (9.4) years and median age (IQR) of 74.5 (67; 82) years. Most were aged 70-79 years. In addition, 56.2% were women, 50% were of non-white ethnicity, 73.9% had fewer than 5 years of schooling, 8.6% were employed at the time of the occurrence, and 4% of falls were associated with work (Table 2). All participants had at least one disability, and 2.7% had recent-ly consumed alcohol. In addition, 80.6% of the falls occurred in the residence, 58.7% were from the victim’s own height, and 18.6% were from the bed or furniture. Bruises, fractures, and cuts/ lacerations occurred in 27.0%, 20.8%, and 19.5% of the study population, respectively. In addi-tion, 66.4% and 18.6% of the study group were discharged and admitted to the hospital, respec-tively. This cluster, designated elderly people with disabilities, represented 12.5% (n = 216) of the total number of fall victims who were assigned to clusters.
e C
ole
tiv
a,
20(3):701-712,
2015
Variable
Age (mean ± SD) Median age (IQR) Age groups
60-69 70-79 ≥80 Female
Non-white ethnicity Schooling (years)
0-4 5-8 9-11 > 12
Currently employed Work-related falls Place of occurrence
Urban Rural Peri-urban Presence of disabilities
Any Physical Mental Visual Hearing Others Alcohol use
Occurrence on Saturday or Sunday (weekend) Period of occurrence
Morning or afternoon Night
Dawn Location
Residence Public places Others Type of fall
Own height
Bed or other furniture Ladder or step Others
Nature of the injury No injury Contusion Cut/laceration Sprain/dislocation Fracture
Trauma Other
Outcome during emergency Hospital discharge Hospital admission Other
Table 1. Number and percentage of elderly victims of falls in the unclassified group (without profile) and those
allocated to clusters (with profile) – VIVA survey 2011.
Without profile n = 153
73.3 ± 9.4 72.0 (65-79)
57 (37.3) 59 (38.3) 37 (24.2) 92 (61.3) 77 (55.0)
71 (55.5) 34 (26.6) 19 (14.8) 4 (13.1) 28 (20.0) 8 (7.6)
134 (95.0) 4 (2.8) 3 (2.1)
37 (26.4) 10 (7.9) 7 (5.6) 5 (4.0) 6 (4.9) 4 (3.3) 19 (13.7) 45 (31.5)
105 (71.0) 36 (20.9) 19 (12.4)
102 (66.7) 32 (20.9) 19 (12.4)
111 (74.0) 13 (8.7) 11 (7.3) 15 (10.0)
7 (4.6) 44 (28.8) 34 (22.2) 19 (12.4) 30 (19.6) 17 (11.1) 2 (1.3)
87 (64.4) 32 (23.7) 16 (11.9)
With profile n = 1812
73.0 ± 9.5 72.0 (65-79)
777 (42.9) 584 (32.2) 451 (24.9) 1134 (62.6) 1019 (56.3)
1107 (64.9) 323 (18.9) 213 (12.5) 63 (3.7) 318 (17.9) 125 (6.9)
1661 (91.7) 123 (6.8) 27 (1.5)
218 (12.1) 77 (4.3) 33 (1.8) 84 (4.7) 41 (2.3) 9 (0.5) 75 (4.1) 480 (26.5)
1261 (69.6) 456 (25.2) 95 (5.2)
1342 (74.1) 315 (17.4) 155 (8.6)
1178 (65.1) 237 (13.1) 231 (12.8) 164 (9.1)
83 (4.6) 487 (26.9) 339 (18.7) 328 (18.1) 399 (22.0) 154 (8.5) 22 (1.2)
1280 (71.1) 286 (15.9) 234 (13.0)
p value
0.764 0.683 0.245
0.761 0.997 0.120
0.529 0.778 0.161
< 0,001*
0.077 0.015*
0.078 0.185 0,001*
< 0,001*
0.196 0.188
0.109
0.065
0.522
0.002*
Fr
eitas MG
Variable
Age (mean ± SD) Median age (IQR)
Age groups 60-69 70-79 ≥ 80 Female Non-white ethnicity Schooling (years) 0-4 5-8 9-11 > 12 Currently employed Work-related falls Place of occurrence
Urban Rural Peri-urban Presence of disabilities
Any Physical Mental Visual Hearing Others Alcohol use
Occurrence on Saturday or Sunday Period of occurrence
Morning/afternoon Night Dawn Location Residence Public places Others Type of fall
Own height
Bed or other furniture Ladder
Others
Nature of the injury No injury Contusion Cut/laceration Sprain/dislocation Fracture Trauma Other
Outcome during emergency Hospital discharge Hospital admission Other
Table 2. Number and percentage of older elderly victims of falls who were allocated into clusters (with profile) – VIVA Survey
2011.
Total n = 1812
73.0 ± 9.5 72.0 (65-79) 777 (42.9) 584 (32.2) 451 (24.9) 1134 (62.6) 1019 (56.3) 1107 (64.9) 323 (18.9) 213 (12.5) 63 (3.7) 318 (17.9) 125 (6.9) 1661 (91.7) 123 (6.8) 27 (1.5) 218 (12.1) 77 (4.3) 33 (1.8) 84 (4.7) 41 (2.3) 9 (0.5) 75 (4.1) 480 (26.5) 1261 (69.6) 456 (25.2) 95 (5.2) 1342 (74.1) 315 (17.4) 155 (8.6) 1178 (65.1) 237 (13.1) 231 (12.8) 164 (9.1) 83 (4.6) 487 (26.9) 339 (18.7) 328 (18.1) 399 (22.0) 154 (8.5) 22 (1.2) 1280 (71.1) 286 (15.9) 234 (13.0) Cluster 3 n = 488
69.7 ± 8.2 68.0 (63–75) 282 (57.8) 140 (28.7) 66 (13.5) 259 (53.1) 288 (59.0) 255 (55.4) 104 (22.6) 75 (16.3) 26 (5.7) 161 (33.8) 86 (17.6) 436 (89.5) 41 (8.4) 10 (2.1) 1 (0.2) 0 (0.0) 0 (0.0) 1 (0.2) 0 (0.0) 0 (0.0) 63 (12.9) 112 (23.0) 329 (67.4) 132 (27.1) 27 (5.5) 62 (12.7) 285 (58.4) 141 (28.9) 336 (68.9) 10 (2.1) 58 (11.9) 84 (17.2) 47 (9.6) 115 (23.6) 110 (22.5) 87 (17.8) 92 (18.9) 30 (6.2) 7 (1.4) 376 (77.3) 54 (11.4) 52 (10.8) Cluster 4 n = 480
75.1 ± 9.9 74.5 (67–82.5) 171 (35.6) 144 (30.0) 165 (34.4) 341 (71.0) 0 (0.0) 289 (63.0) 72 (15.3) 77 (16.8) 23 (5.0) 45 (9.5) 6 (1.3) 451 (94.0) 24 (5.0) 5 (1.0) 0 (0.0) 0 (0.0) 0 (0.0) 0 (0.0) 0 (0.0) 0 (0.0) 4 (0.8) 132 (27.5) 327 (68.1) 132 (27.5) 21 (4.4) 480 (100.0) 0 (0.0) 0 (0.0) 330 (68.8) 77 (16.0) 56 (11.7) 17 (3.5) 8 (1.7) 119 (24.8) 96 (20.0) 83 (17.3) 126 (26.3) 42 (8.8) 6 (1.3) 316 (66.3) 98 (20.6) 63 (13.2)
Note: For comparisons between clusters 1 to 4, Fisher’s exact test was used for the following variables: place of occurrence, presence of deficiencies, location and nature of the injury. * p < 0.05
Cluster 1 n = 216
75.1 ± 9.4 74.5 (67-82) 74 (32.7) 81 (35.8) 71 (31.4) 127 (56.2) 113 (50.0) 150 (73.9) 32 (15.8) 13 (6.4) 8 (3.9) 19 (8.6) 9 (4.0) 213 (94.3) 11 (4.9) 2 (0.9) 216 (100.0) 76 (35.7) 33 (15.4) 83 (38.8) 41 (19.3) 9 (3.8) 6 (2.7) 62 (27.4) 154 (68.1) 55 (24.3) 17 (7.5) 182 (80.6) 30 (13.3) 14 (6.2) 132 (58.7) 41 (18.2) 33 (14.7) 19 (8.4) 8 (3.5) 61 (27.0) 44 (19.5) 40 (17.7) 47 (20.8) 26 (11.5) 0 (0.0) 150 (66.4) 42 (18.6) 34 (15.0) Cluster 2 n = 618
73.2 ± 9.5 72.0 (65-79) 250 (40.5) 219 (35.4) 149 (24.1) 407 (65.9) 618 (100.0) 413 (70.7) 117 (20.0) 48 (8.2) 6 (1.0) 93 (15.3) 24 (3.9) 561 (90.8) 47 (7.6) 10 (1.6) 1 (0.2) 1 (0.2) 0 (0.0) 0 (0.0) 0 (0.0) 0 (0.0) 2 (0.3) 174 (28.2) 451 (73.0) 137 (22.2) 30 (4.9) 618 (100.0) 0 (0.0) 0 (0.0) 380 (61.6) 109 (17.7) 84 (13.6) 44 (7.1) 20 (3.2) 192 (31.1) 89 (14.4) 118 (19.1) 134 (21.7) 56 (9.1) 9 (1.5) 437 (71.2) 92 (15.0) 85 (13.8) p-value (Compares clusters 1 to 4)
< 0.001*
< 0.001*
< 0.001*
< 0.001*
< 0.001*
< 0.001*
< 0.001*
< 0.001*
0.171
< 0.001*
< 0.001*
< 0.001*
< 0.001*
< 0.001*
< 0.001*
0.224 0.188
< 0.001*
< 0.001*
< 0.001*
e C
ole
tiv
a,
20(3):701-712,
2015
employed at the time of the occurrence (15.6%). Only one subject showed a disability in this group, and there was virtually no involvement of alcohol (0.3%). All of the elderly people expe-rienced falls in the residence. The nature of the injury involved bruises for a higher percentage of elderly people (31.1%), and cuts/lacerations for a lower percentage (14.4%). Fractures were expe-rienced by a higher percentage of elderly people (21.7%) compared with subjects from cluster 1. Moreover, 71.2% and 15.0% of the study popu-lation were discharged and admitted to the hos-pital, respectively. This cluster, designated elderly people of non-white ethnicity experiencing falls in their residence, included 34.1% (n = 618) of the 1812 subjects classified.
Individuals from cluster 3 were the young-est, with > 50% aged 60-69 years, with a lower percentage of women and more schooling on av-erage (Table 2). A higher percentage of subjects in this cluster were employed, so the frequency of work-related falls was higher. The percentage of alcohol use and falls in public places was the highest in this cluster, and a lower percentage of falls occurred from the bed or other furniture than in other clusters. The frequency of individ-uals without injury was the highest among the clusters evaluated, with an even higher percent-age of those who were discharged from hospital. This group was designated the young and active elderly (n = 488; 26.9%).
Compared with the other clusters, cluster 4 had the highest percentage of the oldest elderly
– subjects aged ≥ 80 years – and the highest
per-centage of women, with all individuals of white ethnicity, and the lowest percentage of work-re-lated falls. All falls occurred in the residence, and no subjects had disabilities. This group had the lowest percentage of individuals without lesions and the highest percentage of individuals with fractures. In addition, this group had the highest percentage of hospital admissions and the lowest percentage of hospital discharges. Group 4 was designated the oldest elderly of white ethnicity (n = 480; 26.5%).
Elderly people victims of traffic accidents
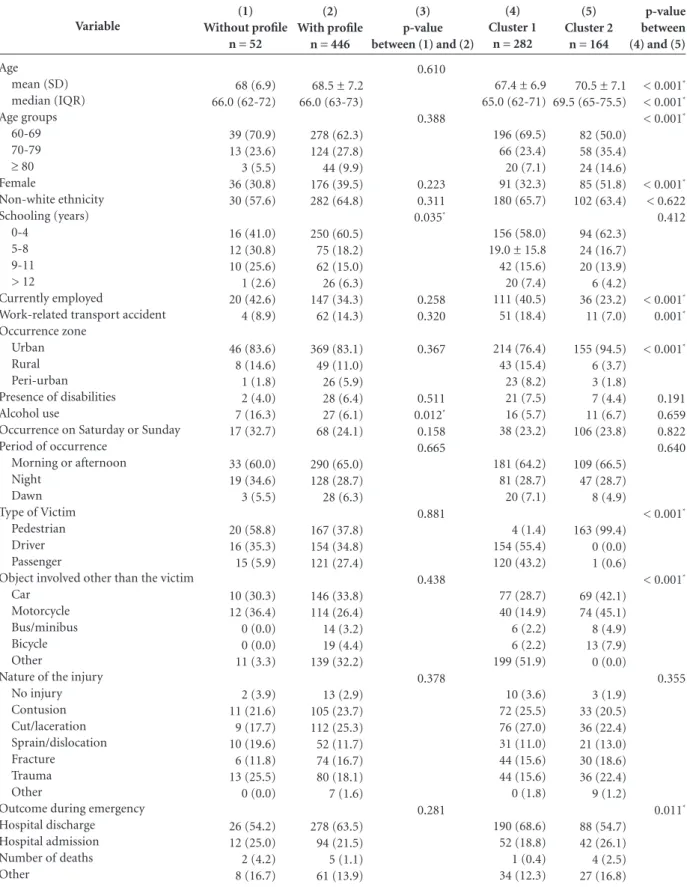
Of the 498 elderly victims of traffic accidents, 446 (89.6%) were grouped into clusters, and 52 were not grouped (10.4%) (unclassified group) (Table 3). The mean age of the 446 clustered in-dividuals was 68.5 ± 7.2 years. The median age was 66 years (IQR: 63; 73). Most individuals were aged 60-69 years (62.3%), and 39.5% were
wom-en; most were of non-white ethnicity (64.8%), with fewer than 5 years of schooling (60.5%), and most accidents occurred in urban areas (83.1%). On the date of the occurrence, 34.3% were employed and 14.3% of the cases involved work-related accidents; 6.4% of the individuals in this group had disabilities; 6.1% of this group had consumed alcohol. In addition, 24.1% of the accidents occurred on the weekend (Saturdays and Sundays), predominantly in the morning or the afternoon (65.0%). Most of the victims were pedestrians or drivers (37.8% and 34.8%, respec-tively), and 33.8% of the accidents involved cars, while 26.4% involved motorcycles. Cuts/lacera-tions, bruises, and trauma were the most com-mon injuries (25.3%, 23.7%, and 18.1%, respec-tively). The most frequent outcome was hospital discharge (63.5%).
The percentage of elderly people with up to 4 years of schooling was significantly lower in the unclassified group compared with the clus-tered groups (p < 0.05). Alcohol involvement was higher in the unclassified group (p < 0.05) compared with the other groups. No significant differences were observed for the other variables (Column 3, Table 3).
With regard to the clusters formed, elderly people from cluster 1 had a mean age (SD) of 67.4 (6.9) years and median age (IQR) of 65.0 (62; 71) years; 69.5% were aged 60-69 years, 32.3% were women, 65.7% were of non-white ethnicity, 58.0% had fewer than 5 years of schooling, and 76.4% of the traffic accidents occurred in urban areas. Furthermore, 40.5% of the group was em-ployed at the time, 18.4% of the accidents were related to work, 7.5% of the group had at least one disability, and 5.7% had consumed alco-hol. Only four individuals were pedestrians, and 55.4% were drivers. A fixed object or animal was involved in 51.9% of the cases. Cuts/lacerations, bruises, fractures, and trauma occurred in 27.0%, 25.5%, 15.6%, and 15.6% of the subjects, respec-tively, and 68.6% were discharged from hospital. This group was named the young and active el-derly people, drivers or passengers and repre-sented 62.3% (n = 282) of the elderly who were victims of traffic accidents and were assigned to clusters.
Individuals from cluster 2 were older than
those from cluster 1 and 50% were aged ≥ 70
Fr eitas MG Variable Age mean (SD) median (IQR) Age groups 60-69 70-79 ≥ 80 Female Non-white ethnicity Schooling (years) 0-4 5-8 9-11 > 12 Currently employed
Work-related transport accident Occurrence zone
Urban Rural Peri-urban Presence of disabilities Alcohol use
Occurrence on Saturday or Sunday Period of occurrence
Morning or afternoon Night
Dawn Type of Victim
Pedestrian Driver Passenger
Object involved other than the victim Car
Motorcycle Bus/minibus Bicycle Other
Nature of the injury No injury Contusion Cut/laceration Sprain/dislocation Fracture Trauma Other
Outcome during emergency Hospital discharge Hospital admission Number of deaths Other
Table 3. Number and percentage of elderly victims of traffic accidents in the unclassified group (without profile) and those allocated
to clusters (with profile) – VIVA survey 2011.
(1) Without profile
n = 52
68 (6.9) 66.0 (62-72) 39 (70.9) 13 (23.6) 3 (5.5) 36 (30.8) 30 (57.6) 16 (41.0) 12 (30.8) 10 (25.6) 1 (2.6) 20 (42.6) 4 (8.9) 46 (83.6) 8 (14.6) 1 (1.8) 2 (4.0) 7 (16.3) 17 (32.7) 33 (60.0) 19 (34.6) 3 (5.5) 20 (58.8) 16 (35.3) 15 (5.9) 10 (30.3) 12 (36.4) 0 (0.0) 0 (0.0) 11 (3.3) 2 (3.9) 11 (21.6) 9 (17.7) 10 (19.6) 6 (11.8) 13 (25.5) 0 (0.0) 26 (54.2) 12 (25.0) 2 (4.2) 8 (16.7) (4) Cluster 1
n = 282
67.4 ± 6.9 65.0 (62-71) 196 (69.5) 66 (23.4) 20 (7.1) 91 (32.3) 180 (65.7) 156 (58.0) 19.0 ± 15.8 42 (15.6) 20 (7.4) 111 (40.5) 51 (18.4) 214 (76.4) 43 (15.4) 23 (8.2) 21 (7.5) 16 (5.7) 38 (23.2) 181 (64.2) 81 (28.7) 20 (7.1) 4 (1.4) 154 (55.4) 120 (43.2) 77 (28.7) 40 (14.9) 6 (2.2) 6 (2.2) 199 (51.9) 10 (3.6) 72 (25.5) 76 (27.0) 31 (11.0) 44 (15.6) 44 (15.6) 0 (1.8) 190 (68.6) 52 (18.8) 1 (0.4) 34 (12.3) (5) Cluster 2
n = 164
70.5 ± 7.1 69.5 (65-75.5) 82 (50.0) 58 (35.4) 24 (14.6) 85 (51.8) 102 (63.4) 94 (62.3) 24 (16.7) 20 (13.9) 6 (4.2) 36 (23.2) 11 (7.0) 155 (94.5) 6 (3.7) 3 (1.8) 7 (4.4) 11 (6.7) 106 (23.8) 109 (66.5) 47 (28.7) 8 (4.9) 163 (99.4) 0 (0.0) 1 (0.6) 69 (42.1) 74 (45.1) 8 (4.9) 13 (7.9) 0 (0.0) 3 (1.9) 33 (20.5) 36 (22.4) 21 (13.0) 30 (18.6) 36 (22.4) 9 (1.2) 88 (54.7) 42 (26.1) 4 (2.5) 27 (16.8)
Note: For comparisons between the groups with and without profile, Fisher’s exact test was used for the following variables: age, age group, schooling, work-related transport accident, place of occurrence, time of occurrence, nature of injury, and outcome during emergency. For comparisons between profiles 1 and 2, Fisher’s exact test was used for the following variables: place of occurrence, type of victim, object involved other than the victim, nature of the injury, and outcome during emergency. * p < 0.05
(2) With profile
n = 446
68.5 ± 7.2 66.0 (63-73) 278 (62.3) 124 (27.8) 44 (9.9) 176 (39.5) 282 (64.8) 250 (60.5) 75 (18.2) 62 (15.0) 26 (6.3) 147 (34.3) 62 (14.3) 369 (83.1) 49 (11.0) 26 (5.9) 28 (6.4) 27 (6.1) 68 (24.1) 290 (65.0) 128 (28.7) 28 (6.3) 167 (37.8) 154 (34.8) 121 (27.4) 146 (33.8) 114 (26.4) 14 (3.2) 19 (4.4) 139 (32.2) 13 (2.9) 105 (23.7) 112 (25.3) 52 (11.7) 74 (16.7) 80 (18.1) 7 (1.6) 278 (63.5) 94 (21.5) 5 (1.1) 61 (13.9) (3) p-value between (1) and (2)
0.610 0.388 0.223 0.311 0.035* 0.258 0.320 0.367 0.511 0.012* 0.158 0.665 0.881 0.438 0.378 0.281 p-value between (4) and (5)
< 0.001*
< 0.001*
< 0.001*
< 0.001*
< 0.622 0.412
< 0.001*
0.001*
< 0.001*
0.191 0.659 0.822 0.640
< 0.001*
< 0.001*
0.355
e C
ole
tiv
a,
20(3):701-712,
2015
motorcycles were involved in 42.1% or 45.1% of the traffic accidents, respectively. Cuts/lacera-tions, trauma, bruises, and fractures occurred in 22.4%, 22.4%, 20.5%, and 18.6% of the subjects, respectively. In addition, 54.7% of the individu-als in this group were discharged from hospital. This cluster was designated the oldest elderly, pedestrians, with more severe outcomes and rep-resented 37.7% (n = 164) of those allocated into clusters.
Discussion
External causes are represented primarily by falls and traffic accidents and are considered import-ant determinimport-ants of morbidity and mortality among elderly people. For decades, falls have been recognized by health professionals as a
le-sion etiology19,20. However, more recently, they
have been included as an independent marker of
frailty, particularly among elderly people20.
The impact of falls can be quite severe. There is evidence of an indirect association between high mortality and fall-related injuries that can last for
a long time after treatment of the outcomes21. In
addition, more than 50% of elderly people who
have experienced afall develop the fear of falling
again (ptophobia), with consequent physical in-activity, worsening of balance, and increased risk of additional falls. Fall-related accidents account for 40% of the events that lead to hospitalization
of elderly people 22. Therefore, they are considered
a health problem, and some scholars consider
them a unique geriatric syndrome23.
In the analyzed sample, the frequency of complications due to falls (or presence of lesions)
was higher than previously reported12,24, and the
incidence of falls was 95% most likely because the target population sought urgent or emergen-cy medical care.
The unclassified group, although they were not allocated to any particular cluster using sta-tistical procedures, included many individuals at risk and who had permanent disabilities and se-vere outcomes that should be acknowledged for the design of specific public policies. This group had a higher risk of hospitalization, which in turn was associated with functional decline and
disability25.
With regard to cluster 1, our results indicate that falls occurred predominantly in the residence (> 80%). For this group, interventions aimed at rehabilitation and at increased accessibility to mitigate the effects of disability are essential.
With respect to cluster 2, all fall accidents oc-curred in the residence and were not associated with work, highlighting the importance of inter-ventions aimed at the safety of elderly people in
their residence26. A recent study that evaluated
the home environment in Brazil indicated that the more frequent risks of falling in descend-ing order were the absence of handle bars in the bathroom, the presence of carpets, the presence of steps, the absence of non-slip carpets in the bathroom, and difficulty in accessing the light
switch26.
In cluster 3, the highest percentage of falls from the victims’ own height was observed. In fact, falls from one’s own height are considered a public health problem because of their high
fre-quency and direct and indirect effects on health27.
They occur primarily among elderly people but can also occur in epileptics, chronic alcoholics, and drug addicts. They can cause major injuries and injuries that can result in imminent risk of death, and they can worsen previous morbid
states27. Notably, with the increased longevity
of elderly people, pre-existing conditions that predispose to falls from own height can increase with age. Therefore, prospectively, this event
should become increasingly frequent26. The
anal-ysis of this cluster indicated that it is necessary to resort to multidisciplinary resources for the health care of elderly people—particularly those with diseases that limit their autonomy—to un-derstand the specifics of aging.
The group with the greatest risk of compli-cations was cluster 4, especially considering the risk of increased frailty in these individuals. They
represented more than 25% of thesample and,
in view of the progressively aging population, constituted a group that will be increasingly prevalent in the population over time. The falls more commonly associated with complications occurred in the victim’s residence, were associat-ed with neither the use of alcohol nor with work accidents, and occurred predominantly from the victim’s own height. Accordingly, special at-tention should be given to the planning of care services for this age group, including home care, in view of the high risk of fractures and injuries in general.
Young-Fr
eitas MG
er elderly, active, drivers or passengers (cluster 1) were composed predominantly of men.
Cluster 2 included the oldest elderly, pedes-trians, those with more severe outcomes, and consisted of men and women in equal propor-tions. In both clusters, a high prevalence of traffic accidents involving motorcycles was observed, especially among elderly pedestrians. Although traffic accidents are considered preventable caus-es this type of accident is increasingly common in Brazil, especially motorcycle accidents, which
have been gradually increasing10,28.
The analysis of cluster 2 indicates the in-creased risk of being run over among elderly peo-ple with more advanced age. Among the traffic accidents, being run over is the principal cause
of death for this group28. This is due to decreased
reflexes, agility, and strength that gradually occur with the aging process, combined with the in-creased prevalence of chronic diseases and
poly-pharmacy for treatment of comorbidities29.
The prevalence of complications was simi-lar among the groups who were victims of falls and traffic accidents. Understanding this reality is fundamental because the risk of complications from falls from one’s own height is similar to the risk of complications from traffic accidents. Therefore, the risk of falls should not be under-estimated, and even in the context of the ever-in-creasing number of traffic accidents in Brazil, the risk should not be relativized. In fact, the inci-dence of fractures was higher for falls than for traffic accidents.
In routine visits to health professionals, el-derly people should be asked at least once a year
about the occurrence of falls13. The conditions
that can lead to falls should be identified,
pre-vented, and treated, including the inappropriate use of drugs, orthostatic hypotension, dementia, depression, and changes in balance and muscle strength, which, combined with the increased prevalence of osteoporosis, can significantly
in-crease the risk of fractures in this group30. There
is evidence that prevention programs conducted
in communities and in long-term institutions
are effective for decreasing the incidence of falls. Therefore, professionals need training to assist the elderly population the in areas of geriatrics
and gerontology13.
It is important to note that elderly people should not be excessively worried about the risk of falls and their complications because this at-titude can further aggravate the feeling of low self-efficacy or low confidence in avoiding falls. They should acknowledge that these falls are not intentional but are due to health problems that should be investigated and treated proper-ly. Therefore, falls should be treated as a health problem and not as an option that is under the control of the patient.
This study addressed important aspects relat-ed to falls and traffic accidents involving elderly people but has some limitations. First, it could not use the sample weights in applying the two-step cluster procedure. However, even among statisticians, the use of weights in the estimates is a controversial issue, and not having used weights
does not invalidate the results obtained31. Despite
e C
ole
tiv
a,
20(3):701-712,
2015
Collaborations
MG Freitas, PF Bonolo, and CJ Machado worked on the study design, the preparation of the initial and final versions of the manuscript, and on the final draft; MG Freitas and CJ Machado worked on the methodology; EN de Moraes worked on the initial and final versions of the manuscript; all authors worked on the critical revision of the manuscript and read and approved the final ver-sion.
References
Instituto Brasileiro de Geografia e Estatística (IBGE). Censo demográfico 2010. Sinopse do censo e resultados preliminares do universo. Rio de Janeiro: IBGE; 2011. [acessado em 2014 jun 30]. Disponível em: http:// www.ibge.gov.br/home/presidencia/noticias/imprensa /ppts/0000000402.pdf
Assis M. Envelhecimento ativo e promoção da saúde: reflexão para as ações educativas com idosos. Rev APS 2005; 8(1):15-24.
Veras R. Envelhecimento populacional contemporâ-neo: demandas, desafios e inovações. Rev Saude Publica 2009; 43(3):548-554.
Minayo MCS. O envelhecimento da população brasi-leira e os desafios para o setor saúde. Cad Saude Publica 2012; 28(2):208-209.
Ayres JRCM, Calazans GJ, Saletti-Filho HC, França-Jú-nior I. Risco, vulnerabilidade e práticas de prevenção e promoção da saúde. In: Campos GWS, Bonfim JRA, Minayo MCS, Akerman M, Júnior MD, Carvalho YM, organizadores. Tratado de Saúde Coletiva. São Paulo: Hucitec; 2014. p. 117-139.
Silva A, Faleiros HH, Shimizu WAL, Nogueira LM, Nhãn LL, Silva BMF, Otuyama PM. Prevalência de que-das e de fatores associados em idosos segundo etnia. Cien Saude Colet 2012; 17(8):2181-2190.
Minayo MCS. Violência contra idosos: relevância para um velho problema. Cad Saude Publica 2003; 19(3):783-791.
Terroso M, Rosa N, Marques AT, Simões R. Physical consequences of falls in the elderly: a literature review from 1995 to 2010. Eur Rev Agin Phys Act 2014; 11:51-59.
Yiannakoulias N, Rowe BH, Svenson LW, Schopflocher DP, Kelly K, Voaklander DC. Zones of prevention: the geography of fall injuries in the elderly. Soc Sci Med 2003; 57(11):2065-2073.
Reichenheim ME, Souza ER, Moraes CL, Jorge MHPM, Silva CMFP, Minayo MCS. Violência e lesões no Bra-sil: efeitos, avanços alcançados e desafios futuros. [site da Internet]. [acessado 2014 jun 30]. Disponível em: http://download.thelancet.com/flatcontentassets/pdfs/ brazil/brazilpor5.pdf.
Phillips J, Walford N, Hockey A, Foreman N, Lewis M. Older people and outdoor environments: pedestrian anxieties and barriers in the use of familiar and unfa-miliar spaces. Geoforum 2013; 47:113-124.
Gawryszewski VP. A importância das quedas no mes-mo nível entre idosos no estado de São Paulo. Rev Assoc Med Bras 2010; 56(2):162-167.
Maciel A. Quedas em idosos: um problema de saúde pública desconhecido pela comunidade e negligencia-do por muitos profissionais da saúde e por autorida-des sanitárias brasileiras. Rev Med Minas Gerais 2010; 20(4):554-557.
Neves ACM, Mascarenhas MDM, Silva MMA, Malta DC. Perfil das vítimas de violências e acidentes aten-didas em serviços de urgência e emergência do Sistema Único de Saúde em Capitais Brasileiras - 2011. Epide-miol Serv Saúde 2013; 22(4):587-596.
Verma JP. Cluster Analysis: For Segmenting the Popu-lation. 2013 In: Verma JP, editor. Data Analysis Mana-gement with SPSS software. New Delhi: Springer India; 2013. p. 317-358.
1.
2.
3.
4.
5.
6.
7.
8.
9.
10.
11.
12.
13.
14.
Fr
eitas MG
Shih MY, Jheng JW, Lai LF. Two-Step Method for Clus-tering Mixed Categorical and Numeric Data. Tamkang Journal of Science and Engineering 2010; 13(1):11-19. IBM Spss Statistics Base. [acessado 2014 jul 10]. Dispo-nível em: http://www.spss.com.br/software/statistics/ download/IBM%20SPSS%20Statistics%20Base%20 Especificacoes%2021.pdf
Cluster Analysis. [acessado 2014 nov 26]. Disponível em: http://www.norusis.com/pdf/SPC_v13.pdf Tinetti ME. Preventing Falls in Elderly Persons. N Engl J Med 2003; 348(1):42-49.
Shim EY, Ma SH, Hong SH, Lee YS, Paik WY, Seo DS, Yoo EY, Kim MY, Yoon JL. Correlation between frailty level and adverse health-related outcomes of community-dwelling elderly, one year retrospective study. Korean J Fam Med 2011; 32(4):249-256. Tinetti ME, Inouye SK, Gill TM, Doucette JT. Shared risk factors for falls, incontinence, and functional de-pendence: unifying the approach to geriatric syndro-mes. JAMA 1995; 273(17):1348-1353.
Tinetti ME, Williams CS. Falls, Injuries Due to Falls, and the Risk of Admission to a Nursing Home. N Engl J Med1997; 337(18):1279-1284.
Soriano TA, DeCherrie LV, Thomas DC. Falls in the community-dwelling older adult: a review for primary-care providers. Clin Interv Aging 2007; 2(4):545-554. Maia BC, Viana OS, Arantes PMM, Alencar MA. Con-sequências das quedas em idosos vivendo na comuni-dade: revisão sistemática. Rev. Bras. Geriatr. Gerontol 2011; 14(2):381-394.
Boyd CM, Xue QL, Guralnik JM, Fried LP. Hospitali-zation and development of dependence in activities of daily living in a cohort of disabled older women: the Women’s Health and Aging Study I. J Gerontol A Biol Sci Med Sci 2005; 60(7):888-893.
Piovesan AC, Pivetta HMF, Peixoto JMB. Fatores que predispõem a queda em idosos residentes na região oeste de Santa Maria, RS. Rev. Bras. Geriatr. Gerontol; 14(1):75-84.
Parreira JG, Vianna AMF, Cardoso GS, Karakhanian, WZ, Calil D, Perlingeiro JAG, Soldá SC, Assef JC. Lesões graves em vítimas de queda da própria altura. Rev Assoc Med Bras 2010; 56(6):660-664.
Vinic ALT, Bahia CA, Malta DC, Mascarenhas MDM, Montenegro MMS, Silva MMA, Monteiro RA. Perfil e tendência dos acidentes de transporte terrestre no Bra-sil, 2000 a 2012. In: Brasil. Ministério da Saúde (MS). Secretaria de Vigilância em Saúde. Saúde Brasil 2013: uma análise da situação de saúde e das doenças trans-missíveis relacionadas à pobreza. Brasília: MS; 2014. p. 177-194.
Júnior CAB, Folchini AB, Ruediger RR. Estudo compa-rativo entre o trauma em idosos e não idosos atendidos em um Hospital Universitário de Curitiba. Rev. Col. Bras. Cir. 2013; 40(4):281-286.
Ganz DA, Bao Y, Shekelle PG, Rubenstein LZ. Will my patient fall? JAMA 2007; 297(1):77-86.
Ciol MA, Hoffman JM, Dudgeon BJ, Shumway-Cook A, Yorkston KM, Chan L. Understanding the use of weights in the analysis of data from multistage surveys. Arch Phys Med Rehabil 2006; 87(2):299-303.
Article Submitted on 09/24/2014 Approved on 12/01/2014
Final version submitted on 12/03/2014 16.
17.
18. 19. 20.
21.
22.
23.
24.
25.
26.
27.
28.
29.