ATTITUDES
TOWARD POPULATION
CONTROL IN
SANTIAGO, CHILE’
M-Francoise HalI, M.D.2
This article describes a survey of Chilean attitudes toward national population growth. The results suggest that men in poorer socioeconomic groups know less about this subject
than their better-off conterparts. Nevertheless, they more often feel that Chile has “too many” inhabitants, that recent population growth has been rapid, and that this rate ofgrowth should be reduced.
Introduction
The decade of the 1960’s saw the beginning of a new kind of survey in Latin America-the
“KAP” type of survey seeking to measure people’s knowledge, attitudes, and practices with regard to fertility and its control. Apart from the direct gain in knowledge about public behavior and attitudes concerning contracep- tion, abortion, and desired family size, the surveys contributed to a number of significant trends. One of these was a growing public awareness of the family planning issue and its emergence as an unemotional, scientifically acceptable topic for discussion.
The present survey, done at the beginning of the 1970’s, hopefully marks the start of another similar trend-with the subject for analysis changed from family planning on an individual scale to population planning on a national scale. To the author’s knowledge, this study is the first KAP-type survey in Latin American focusing on national population con-
lAlso appearing in Spanish in the Boletin de la
Oficina Sanitaria Panamericana, October 1975. ZAssistant Professor, Department of International Health, Johns Hopkins University School of Hygiene, 615 K Wolfe St., Baltimore, Maryland 21205.
trol, providing sample coverage of all socio- economic levels in a broad segment of the population, and dealing with males of an economically productive age rather than child- bearing females.
This study is exploratory. Its main purpose is to obtain evidence on the nature of differ- ences between subgroups, and it is this general evidence, rather than minor variations in per- centages, that is important. Though significance tests were done during the analysis, they are not mentioned in this report, as it was felt that they would misplace the desired emphasis. Moreover, they would create an impression that the figures obtained are accurate to within a small margin of error, when in fact this is not so. Hopefully, the experience gained in this study will lead to more comprehensive and more definitive studies in the near future, as the subject has tremendous implications for the well-being of mankind.
Demographic and sociopolitical considera- tions underlying this survey will not be re- viewed here. Instead, the reader is referred to recent analyses by the author on this topic (1, 2) which indicate the issue’s abstract character (a factor hindering study of public attitudes) as well as its political sensitivity.
Hall . POPULATION CONTROL IN SANTIAGO, CHILE 197
Methodology
Sample Selection
A sample was designed and obtained specif- ically for purposes of this study by the School for Statistical Technicians of the Faculty of Economic Sciences at the University of Chile. Dr. Alfonso Rodriguez, Professor of Statistics at the school and a staff member of the university’s Center for Mathematical Research (CEDEM), used this work as a practical exercise in his third-year course for statistical tech- nicians.
Students participated at all stages of sample design and field work, under Dr. Rodriguez’ supervision. This arrangement was mutually beneficial for both parties, giving needed “real” field experience to the students while providing the author with an excellent sample at an economical price.
The sample consisted of 1,410 men 20 to 54 years of age in urban Santiago, who were classified according to socioeconomic and edu- cational levels as follows:
Socioeconomic Educational
level level
Number of men
High University, 3 or more years Less than 3 years of University 266 266
Middle University, 3 or more years 218 Less than 3 years of University 220
Low Schooling, 7 or more years Less than 7 years of schooling 220 220
The socioeconomic level of each participant was judged subjectively by the students when they made a house-to-house census during the first stage of sample preparation. This judgment was guided by written criteria which were thoroughly discussed during several group train- ing sessions held before the census. Male educa- tional levels and ages were also determined during this census by briefly interviewing an adult resident in each housing unit covered. The interview provided the information needed to list all residents by first name, age, sex, and
level of education. The sampling procedure used is described in detail in Appendix 1.
The Questionnaire
A questionnaire was made up that contained both multiple-choice and open-ended questions. These were designed to provide basic socio- demographic information and to indicate the participant’s attitude toward the size of Chile’s population, perceived changes in this size, and the perceived roles of the Government and the Church. Attitudes toward individual family size, a subject not discussed here, were also covered. The possible answers provided for the multiple-choice questions were arrived at after extensive and repeated field testing of the questionnaire. The coding procedure for the open-ended questions is described in Appendix 2.
Interviews
Thirty-six students at the University of Chile, most of them engineering or social science graduate students, were hired to do the interviews. All of them were males and all had some previous interviewing experience. Their training included a series of six classroom sessions, during which the questionnaire was analyzed in detail, and class exercises involving two practice interviews in the field, the results of which were discussed in class and indi- vidually. About half of the interviewers, as well as their direct supervisor, Dr. Rodriguez, had participated in a similar study done by the author about two years before. This experience proved very valuable in classroom discussions and in providing general guidance for the less experienced interviewers.
198 PAHO BULLETIN . Vol. IX, No. 3, 1975
TABLE 1 -Sociodemographic characteristics of the men interviewed (Santiago, Chile, 1970).
Socioeconomic levels and educational groups upper level Middle level Lower level
University School
(23 years) Other University ( 23 years) Other ( 87 years) Other Number of respondents (N)a
A&g: 20-29 (%) 30-39 (%) 40-54 (%) Marital status:
I" a marital unionb (%) Other (%)
Number of children (mean) Birthplace:
Santiago (%) Other (%) Religious affiliation:
Yes (a) No (%)
I”S”r.%“Ce:
Insuredc (%)
Uninsured ("/.) Membership in a"
association or group: d Yes (%)
No tij
Number of people supervised
at work:e 15 or less (%) 16 or nuae (70) -i%%n't to "good" (%)
"poor" (x)
167 178 159 180 169 177
40 36 50 41 40 30
23 20 28 24 26 28
37 44 22 35 34 42
67 72 58 69 73 78
33 28 42 31 27 22
2.0 2.1 1.5 2.1 2.3 3.1
62 66 55 61 63 40
38 34 45 39 37 60
74 84 59 83 88 75
26 16 41 17 12 25
70 68 85 72 65 58
30 32 15 28 35 42
64 63 55 52 52 46
36 37 45 48 40 54
74 78 88 91 92 99
26 22 12 9 8 1
100 100 90 7s 54 25
0 0 10 25 46 75
aThe numbers of answers missing were as follows: Age--2; marital status--3; number of children--21; birthplace--3; religion--10; social security-- 137; association or group mem- bership--3: number of people supervised at work--130; housing quality--20.
bLega1 or consensual union.
Cue question was "DO you have any type of insurance at the present time?"
dThe question was 'I would like to ask you if you are a member of some association or organized group such as a club, syndicate, political party, sports society, or any other type of association. Don't tell me the name of the association, just whether you are a member."
eThe questions asked were 'Do you have (if retired, did you have) people under your supervision in your work?" And if so, "About how many people?"
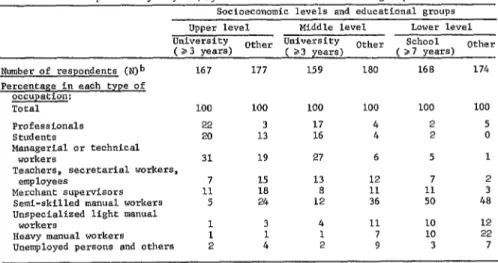
TABLE 2-Occupationa of subjects, by education and socioeconomic group.
Socioeconomic levels and educational groups upper level Middle level Lower level University
( 23 years) Other University (23 y WITS) Other
School
( b7 years) Other Number of respondents (mb 167 177 159 180 168 174 Percentage in each type of
occupation:
Total 100 100 100 100 100 100
Professionals 22 3 17 4 2 5
students 20 13 16 4 2 0
Managerial or technical
workers 31 19 27 6 5 1
Teachers, secretarial workers,
employees 7 15 13 12 7 2
Merchant supervisors 11 18 a 11 11 3 Semi-skilled manual workers 5 24 12 36 50 48 Unspecialized light manual
workers 1 3 4 11 10 12
Heavy manual workers 1 1 1 7 10 22 unemployed persons and others 2 4 2 9 3 7
aCurrent occupation, or last occupation if retired.
Hall . POPULATION CONTROL IN SANTIAGO, CHILE 199
payment for any interviewing by the respon- sible interviewer would be forfeit. Although seemingly hard on the interviewers, this regula- tion may have had a very beneficial effect on the study. The field work was completed within a month and the interviewing proved to have been conscientiously done. It turned out that no payment had to be cancelled, and in fact a gratifying spirit of camaraderie prevailed, encouraged by the mutual interdependence of the group.
Attempts to obtain an interview were some- times heroic. In most cases many more than the required minimum of three visits were made to the subject’s house. In no case, of course, was the replacement of a man originally in the sample acceptable, nor was it acceptable to trace a man who had moved and to interview him at his new place of residence. All the field work was carried out in the month of October
1970.
Before each questioning session began, the interviewer would introduce himself, show his credentials, and explain the purpose of the study. A brief background description of the study was also presented on the front page of the questionnaire. A translation of this intro- ductory text appears in Appendix 3.
Interview Characteristics
The interviews took an average of 25 minutes each. Good cooperation by the res- pondent was obtained in a great majority of cases. Most of the spontaneous comments volunteered after the interview were favorable, and the quality of the interview as judged by the interviewer was generally good.
Basic Respondent Characteristics
Table 1 summarizes major sociodemographic characteristics of the respondents. Men of the middle socioeconomic level with three or more years of university training tended to be younger than those in the other strata. They also showed less tendency to be married and had comparatively fewer children.
Table 2 summarizes the respondents’ occupations. As expected, there was a high degree of correlation between the socio- economic and educational category in which each man was placed as a result of the house-to-house census and his socioeconomic status as indicated by the occupation reported during the course of the later interview.
Results
InterviewsNot Obtained Knowledge about the Census of 1970
Of the total 1,410 men in the sample, 20 were foreigners and thus not eligible to be interviewed. Of the 1,390 remaining, 360 could not be interviewed. Explicit refusal accounted for only 67 of these. A variety of reasons, presumably covering a desire not to be inter- viewed in some cases, were given by another 109 subjects. The respondent was unavailable due to temporary or permanent absence in 156 cases, in eight cases the address could not be located, and in 20 the reason for failure to obtain the interview was unclear.
200 PAHO BULLETIN . Vol. IX, No. 3, 197.5
to be around 9.3 million, whereas prior official projections had placed it at 9.7 million.
These events provided us with an opportu- nity to assess the respondents’ awareness and interest concerning population matters. We therefore sought to find out how much know- ledge they had acquired.
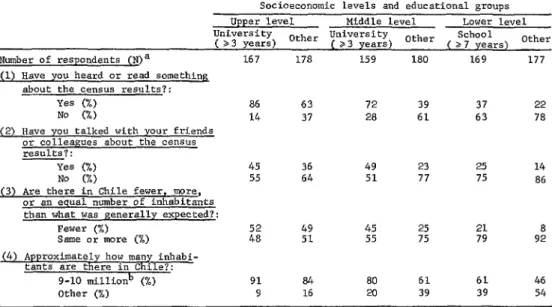
Well over 90 per cent of the people in all six categories responded affirmatively to the question “Has there been a counting, that is, a census of the number of inhabitants in the country this year? ” Of course, as Table 3 shows, fewer knew of the census results. In the uppermost stratum, 86 per cent of the men had heard or read something about the results, less than half had discussed these results with friends or colleagues, and about half were aware that fewer than the expected number of in- habitants had been reported. These proportions fell rapidly as socioeconomic and educational levels declined. In the lowest stratum, 22 per cent of the men had heard or read something about the results, 14 per cent had talked about the results with friends or colleagues, and only
8 per cent were aware of the unexpectedly low result.
The actual size of Chile’s population was relatively well-known at all levels. In the top stratum, 91 per cent of the men gave an answer within what we defined as the correct range (9-10 million), and even in the lowest stratum 46 per cent answered correctly.
Attitudes on Population Size
All respondents, no matter what their answers to previous questions, were asked the following: “Do you think that the country has too few inhabitants, too many inhabitants, or that the number of inhabitants is fine? ” The results, summarized in Table 4, show the first signs of a trend confirmed by data to be presented later. That is, despite being much less informed about population matters than their more educated counterparts, men in the lower levels seemed nevertheless to have more of a sense of crowding, a sense of what could
TABLE 3-Knowledge of 1970 census results, including only subjects aware that the census had occurred.
Socioeconomic levels and educational groups upper level Middle level Lower level University
(23 years) Other University (r3y ears) Other >S;hool , yeal%) Other
Number of respondents (N)a 167 178 159 180 169 177 (1)
about the census results?:
Yes (n) 86 63 72 39 37 22
NO (%) 14 37 28 61 63 78
(2) Have you talked with your friends or colleagues about the census results?:
Yes (%) 45 36 49 23 25 14
No (x) 55 64 51 77 75 86
(3) Are there in Chile fewer, more, or an equal number of inhabitants than what was generally expected?:
Fewer (%) 49 45 25 21 8
same or more (x) 2: 51 55 75 79 92 (4) Approximately how many inhabi-
tants are there in Chile?: 9-10 millionb (%) Other (%)
91 84 80 61 61 46
9 16 20 39 39 54
%e numbers of answers missing were as follows: Question l--65; Question 2--73; Question 3--169; Question 4--85.
Hall . POPULATION CONTROL IN SANTIAGO, CHILE 201
TABLE 4-Opinions about current population size. --
Socioeconomic levels and educational groups upper level Middle level Lower level University Other University
Other school
(83 years) (33 years) (>7 years) Other DO you think that the country has
too few inhabitants, too many inhab- itants, or that the number of inhab- itants is fine?
Number of respondents (Nja "Too few" (x)
"Too many" (%) "Fine" (%)
why do you think there are "too few" inhabitants?
Number of respondents (Njb Territorial ceaSonS (XII Natural resource reaSonS (%) Other reasons (%)
163 173 157 175 162 164
69 58 53 42 39 31
4 6 8 8 6 13
27 36 39 50 55 56
112 102 84 73 63
68 69 60 63 64
23 15 19 11 14
9 16 21 26 22
47 60 21 19 a@nber of answers missing: 36.
bNumber of answers missing: 25.
perhaps be called population pressure. At the top level, as many as two-thirds of the men thought that Chile had “too few” inhabitants at the present time and only 4 per cent thought there were “too many.” At the lowest level, only one-third of the men thought there were “too few” inhabitants and 13 per cent thought there were “too many.”
Most of the reasons given for thinking that the country had “too few” inhabitants centered on the population’s small size relative to the national territory and the availability of natural resources. Reasons for thinking that the coun- try had “too many” inhabitants were based almost entirely on economic considerations. Those who thought that the number of the country’s inhabitants was “fine” were about equally divided between those noting that Chile was capable of supporting this number and those reasoning that more inhabitants would only bring the country more problems.
Attitudes on Population Growth
Almost all the respondents (98 per cent) answered “more” to the question “Are there
202 PAHO BULLETIN . Vol. IX, No. 3, 1975
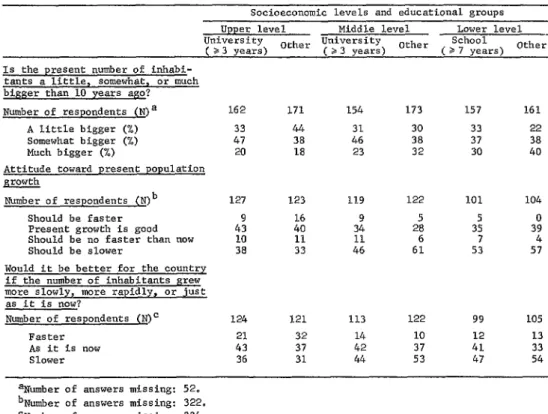
TABLE S-Opinions about current population growth.
Socioeconomic levels and educational groups upper level Middle level Lower level _ University
( 23 years) Orher University (23 years) Other c;;h;;'rs, Other Is the present number of inhabi-
tants a little, somewhat, or much bigger than 10 years ago? Number of respondents (Nja
A little bigger (x) Somewhat bigger (x) Much bigger (x)
Attitude toward present population growth
Number of respondents (Njb Should be faster Present growth is good Should be no faster than now Should be slower
Would it be better for the country if the number of inhabitants grew more slowly, more rapidly, or just as it is now?
Number of respondents (N)= Faster
As it is now Slower
162 171
33 44
47 38
20 18
127 493 10 38
123 119 122 101 104
2: 11 33
9 34 11 46
5
28 3: 309
6 7 4
61 53 57
124 121 113 122 99 105
21 32 14 10 12 13
43 37 42 37 41 33
36 31 44 53 47 54
154 173 157 161
31 30 33 22
46 38 37 38
23 32 30 40
aNumber of answers missing: 52. bNumber of answers missing: 322. CNumber of answers missing: 334.
immaterial for the country that the number of inhabitants should grow this way? ” (“This way” implied at whatever rate the respondent had indicated earlier, as selected from the choices of a little, somewhat, or a lot.) And this was followed by the query “Why is it good (bad) that the number of inhabitants should grow this way? ” The results, summarized in the middle portion of Table 5, again showed a clear difference in the attitudes at upper and lower socioeconomic levels. The percentages of respondents desiring faster growth than the rate perceived represented 14, 7, and 3 per cent of the men in the upper, middle, and lower socioeconomic levels, respectively. The percent- ages desiring slower growth represented 3654, and 54 per cent, respectively.
Analysis of the reasons given for wanting slower growth showed concern about un- employment, particularly in the lower strata. Proceeding from top to bottom, men who
specifically cited unemployment as underlying their belief that population growth should be slower accounted for 4,4,7, 11, 15, and 14 per cent of those in the six educational and socioeconomic categories.
The next question asked was “Would it be better for the country if the number of inhabitants grew more slowly, more rapidly, or the same way as now? ” Again, men in the lower strata showed a preference for slower growth more often than those in the upper strata. Respective percentages for the upper, middle, and lower socioeconomic levels were 34,49, and 5 1 per cent.
Hall . POPULATION CONTROL IN SANTIAGO, CHILE 203
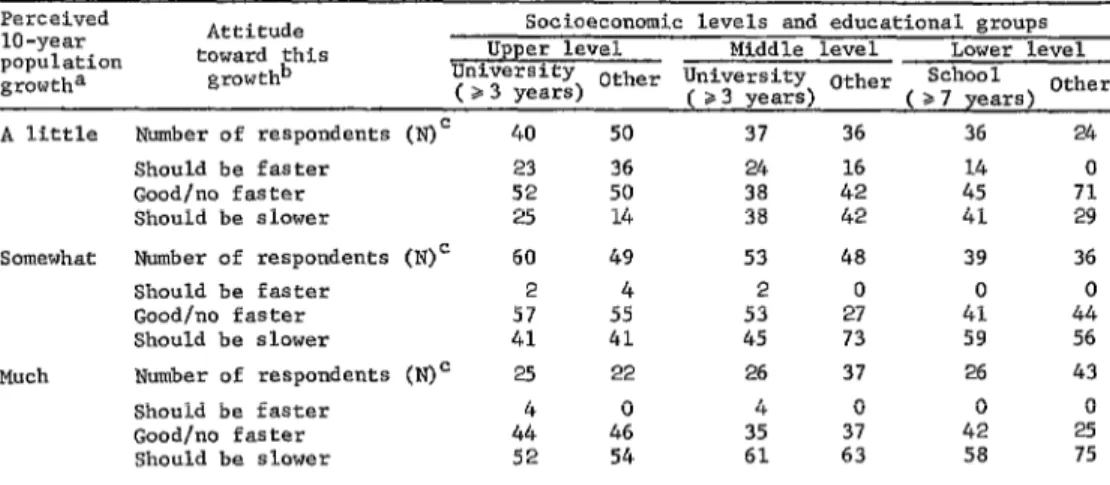
TABLE 6-Relationship between perceived growth rates and perceived desirability of faster or slower growth.
Perceived lo-year population growtha
Attitude toward this
growthb
Socioeconomic levels and educational groups upper level Middle level Lower level University Other UniVerSity Other School
( 4 3 years) ( a3 years) (27 y ears) Other
A little Number of respondents (N)' 40 50 37 36 36 24
Should be faster 23 36 24 16 14 0
Good/no faster 52 50 38 42 45 71
Should be slower 25 14 38 42 41 29
Somewhat Number of respondents (N)' 60 49 53 48 39 36
Should be faster 2 4 2 0 0
Good/no faster 57 55 53 27
4;
44
Should be slower 41 41 45 73 59 56
Much Number of respondents (N)' 25 22 26 37 26 43
Should be faster 4 0 4 0 0 0
Good/no faster 44 46 35 37 42 25
Should be slower 52 54 61 63 58 75
a"~s the present number of inhabitants a little, somewhat, or much larger than 10 years ago?"
bu 1s it good, bad, or immaterial for the country that the number of innabitants should grow this way?" and "Why is it good (bad) that the number of inhabitants should grow this way?"
'Number of answers missing in the whole table: 317.
considered favorable. But differences in percep- tion alone did not account for the greater desire on the part of the poor to see a slower rate of growth; for among those with similar percep- tions of recent growth, the poor were more likely than the well-to-do to want the growth rate reduced. Thus, regardless of what they thought the rate of growth to be, the higher socioeconomic groups were less concerned about slowing the rate than the rest of the sample. We may conclude that the differences in attitude toward population growth between men of different socioeconomic strata were linked with differing perceptions of the growth rate, and also with differing attitudes toward the particular rate perceived.
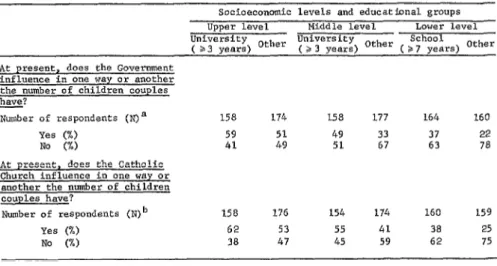
Perception of Government and Church Influence
Another question asked during the interview was “At the present time, does the Government (Catholic Church) influence in one way or another the number of children couples have? ”
Both the Government and the Church were seen as much less influential by men at lower socioeconomic and educational levels than by those at upper levels. Going from upper to lower levels, those who thought the Govern- ment had any current influence represented 59, 51, 49, 33, 37, and 22 per cent of the respondents. Those who thought that the Church had any current influence represented 62,53,5.5,41,38, and 25 per cent (Table 7).
Conclusions
The findings in this study are remarkably parallel to the results so graphically described by Stycos (3) and scientifically analyzed by himself and others (4-7); that is, it appears that lower socioeconomic groups in Latin America seem to be more ready for large-scale family planning programs than higher socioeconomic groups.
204 PAHO BULLETIN - Vol. IX, No. 3, 1975
TABLE I-Perceived Government and Church influence on family size.
Socioeconomic levels and educational groups upper level Middle level Lower level University University SChOOl
( >3 years) Other (23 years) Other (a7 years) Other At present, does the Government
influence in one way or another the number of children couples have?
Number of respondents (Nja Yes (x)
No (x)
At present, does the Catholic Church influence in one way or
another the number of children couples have?
Number of respondents (N)b Yes (%)
No (%)
158 174 158 177 164 160 59 51 49 33 37 22 41 49 51 67 63 78
158 176 154 174 160 159 62 53 55 41 38 25 38 47 45 59 62 75 'Number of answers missing: 39.
bNumber of answers missing: 49.
area of Santiago. There, men at the lower socioeconomic levels seemed to feel more need for population control than those at the upper levels. This feeling was not associated with awareness of important national population events, or even with accurate knowledge of the causes of population growth. In fact, their knowledge about these subjects was meager. Rather, the feeling was associated with dis- proportionately common perception of “too many” inhabitants around them, rapid (“much”) growth in the number of inhabitants, and a desire that growth be “slower.” This latter desire could be attributed both to a more frequent perception of rapid growth and to a more frequent desire to slow the growth regard- less of its rate.
It is beyond the scope of this study to assess the reasons for this difference between the well-to-do and the poor. The question can be raised, however, as to whether actual life experiences may have had a decisive influence. The poor man in urban Santiago is likely to have direct experience with unwanted crowd- ing. He knows there is little space where he lives; he may have seen waves of people settling on the border areas of his slum; he has small
rooms in his house, he often has more children than he wanted, he has queued for food at the market place, he knows the unpleasant pushing on crowded buses, and perhaps most important, he knows there are too many workers for the number of available jobs. The man that life has favored socioeconomically and educationally is far less likely to have daily contact with such conditions. He lives in the suburbs, where each house is surrounded by a plot of grass; he is likely to have only two to four children, and if he has more it is probably because he wanted more; he drives to work in his private car, perhaps goes to the country for the weekend, and is far less likely to be involuntarily un- employed or underemployed than his poorer counterpart. Thus he may have factual know- ledge about the size of the country’s population and the reasons for its growth. But he is not as likely to be faced daily with this growth’s unpleasant consequences.
Hall . POPULATION CONTROL IN SANTIAGO, CHILE 205
ACKNOWLEDGMENTS
The author would like to express her ap- preciation to the Department of International Health at the Johns Hopkins School of Hygiene, and especially to Dr. Carl E. Taylor, Dr. Timothy D. Baker, Dr. William A. Reinke, and Dr. Thomas L. Hall for their continuous support and encouragement during this study. Thanks is also given to the Latin American Center for Demography (CELADE) for extend- ing its official support and for the use of its facilities, and to Miss Carmen Mir6 for her advice on the questionnaire and field work.
The author is also grateful to the University
of Chile for making possible the cooperation with the School for Statistical Technicians; to Dr. Alfonso Rodriguez, whose command of statistics and whose leadership qualities greatly benefited the study; and to Jose Miguel Albala, Jaime Carrion, Isabel Encina, and Farid Isa, the four students who were especially involved with work on the sample.
This study was supported by grant number AID/csd-1939 from the Agency for Inter- national Development (AID) to the Johns Hopkins School of Hygiene.
SUMMARY
This article explores Chilean attitudes toward the national population’s size and rate of growth, as indicated by a special survey conducted for this purpose. The survey sample consisted of 1,410 men 20 to 54 years of age in urban Santiago, who were separated into six categories on the basis of their education and socioeconomic status. The subjects were inter- viewed by 36 students from the University of Chile who utilized a prepared questionnaire
including both open-ended and multiple-choice questions.
The results clearly indicate that men in the lower socioeconomic categories tended to know less about the population’s size and growth than their better-off counterparts. Nevertheless, they more often felt that Chile had “too many” inhabitants, that recent population growth had been rapid, and that this rate of growth should be reduced.
APPENDIX 1: THE SAMPLE
The sample used for this study was a 5) Low socioeconomic level, 7 or more probability sample of men 20 to 54 years of age years of school.
in the City of Santiago, separated into six 6) Low socioeconomic level, less than 7 groups according to the following criteria: years of school.
1) High socioeconomic level, 3 or more years of university education.
2) High socioeconomic level, less than 3 years of university education.
3) Middle socioeconomic level, 3 or more years of university education.
4) Middle socioeconomic level, less than 3 years of unversity education.
206 PAHO BULLETIN . Vol. IX, No. 3, I975
group, every man had an equal likelihood of being selected.
Division
of
Santiago into Primary Units (Areas) Data from the 1960 National Population and Housing Census were updated to the year 1969, taking into account all structures built and removed during the intervening years. As in the 1970 national census, the City of Santiago was defined as being composed of the following 14 districts: Cisterna, Conchali, La Florida, Nufioa, Providencia, Quinta Normal, San Miguel, Santiago, and the urban sectors of Barrancas, La Granja, La Reina, Las Condes, Maipti, and Renca. All persons habitually resid- ing in private housing in these areas were included in the population from which the sample was to be drawn. Collective residences such as prisons, hospitals, schools, hotels, etc., were excluded. The “primary units” of selec- tion were 12,550 areas with an average of 35 housing units each, the actual number of housing units ranging from a minimum of 20 to a maximum of 60. A one-to-fifty sample of these primary units was then taken system- atically, starting from the center of the city (Santiago) and proceeding in the form of a spiral to the outskirts (Renca). A sample of 251 primary units was thus obtained. Identification of these on a map of the city showed a completely random distribution. A census was then taken in each primary unit selected.were held prior to the census for clarification of these instructions. Ultimately, however, the classification depended on the census takers’ subjective judgment. Arrival at this judgment was facilitated by substantial socioeconomic differences between large sectors of the coun- try’s population. A six-level classification scheme might have presented real problems, but the three-level system used did not entail many difficulties or differences of opinion.
During the preliminary census, an adult resident in each housing unit was asked to provide the first name, sex, age, and education of the persons residing in the unit. A complete listing of all residents was thus obtained. Men 20 to 54 years of age were then selected at random from within each of the six educational and socioeconomic categories, the sampling fraction varying so as to obtain a total of approximately 220 men in each category. The actual number of men obtained and the sampling fraction applied in each category were as follows:
Category Number Sampling
of men fraction
Selection of Secondary Units (Individuals)
1 266 0.0179
2 266 0.0144
3 218 0.0200
4 220 0.0021
5 220 0.0035
6 220 0.0029
Total 1,410
During the census of the primary areas, each Thus, in the second stage of sample selection housing unit was classified as indicating high, all the men within each category had an equal medium, or low socioeconomic status. Specific likelihood of being selected, but the proportion guidelines were given to the census takers for selected from the total available in each cate- this classification and several group sessions gory varied considerably.
APPENDIX 2: CODING PROCEDURES
The coding procedure for open-ended ques- tions was as follows: A 10 per cent random sample of the questionnaires was chosen by arranging all the questionnaires in numerical order, selecting one of the first ten at random, and thereafter selecting every tenth one system- atically. All the answers to open-ended ques- tions in this sample were then listed, and
exhaustive, mutually exclusive categories were developed. Four coders, all college graduates and all speaking Spanish as their native lan- guage, thereupon used these categories to code the answers to all 1,030 questionnaires.
Hall . POPULATION CONTROL IN SANTIAGO, CHILE 207
coder. The atmosphere during the whole coding finding fault with their co-workers. Disagree- procedure was congenial, with the four coders ments were usually settled by a consensus of working in the same room and having a free opinion. Two of the coders had carried out interchange of opinions at all times. This was sociological research in Chile before, and their invaluable in gaining the confidence of the interpretation of some of the answers proved coders and allowing them to report disagree- very worthwhile.
ments without feeling they were correcting or
APPENDIX 3: INTRODUCTORY MESSAGE
The following is a translation of the brief introduction printed on the front page of each questionnaire:
“The University of Johns Hopkins, in col- laboration with the Latin American Center for Demography (CELADE), is conducting a study
of current opinions about the number of
inhabitants in the country. We have to inter- view a number of people in the City of Santiago, and you are one of the persons who
has been selected at random to give your opinions.
“The study is for scientific purposes only and, therefore, there are no questions of a political nature in the questionnaire. Your answers will be confidential and your name will not appear at any time in the analysis in connection with your answers. Since the ques- tions ask for your opinion, there are no correct or incorrect answers. We ask that you be frank and sincere and we promise you strict confiden- tiality.”
REFERENCES
(I) Hall, M-Francoise. Population growth: U.S. and Latin American views. Population S&dies
Volume 27, November 1973.
(2) Hall, M-Francoise. Population control: Latin America and the United States. Znt J Health Serv 4 (3): 725730, 1973. Special issue: “Population Growth in International Perspec- tive.”
(3) Stycos, J. Mayone. Children of the Barriada.
Grossman Publishers, New York, 1970. (4) Stycos, J. Mayone. “Catholicism and Birth
Control in the Western Hemisphere.” Presenta- tion to the Fourth Annual National Conference
of the Catholic Inter-American Cooperation Program, 1967. (Mimeographed.)
(5) Stycos, J. Mayone. Ideology, faith, and family planning in Latin America. In: Exploding Humanity. edited by H. Regier and .I. Falls. Anansi, Toronto, 1969, pp. 91-104.
(6) Stycos, J. Mayone. Ideology, Faith and Family Planning in Latin America. McGraw-Hill, Inc., New York, 1971.