574
ARTICLE
Oligoclonal bands in the cerebrospinal fluid
and increased brain atrophy in early stages of
relapsing-remitting multiple sclerosis
Bandas oligoclonales en líquido cefalorraquídeo y incremento de la atrofia cerebral en
estadios tempranos de pacientes con esclerosis múltiple forma recaída-remisión
Juan Ignacio Rojas1, Liliana Patrucco1, Santiago Tizio2, Edgardo Cristiano1
Multiple sclerosis (MS) is a chronic, inlammatory, and neurodegenerative disorder of the central nervous sys-tem (CNS), which evolves over time clinically by a variable course1. he disease is characterized by the appearance of
multiple areas of myelin destruction, axonal loss, and re-active gliosis2. Advances in the study of the disease
patho-genesis have demonstrated not only focal but also difuse damage afecting white, as well as grey matter and neuro-degeneration occurring in early stages2-6. his damage and
consequent loss of tissue lead into atrophy of the CNS in MS patients, relecting the underlying and permanent neuroax-onal destruction2,5.
Brain atrophy, especially neocortical grey matter atrophy, has a direct link with the disease disability and progression, as previously demonstrated in some cross-sectional and longi-tudinal studies, being a possible biomarker for worse progno-sis when considering physical outcomes in the mid and long-term follow-up3,5,7,8.
1MD; Neurology Department, Hospital Italiano, Buenos Aires, Argentina;
2MD; Hospital Interzonal General de Agudos General San Martín, La Plata, Buenos Aires, Argentina.
Correspondence: Juan Ignacio Rojas; MS Section, Italian Hospital of Buenos Aires; Gascón 450; C1181ACH Buenos Aires - Argentina; E-mail: [email protected]
Conflict of interest: There is no conflict of interest to declare.
Received 02 January 2012; Received in final form 05 April 2012; Accepted 12 April 2012
ABSTRACT
Objective: To determine if the presence of oligoclonal bands (OB) at early stages of multiple sclerosis was associated with higher brain atro-phy, when compared with patients without OB. Methods: Relapsing-remitting multiple sclerosis (RRMS) patients with less than two years of disease onset and OB detection in cerebrospinal fluid (CSF) were included. SIENAX was used for total brain volume (TBV), gray matter volume (GMV), and white matter volume (WMV). Results: Forty patients were included, 29 had positive IgG-OB. No differences were found between positive and negative patients in gender, expanded disability status scale (EDSS), treatment received, and T2/T1 lesion load. TBV in positive IgG-OB patients was 1.5 mm3 x 106 compared with 1.64 mm3 x 106 in the negative ones (p=0.02). GMV was 0.51 mm3 x 106 in positive IgG-OB
compared with 0.62 mm3 x 106 in negative ones (p=0.002). No differences in WMV (p=0.09) were seen. Conclusions: IgG-OB in the CSF was
related to neurodegeneration magnetic resonance (MR) markers in early RRMS.
Key words: multiple sclerosis, brain atrophy, oligoclonal bands.
RESUMEN
Objetivo: Evaluar si la presencia de bandas oligoclonales (BO) en líquido cefalorraquídeo (LCR) de pacientes con esclerosis múltiple recaída-remisión (EMRR) se asociaba con mayor atrofia cerebral al inicio de la enfermedad. Métodos: Pacientes con EMRR con menos que dos años del inicio de la enfermedad y en quiénes se realizó la búsqueda de IgG-BO en LCR fueron incluidos. SIENAX fue usado para la medición del volumen cerebral total (VCT), volumen de substancia gris (VSG) y volumen de sustancia blanca (VSB). Resultados: Cuarenta pacientes fueron incluidos, 29 tenían IgG-BO positivo. No fueron encontradas diferencias entre pacientes positivos y negativos en: género, expanded disability
status scale (EDSS), tratamiento recibido y carga lesional en resonancia magnética. El VCT en pacientes IgG-BO positivos fue de 1,5 mm3 x
106versus 1,64 mm3 x 106 en BO negativo (p=0,02). El VSG fue 0,51 mm3 x 106 BO positivo versus 0,62 mm3 x 106 BO negativo (p=0,002). No
fueron encontradas diferencias en VSB (p=0,09). Conclusiones: La presencia de IgG-BO en el LCR se asoció con signos de neurodegeneración temprana en este estudio.
575
Juan Ignacio Rojas et al. CSF oligloconal bands: R-RMS
Almost 95% of patients with MS have cerebrospinal lu-id (CSF) immunoglobulin in oligoclonal patterns or bands (IgG-OB), with unusual cases of MS OB-negative: 35 to 45% in the Far East9. It is clear nowadays that IgG-OB demonstrate
a prognostic role in the conversion to MS in clinical isolat-ed syndrome (CIS)10,11. However, in MS patients, their role in
prognosis has not been completely understood. Joseph et al., in a retrospective case analysis including 100 IgG-OB negative MS patients, demonstrated that band negative patients have clinical, neuroradiological, and prognostic diferences com-pared with positive ones9. hese MS patients without
IgG-OB in CSF were more likely to show atypical presentations at onset and a better prognosis of physical disability during follow-up. Primarily, IgG-OB negative cases were less likely to reach disability endpoints measured by the expanded disabil-ity status scale (EDSS), when compared with positive band patients, independently of magnetic resonance (MR), and other clinical features9. However, the exact role of IgG-OB in
the prognosis of MS patients is not fully understood. In con-trast to IgG-OB, it has been demonstrated that lipid-speciic IgM oligoclonal bands, when present in MS patients, predict an aggressive course of the disease in terms of new relapses and cumulative disability12,13. Despite the fact that IgM
lipid-speciic has a demonstrated role in prognosis of the disease, it is a more complex and less disseminated technique.
Considering the relevance that brain atrophy, which may be termed as neurodegeneration, might have in predicting the disease evolution at MS onset3,5 and the role that IgG-OB
could have in producing such damage9, the aim of this study
was to evaluate the relationship between CSF IgG-OB posi-tivity, and the presence of brain atrophy in the MS early onset.
METHODS
Patients
his study was designed to be cross-sectional. Patients with remitting-relapsing MS (RRMS) and less than two years of disease onset (deined as the appearance of the irst de-myelinating symptoms compatible with MS) were included between June 2006 and June 2010 from a cohort of patients from the MS Center of the Hospital Italiano de Buenos Aires, in Argentina. For inclusion, patients had to fulill Poser14 or
McDonald15 criteria for dissemination in time and space for
MS and were required to have a MR at onset of the disease and without taking steroid treatment for at least 30 days pri-or to the scan.
Clinical and paraclinical data analyzed
For patients included in the study, the clinical variables obtained included demographic data, form of clinical on-set, and EDSS at the beginning of the disease. Paraclinical data obtained at onset and analyzed were: serological tests
for diferential diagnosis, including antinuclear antibodies, B12 vitamin and folate levels, syphilis and HIV; IgG-OB de-tection in CSF was performed by agarose isoelectric focus-ing combined with immunoblottfocus-ing and avidin-biotin ampli-ied with double antibody peroxidase staining, as well as in the serum of each patient included. Brain MR was performed on a 1.5 Tesla machine, with a standard head coil (Siemens Avanto) within two months of the irst demyelinating event. Spinal MR was also performed if the CIS was a spinal cord syndrome. he MR study included images obtained in the fol-lowing sequences: T1-weighted conventional spin-echo; T2-weighted fast spin-echo; FLAIR spin-echo, and T1-T2-weighted conventional spin-echo after single doses of gadolinium (0.1 mg/kg). All images had a 5 mm section thickness and a 0.5 mm intersection gap.
Brain volume measurements
Brain volumes were estimated from T1-weighted imag-es with SIENAX, which is a software part of the FSL library (an adaptation of SIENA for cross-sectional measurement)16.
his software estimates the total brain parenchyma volume (TBV) and then separates it in neocortical grey matter vol-ume (GMV), white matter volvol-ume (WMV), and CSF volvol-ume. It also estimates the brain volumes from a single image, nor-malized for skull size. It irst strips nonbrain tissue and then uses the brain and skull images to estimate the scaling be-tween the subject’s image and standard space. Next, it runs tissue segmentation to estimate the brain tissue volume and multiplies this by the estimated scaling factor to reduce head-size-related variability between subjects16.
In addition to brain volume measurements, T1 and T2-weighted lesion volumes at baseline were calculated. SepINRIA software was used to segment and calculate T1 and T2 lesion loads by lesion segmentation edition17.
Ethics approval for the cross-sectional study was obtained from the Medical Ethics Committee of Hospital Italiano de Buenos Aires. Written informed consent was then obtained from all participants included in this study.
Statistical analysis
Data were stored and analyzed in STATA 9.1 software. Diferences in variables between patients with and without IgG-OB were examined using Mann-Whitney’s U, Kruskal-Wallis, and Fisher’s exact tests for continuous and categori-cal variables, respectively. A p<0.05 was considered statisti-cally signiicant.
RESULTS
576 Arq Neuropsiquiatr 2012;70(8):574-577
mean EDSS was 1.1±0.5. Demographic, clinical, and paraclin-ical data of the patients included are displayed in Table 1. Of 40 patients, 29 (72.5%) had positive IgG-OB in the CSF. No diferences were found between IgG-OB positive and nega-tive patients in gender, EDSS, time from onset of disease and treatment received, and T2 as well as T1 lesion load (Table 2). When brain volume was measured, we observed that the TBV in positive IgG-OB patients was 1.5 mm3 x 106 compared
with 1.64 mm3 x 106 in negative ones (p=0.02). When
neocor-tical grey matter was evaluated, we found that the GMV was 0.51 mm3 x 106 in positive IgG-OB versus 0.62 mm3 x 106 in
negative ones (p=0.002). WMV was 0.98 mm3 x 106 in positive
IgG-OB versus 1.12 mm3 x 106 in negative ones (p=0.09), as
seen in Table 2 and Figure.
DISCUSSION
It is currently accepted that brain atrophy is related to neurodegeneration in MS, as well as to physical long-term disability18.
Our study has showed that the presence of IgG-OB in CSF at the onset of MS is associated with the presence of brain volume reduction, mainly in neocortical grey mat-ter and independently from the lesion load or other clin-ical parameters. No differences in lesion load volumes were found; however, an increased tendency of higher le-sion load volumes in T2 in positive IgG-OB was observed, with a nearly significant difference.
Our results are in line with a recently published study, in which the presence of lipid-speciic IgM-OB in the CSF was related in CIS patients to higher lesion load, higher brain at-rophy during the short-term follow-up, and increased prob-ability of conversion to MS compared with patients without this biomarker19. A possible explanation could be that the
presence of Ig in the CSF, independently of whether it is IgG or IgM, is related to an immunological phenomenon that may be producing brain tissue damage, which would conse-quently lead to a reduction in measured volumes. Studies are currently demonstrating that the reduction in brain volume (brain atrophy) is related to physical disability in the short
and mid-term follow-ups, with this marker being considered as a possible biomarker in the near future that may help to predict the course of the disease in MS patients3,5,18,19. On the
other hand, the reduction of brain volumes in MS patients could be related to other unexplored and unknown phenom-ena like reduction of the inlammation (pseudoatrophy) in-stead of neurodegeneration. However, current evidences move brain atrophy evidences towards neurodegeneration and axonal loss instead of preservation5,19,20. Undoubtedly,
fu-ture studies will elucidate this issue.
Variable Positive IgG-OB Negative IgG-OB p-value
Mean age at onset (years) 30.1±2.3 33.2±3.1 0.22
Women (%) 17 (42.5) 13 (32.5) 0.32
Mean disease duration (months) 13±3.5 15+2.6 0.25
EDSS at onset 1.13±0,6 1.05±1 0.18
Mean T2 lesion volume at baseline (mm3) 1,956±2,563 1,478±2,725 0.08
Mean T1 lesion volume at baseline (mm3) 402±378 337±506 0.12
TBV mm3 x 106 1.5 1.64 0.02
GMV mm3 x 106 0.51 0.62 0.002
WMV mm3 x 106 0.98 1.12 0.08
Table 2. Baseline characteristics comparisons among positive versus negative IgG oligoclonal bands in the cerebrospinal fluid.
IgG-OB: IgG oligoclonal bands in CSF; TBV: total brain volume; GMV: grey matter volume; WMV: white matter volume; CSF: cerebrospinal fluid.
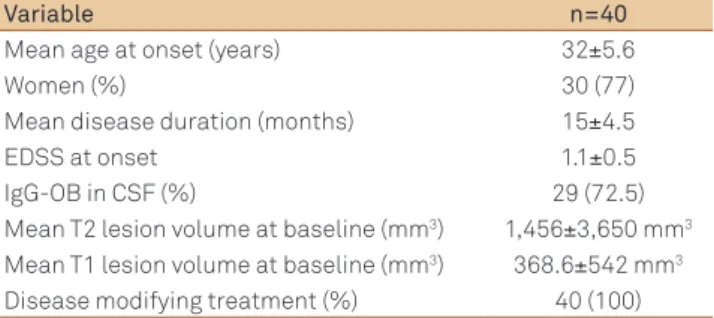
Variable n=40
Mean age at onset (years) 32±5.6
Women (%) 30 (77)
Mean disease duration (months) 15±4.5
EDSS at onset 1.1±0.5
IgG-OB in CSF (%) 29 (72.5)
Mean T2 lesion volume at baseline (mm3) 1,456±3,650 mm3
Mean T1 lesion volume at baseline (mm3) 368.6±542 mm3
Disease modifying treatment (%) 40 (100)
Table 1. Demographics at baseline.
EDSS: expanded disability status scale; IgG-OB: IgG oligoclonal bands in CSF; CSF: cerebrospinal fluid.
IgG-OB: IgG oligoclonal bands in CSF; TBV: total brain volume; GMV: grey matter volume; WMV: white matter volume; CSF: cerebrospinal fluid.
TBV GMV WMV
Negative IgG-OB
Positive IgG-OB
0.5 1.5
x 10
6 mm
3
1
577
J o t.
1. N wtyJH, tt , z e. t
.N J ! " #" $ .
. Trp,%t J, f f e e,. Axonal transection in the lesions of multiple sclerosis. N Engl J Med 1998;338:278-285.
3. Fisher E, Rudick RA, Cutter G, et al. Relationship between brain atrophy and disability: an 8-year follow-up study of multiple sclerosis patients. Mult Scler 2000;6:373-377.
4. Sailer M, O’Riordan JI, Thompson AJ, et al. Quantitative MRI in patients with clinically isolated syndromes suggestive of demyelination. Neurology 1999;52:599-606.
5. Di Filippo M, Anderson VM, Altmann DR, et al. Brain atrophy and lesion load measures over 1 year relate to clinical status after 6 years in patients with clinically isolated syndromes. J Neurol Neurosurg Psychiatry 2010;81:204-208.
6. Rocca MA, Agosta F, Sormani MP, et al. A three-year,
multi-parametric MRI study in patients at presentation with CIS. J Neurol 2008;255:683-691.
7. Fisniku LK, Brex PA, Altmann DR, et al. Disability and T2 MRI lesions: a 20-year follow-up of patients with relapse onset of multiple sclerosis. Brain 2008;131:808-817.
8. Martola J, Bergstrom J, Fredrikson S, et al. A longitudinal
observational study of brain atrophy rate reflecting four decades of multiple sclerosis: a comparison of serial 1D, 2D, and volumetric measurements from MRI images. Neuroradiology 2010;52:109-117.
9. Joseph FG, Hirst CL, Pickersgill TP, Ben-Shlomo Y, Robertson NP, Scolding NJ. CSF oligoclonal band status informs prognosis in multiple sclerosis: a case control study of 100 patients. J Neurol Neurosurg Psychiatry 2009;80:292-296.
10. Rojas J, Patruccol L, Cristiano E. Oligoclonal bands and MRI in clinically isolated syndromes: predicting conversion time to multiple sclerosis. J Neurol 2010;257:1188-1191.
11. Tintore M, Rovira A, Rio J, et al. Do oligoclonal bands add
information to MRI in first attacks of multiple sclerosis? Neurology 2008;70:1079-1083.
12. Villar LM, Masjuan J, Gonzalez-Porque P, et al. Intrathecal IgM synthesis predicts the onset of new relapses and a worse disease course in MS. Neurology 2002;59:555-559.
13. Villar LM, Masjuan J, Gonzalez-Porque P, et al. Intrathecal IgM synthesis is a prognostic factor in multiple sclerosis. Ann Neurol 2003;53:222-226.
14. Poser CM, Paty DW, Scheinberg L, et al. New diagnostic criteria for multiple sclerosis: guidelines for research protocols. Ann Neurol 1983;13:227-231.
15. Polman CH, Reingold SC, Edan G, et al. Diagnostic criteria for multiple sclerosis: 2005 revisions to the “McDonald Criteria”. Ann Neurol 2005;58:840-846.
16. Smith SM, Zhang Y, Jenkinson M, et al. Accurate, robust, and
automated longitudinal and cross-sectional brain change analysis. Neuroimage 2002;17:479-489.
17. Ebers GC. Environmental factors and multiple sclerosis. Lancet Neurol 2008;7:268-277.
18. Miller DH, Barkhof F, Frank JA, Parker GJ, Thompson AJ.
Measurement of atrophy in multiple sclerosis: pathological basis, methodological aspects and clinical relevance. Brain 2002;125:1676-1695.
19. Magraner MJ, Bosca I, Simo-Castello M, et al. Brain atrophy and lesion load are related to CSF lipid-specific IgM oligoclonal bands in clinically isolated syndromes. Neuroradiology 2012;54:5-12.
20. Rudick RA, Fisher E, Lee JC, Simon J, Jacobs L. Use of the brain parenchymal fraction to measure whole brain atrophy in relapsing-remitting MS. Multiple Sclerosis Collaborative Research Group. Neurology 1999;53:1698-1704.
References
Of course, our study has many limitations, and con-clusions cannot be drawn from this simple observation. Primarily, this is a cross-sectional study in which a snap-shot of the evolution of the disease was taken at the early MS onset in these patients. However, short-term follow-up studies are pointing in this direction as well. Another im-portant limitation that must be addressed is the number of patients included, although it demonstrates significant differences in brain volumes between positive OB patients
versus negative ones. Other limitation is that this study has no cognitive correlate in order to test functional im-pact of brain volume changes. Finally, another limitation
is that we did not measure lipid-specific IgM-OB in the CSF, though this is considered to be a more specific bio-marker in the course of MS as well as in CIS patients12,13.
Nevertheless, despite the high proportion of IgG-OB false-negatives in predicting the course of the disease, we were still able to demonstrate brain volumes changes with the presence of IgG-OB.