O
RIGINALA
RTICLE Revista Brasileira de FisioterapiaCorrelation among the Visual Gait Assessment
Scale, Edinburgh Visual Gait Scale and
Observational Gait Scale in children with
spastic diplegic cerebral palsy
Correlação entre a Visual Gait Assessment Scale, Edinburgh Visual Gait
Scale e Escala Observacional da Marcha em crianças com paralisia cerebral
diparética espástica
Geruza P. Bella, Nádia B. B. Rodrigues, Paola J. Valenciano, Luciana M. A. E. Silva, Regina C. T. Souza
Abstract
Background: Gait disorders are very common in children with spastic diplegia cerebral palsy (CP). In order to improve the CP children`s gait and to quantify the outcomes of this intervention it becomes essential to perform an instrumented analysis before and after the intervention. Objectives: To analyze the correlation among the Edinburgh Visual Gait Scale (EVGS), the Visual Gait Assessment Scale (VGAS) and the Observational Gait Scale (OGS). Methods: Cross sectional study aiming to analyze the gait of 8 children with spastic diplegia CP with level I or II in the Gross Motor Function Classification System (GMFCS) through the EVGS, VGAS and OGS scales performed by 3 examiners. This study was approved by the Research Ethics Committee of the Universidade Estadual de Campinas (UNICAMP). Weighted Kappa scores were used to analyze the data considering a significance level of 5%. Results: The intra-rater analyses showed a moderate to excellent agreement (k=0.41, 1.00) among the methods of the children’s classification, being the comparison between VGAS and the EVGS scales presented the highest level of agreement, while the OGS scale presented a considerable disagreement in comparison with other scales. The inter-rater agreement showed to be predominantly high. Conclusions:
The results provide evidence that the VGAS and the EVGS scales are more suitable for children’s spastic diplegia CP gait assessment when compared to OGS.
Keywords: physical therapy; gait; cerebral palsy; diplegia.
Resumo
Contextualização: Desordens da marcha são comuns em crianças com paralisia cerebral (PC) diparética espástica. Com o intuito de aprimorar a marcha dessas crianças e quantificar os desfechos de tal intervenção, torna-se necessário que se faça uma análise instrumentada pré e pós-intervenção. Objetivos: Correlacionar a Edinburgh Visual Gait Scale (EVGS), a Visual Gait Assessment Scale
(VGAS) e a Escala Observacional de Marcha (EOM). Métodos: Estudo transversal de análise da marcha por meio das escalas EVGS, VGAS e EOM, envolvendo oito crianças com PC diparética espástica, nível I ou II do Gross Motor Function Classification System
(GMFCS), avaliadas por três examinadores. O estudo foi aprovado pelo Comitê de Ética em Pesquisa da Universidade Estadual de Campinas - UNICAMP. Os dados foram analisados pelo índice Kappa ponderado, considerando um nível de significância de 5%.
Resultados: O estudo intra-avaliadores mostrou que a concordância entre os métodos na classificação dos sujeitos foi de moderada a excelente (k=0,41, 1,00), sendo a comparação entre a VGAS e a EVGS a de maior índice de concordância, enquanto a EOM obteve grande discordância em comparação com as outras escalas. A concordância interavaliadores se mostrou predominantemente alta.
Conclusão: Os resultados fornecem evidências de que a VGAS e a EVGS são mais adequados para avaliação da marcha de crianças com PC diparética quando comparadas à EOM.
Palavras-chave: fisioterapia; marcha; paralisia cerebral; diplegia.
Received: 07/01/2011 – Revised: 10/27/2011 – Accepted: 12/01/2011
School of Medical Sciences, Universidade Estadual de Campinas (Unicamp), Campinas, SP, Brazil
Correspondence to: Geruza Perlato Bella, Serviço de Fisioterapia e Terapia Ocupacional – HC – UNICAMP, Ambulatório de Fisioterapia Aplicada à Neurologia Infantil, Cidade Universitária Zeferino Vaz, s/nº - Dist. Barão Geraldo, CEP 13083-970, Campinas, SP, Brasil, e-mail: geruzaperlatobella@gmail.com
Introduction
Gait disorders are common outcomes in children with spastic diplegia cerebral palsy (CP)1-4. hese disorders tend to
become worse with age limiting the functionality of this popu-lation, being the gait one of the major focus of the rehabilitation of these children. In order to improve the gait of these children and to analyze the efects of the proposed interventions it be-comes necessary to perform an instrumented analysis of the gait before and after the intervention1,5,6.
he kinetic, kinematic and electromyographic quantitative analysis is considered by the literature the gold standard of the gait assessment, since it generates an accurate and reliable informa-tion on the three planes of moinforma-tion1,7-10. Despite of the presented
beneits, the authors1,7-10 consider their applicability in clinical
practice limited, since this type of analysis requires expensive and sophisticated equipment reducing its availability in most of the rehabilitation centers, especially in emerging countries.
he observational gait analysis is more feasible in the clini-cal settings, since it has a low cost and does not require sophis-ticated equipment or locations11-13. It is important to point out
that despite of its feasibility this type of analysis is still relatively subjective, which may lead to a low validity, reliability, sensibil-ity and speciicsensibil-ity when compared with the kinematic analysis in laboratories7.
In order to standardize, systematize and quantify the ob-servational gait analysis in children with CP increasing its va-lidity and reliability, scales have been developed and have been constantly revised and modiied11,14-16. One of the main scales
used for this purpose is the Physicians Rating Scale (PRS)17.
here are several modiied versions of this scale including the Visual Gait Assessment Scale (VGAS) developed by Dickens and Smith11. Such version was developed with the aim to evaluate,
in the sagittal plane, the position of hip, knee, ankle and foot. To date, this version has been validated only for use in children with spastic hemiplegia CP, and it has not been validated for Portuguese language.
Read et al.14 developed a new scale for observational gait
analysis, the Edinburgh Visual Gait Scale (EVGS), which is com-posed by 17 parameters for each lower limb evaluated in six anatomical sites: trunk, pelvis, hip, knee, ankle and foot. he parameters are evaluated in each gait phase and analyzed in the frontal, sagittal and transverse planes through the observa-tion of videotapes.
he EVGS scale difers from the VGAS for being more ex-tensive and detailed and for analyzing items in other planes of motion as described previously by identifying gait deviations expected in children with CP. Nunes18 validated the EVGS for
Portuguese language, developing a software that contains a training package for its application.
Recently, Araújo, Kirkwood and Figueiredo15 developed a
gait scale called Observational Gait Scale (OGS). It is a Brazilian-Portuguese scale composed by 24 items that evaluate ankle/ foot, knee, hip and pelvis in the frontal and sagittal planes of motion.
Researchers have been creating and validating obser-vational scales that are more reliable with the aim to assist physical therapists in the clinical decision making, in the evaluation of their interventions and also to unify the lan-guage of these professionals10,11,15,17,19,20.
he observational gait scales do not present good results for all evaluated parameters, however they remain important clinical tools. Based on the similarities and diferences between them and the fact that are no studies of which one would be more appropriate for children’s population with spastic diple-gia CP in the literature, it becomes necessary to compare these scales in order to assist physical therapists in choosing the scale to be used in clinical practice in this speciic population.
Therefore, the objectives of this study were to compare the EVGS, VGAS and OGS in order to verify whether there is an agreement among the final scores of the scales with re-gards to the degree of deviation from normal gait; to analyze the inter-rater reliability in relation to the total score of the scales and to analyze the time and the difficulty degree of use of each scale.
Methods
Participants
A cross-sectional study involving children with diagnosis of spastic diplegia CP was carried out. hese children were able to walk without equipment or human help (level I or II of the Gross Motor Function Classiication System-GMFCS)21, were
within the age group corresponding to the age of gait acqui-sition up to 18 years old and were able to understand simple verbal commands. Children with moderate to severe cognitive delay, with ataxia or athetosis, or who had undergone surgi-cal procedures or application of neurochemisurgi-cal blockades in the last six months were excluded from the study. he selected sample included all children in weekly attendance in the Outpa-tient Physical herapy and Occupational herapy Department of the Hospital das Clinicas (HC) of the Universidade Estadual de Campinas (UNICAMP), Campinas, SP, Brazil, who fulilled the established criteria for inclusion in this study and whose le-gal guardian after receiving explanations on the research were willing to participate and signed the informed consent form. he study was approved by the Ethics in Research Committee of UNICAMP, number 419/2010.
Materials and procedures
he researchers were trained to use the EVGS through the training package developed by researchers from the UNICAMP and provided by Nunes18. he researchers were also trained
to use the VGAS and OGS scales through the explanation of the importance of each item to be analyzed and also about its score according to the possible deviations. his training was performed by three researchers simultaneously.
he data collection was carried out at the Outpatient Pedi-atric Neurological Physical herapy Department of the HC of the UNICAMP. It consisted of an evaluation aiming to describe the sample, colleting data such as age, gender and level of motor impairment through the GMFCS classiication (level I or II) and also consisted of video recordings of the participants’ gait in a standardized room avoiding visual and/or audio interferences. For the video recording collection, a digital Sony camera, model Handycam DCR-HC96, was positioned in marks previously de-termined by the researchers in order to standardize all record-ings. he participants were instructed to walk a distance of 4 meters (m) for at least four times (i.e. 16 m in total), with barefoot, using swimsuits, in a comfortable speed and going forward and backward the route without stopping until they were instructed to stop. After video recording the frontal plane the experiment was paused for positioning the camera to capture the sagittal plane, restarting the test as soon as possible. his procedure was carried out by the three examiners together.
Data analysis
he three scales were applied through the observation of the collected videos, independently by the three examiners, through the software Windows Media Player 12.0, using resources such as freeze frame and slow motion. Individually, each examiner timed the total time spent, answered positively or negatively about the ease of understanding and application, and made personal and descriptive notes with regards to the positive and negative char-acteristics of the three scales separately.
he video analysis was carried out in two days, being half of the sample in each day. All children were evaluated taking into account the right and left lower limbs separately, irstly by the VGAS scale followed by the EVGS and OGS scales, obliga-torily in this order, to ensure greater reliability in determining the time taken for application of each scale. Among the appli-cation of each scale an intervals of 15 minutes were given in order to avoid interference from physical and mental fatigue. In the application of the EVGS, the examiners did not perform the measurement of the angles directly from the video using only visual estimation in the attempt to approximate as close as possible from daily practice1.
The examiners were physical therapists with considerable experience in evaluating children with CP. To perform the inter-rater reliability and the correlation tests among the scales, the items involving the hip, knee and ankle of the three scales and the item pelvis of the EVGS and OGS scales were used, since VGAS does not evaluate this item. Data related to the trunk were used only to verify the inter-rater reliability and was not possible to compare them with the other scales, since only EVGS analyzes this item. In order to be possible to correlate the quantitative data among the three scales, it was necessary to assign scores for each item of the OGS as follows: normal=0, moderate deviation=1 and severe deviation=2.
In order to be possible to compare the scales used in this study, the scores were standardized into four categories ac-cording to the degree of deviation from normality, which are: normal, mild, moderate and severe. For the VGAS a score equal to 24 was classiied as normal; score ranging from 18 to 23, as mild deviation; score ranging from 17 to 12, as moderate de-viation and scores lower or equal to 11 was classiied as severe deviation. In the EVGS, the score equal to 0 was classiied as normal; score ranging from 1 to 11, as mild; score ranging from 12 to 23, as moderate and score higher or equal to 24 was clas-siied as severe. For the OGS, score equal to 0 was clasclas-siied as normal; score ranging from 1 to 16, as mild; score ranging from 17 to 32, as moderate and score higher or equal to 33 was classiied as severe.
Statistical analysis was performed using the weighted Kappa index, with the estimates classified according to Landis and Koch22, which has established the degree of
agreement between two methods or examiners. The level of agreement between all methods - or examiners - was ob-served pairing up method and examiner. The significance level was set at 5% for all analyses and calculations were performed using the SAS statistical package23.
Results
Eight children, four female and four male, with a mean age of 10.5 (SD=3.8), characterized the sample. Regarding the se-verity of the motor impairment, six children were classiied as level I, and two children as level II of GMFCS.
Analyses among the evaluated scales (Intra-raters
analysis)
Table 1 presents the weighted Kappa index frequencies for each combination of scales; being the majority of these
General agreement Occurrences
Agreement levels Occurrences Examiner 1 Examiner 2 Examiner 3
0 – Poor 0 0 0 0
0-0.20 – Weak 3 1 0 2
0.21-0.40 – Fair 3 1 1 1
0.41-0.60 – Moderate 8 4 3 1
0.61-0.80 – Substantial 2 0 2 0
0.81-1.00 – Almost perfect 2 0 0 2
Table 1. Weighted Kappa index for all combination of correlation of the evaluated scales and examiners.
Interpretation: Landis and Koch22.
Examiner 1 Examiner 2 Examiner 3
Right Left Right Left Right Left
VGAS X EVGS 0.43 0.36 0.37* 0.50 1.00 0.43
VGAS X OGS 0.52 0.45 0.71 0.53 0.20* 0.81
EVGS X OGS 0.11* 0.56 0.71 0.53 0.20* 0.27*
*Non-significant; results significant at p<0.05.
Table 2. Weighted Kappa index for the correlation of all scales.
General Agreement Occurrences
Agreement levels Occurrences VGAS EVGS OGS
0 – Poor 0 0 0 0
0-0.20 – Weak 2 0 0 2
0.21-0.40 – Fair 3 0 0 3
0.41-0.60 – Moderate 5 1 3 1
0.61-0.80 – Substantial 3 3 0 0
0.81-1.00 – Almost perfect 5 2 3 0
Table 3. Weighted Kappa index frequencies to all examiners correlation and of VGAS, EVGS and OGS scales.
statistics tests (approximately two thirds) were classiied as moderate to excellent (k=0.41, 1.00).
By evaluating Tables 1 and 2 together, the three cases of poor agreement occur when OGS is compared with the other two scales. In contrast, the highest level of agreement occurred in the comparison between VGAS and EVGS. It is also possible to observe, in Table 1, the agreement levels for the classiica-tion of the individual in the diferent assessment scales for each examiner, regardless of the side.
For the irst examiner, most of the agreement levels among the evaluation methods were considered moderate. How-ever, the occurrence of the poor agreement level and the worst weighted Kappa value obtained (0.11) deserve some attention. his index was obtained through the comparison between EVGS and OGS scales.
he second examiner showed a higher agreement in classifying the subjects. he highest levels were obtained from the compari-sons between VGAS and OGS and also between EVGS and OGS.
For the third examiner,it was observed the weakest com-parison between EVGS and OGS, in other words, the evaluation methods disagree strongly in relation to the status of subjects.
In contrast, the agreement statistics among the VGAS with the evaluation methods EVGS and OGS resulted in excellent level of agreement.
Inter-raters analysis
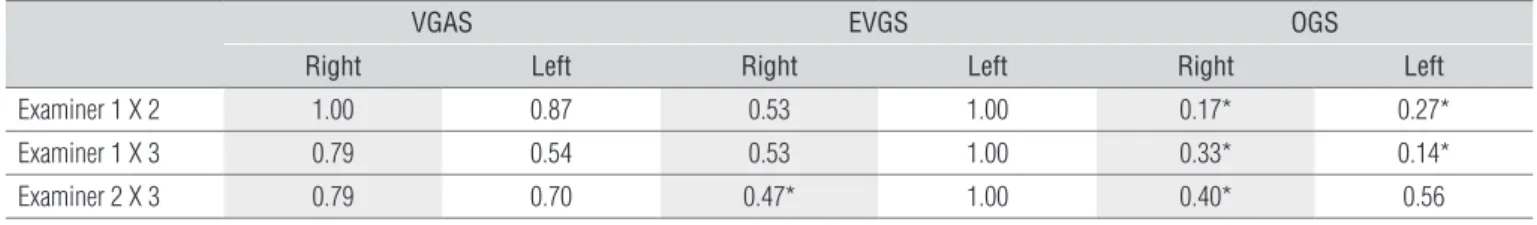
According to Table 3, about two-thirds of the statistics analyses varied between moderate to excellent, and the values ranged from 0.14 to 1.00 (Table 4), being approximately one third of the agreement statistics classiied as excellent.
By analyzing Tables 3 and 4 together, the cases of poor agreement levels were observed in the combination of exam-iner 1with the others examexam-iners, emphasizing that this fact also occurred with the OGS.
Table 3 shows that there are high agreement indexes among the examiners with the VGAS and EVGS scales. he statistics for the EVGS ranges between moderate and excellent, present-ing diferent values only for each hemi-body (Table 4).
he OGS presents the lowest indexes of inter-rater agree-ment. hese indexes may be considered statistically null, as shown by the weighted Kappa test.
VGAS EVGS OGS
Right Left Right Left Right Left
Examiner 1 X 2 1.00 0.87 0.53 1.00 0.17* 0.27*
Examiner 1 X 3 0.79 0.54 0.53 1.00 0.33* 0.14*
Examiner 2 X 3 0.79 0.70 0.47* 1.00 0.40* 0.56
Table 4. Weighted Kappa index to all examiners correlation.
*Non-significant; results significant at p<0.05.
Application duration and subjective analysis
he three examiners recorded the application duration of each scale in all children, being the application duration mean of 7 minutes for the VGAS, 12 minutes for EVGS and 14 min-utes for OGS.
he subjective analysis with regards to the diiculties in applying each scale, all three examiners agreed that the VGAS was the easier scale to understand and to apply. he examiner also considered the EVGS of easy understanding, however of diicult application and the OGS of diicult understanding and application. With regards to the comments made at each scale, the VGAS and the OGS received no positive comments, while the EVGS was considered the most complete. he three examiners considered the VGAS confusing regarding the score on each item as in most of the items the scale attributes the higher score to normal and in other two items (“knee peak extension in terminal stance” and “timing of heel rise”) the abnormalities are scored with the higher value compared to normal, which confuses the categorization as normal, mild, moderate and severe. In addition, with regards to the VGAS the examiners 1 and 2 declared the absence of pelvis and trunk analysis as negative, since these segments usually present deviations from normality in individuals belonging to the studied population.
All examiners declared that the score sheet of the EVGS is not practical as it does not have separate scores for each hemi-body, in addition, its items are arranged in a confused way with regards to the planes of motion that each item is evaluated. Moreover, the examiners 2 and 3 declared diiculties in esti-mating the angles visually and they also stated that the gait analysis through visual angular estimation might not be a reli-able measure.
All examiners declared that the igures of the OGS ended up making the analysis more diicult compared to when the gait phase was indicated in written. here was a consensus on the negativity of the OGS due to the fact that this scale do present a speciic score system for each item evaluated. he three examiners also declared that the OGS does not evaluates the truck and this fact makes this scale incomplete for use in individuals with spastic diplegia CP.
Discussion
Identiication of gait patterns in CP has potential applica-tions as, for example, to assist in the clinical decision-making and in the communication of healthcare professionals24-26. In
this respect, many authors have been contributed to the study of gait analysis in children with spastic diplegia CP2,4,10,28.
To validate the observational gait scales a comparison be-tween them with the kinematic analysis was performed11,14,15,28.
However no studies was found that have compared these scales to each other.
This study aimed to correlate three observational gait scales validated for children with spastic CP and to verify if there was an agreement between them and between the examiners in order to assist the choice of the most appropri-ate scale to be used in clinical practice. In general, it was observed that the agreement between the three scales eval-uated ranged from moderate to excellent (k=0.41, 1.00), and the comparison between the VGAS and the EVGS was the highest agreement index. In the subjective analysis, these two scales were considered easier to understand, in contrast with the OGS, which was considered difficult to understand and to apply.
In the validation study of the OGS a total correlation between the scale items and the kinetic evaluation was not observed, especially in the items related to the hip and pel-vis15. On the other hand, the EVGS showed perfect agreement
in most of the items14, and the VGAS showed poor results in
all items11. It can be assumed that if the three scales
evalu-ated in this study presented a perfectly agreement with the kinetic analysis, they should also present a perfectly agree-ment with each other; as this fact has not occurred, there was an indication that they could disagree to each other in some items. Such hypothesis was conirmed in this study as it can be observed diferent correlations among the scales being the worst values observed were in the comparison of the OGS with the others two scales.
In the comparison of the evaluations performed by the three examiners for each scale a high agreement index (moder-ate to excellent) was predominantly observed being the VGAS and EVGS showed occurrences of total agreement between
examiners, and the cases of weak agreement occurred when the comparisons involved the OGS.
hus, there is a relative agreement with the literature re-garding the inter-rater analysis7,14,28-30. Considering that the
ex-aminers are physical therapists with considerable experience in observational gait analysis our results agree with the results of McGinley et al.29 study, which the physical therapists
analyz-ing recorded videotape of children with hemiplegia were able to make accurate and reliable judgments of the gait. Maathuis et al.1 reported that their results might have been inluenced
by the number of examiners and their degree of experience in gait analyses.
he present study agreed with Hillman et al.31 study, which
showed that the EVGS provides an indication of the quality of gait, presenting good concurrent validity due to its strong agreement with other evaluation methods.
In the validation study of the OGS the inter-rater reli-ability showed good agreement indexes, however the authors suggest that the examiners evaluate the items in a diferent way and reinforce the need of exhausting training to apply the scale in order to homogenize the observations15. Such fact
might have caused the discrepancy between the results ob-tained by Araújo, Kirkwood and Figueiredo15 and the results
of the present study.
In the comparison of the visual gait evaluation with a 3D analysis of patients with spastic diplegia, carried out by Kawamura et al.28, there was strong disagreement for most of the
gait parameters. hese authors airm that the visual analysis presents low to moderate level of inter-rater agreement and, despite of being frequently used in clinical practice, the visual gait analysis cannot be considered alone a totally reliable method.
It is known that the good inter-rater reproducibility is es-sential to share the clinical information between examiners and for multicenter research. With regards to observational scales, the subjectivity problem may lead to poor validity, reli-ability, sensibility and speciicity, even though the inter-rater repeatability of more objectives instruments of gait analysis showed questionable results7.
he limitations of the present study are the fact that the in-volvement of few subjects in the agreement analysis among the scales and also the fact that there was no intra-rater analysis.
In conclusion, the VGAS and EVGS seem to be more ap-propriate for evaluations of subject with diplegia CP as its in-crease the classiication accuracy of the gait in these children. In order to obtain greater accuracy in the calculated statistics, it is recommended to observe a higher number of subjects and to include a greater number of examiners to conirm the reli-ability of the application of these scales.
References
1. Maathuis KG, van der Schans CP, van Iperen A, Rietman HS, Geertzen JH. Gait in children with cerebral palsy: observer reliability of Physician Rating Scale and Edinburgh Visual Gait Analysis Interval Testing scale. J Pediatr Orthop. 2005;25(3):268-72.
2. Rodda J, Graham HK. Classification of gait patterns in spastic hemiplegia and spastic diplegia: a basis for a management algorithm. Eur J Neurol. 2001;8 Suppl 5:98-108.
3. Dobson F, Morris ME, Baker R, Graham HK. Gait classification in children with cerebral palsy: a systematic review. Gait Posture. 2007;25(1):140-52.
4. Carriero A, Zavatsky A, Stebbins J, Theologis T, Shefelbine SJ. Determination of gait patterns in children with spastic diplegic cerebral palsy using principal components. Gait Posture. 2009;29(1):71-5.
5. Noonan KJ, Halliday S, Browne R, O’Brien S, Kayes K, Feinberg J. Interobserver variability of gait analysis in patients with cerebral palsy. J Pediatr Orthop. 2003;23(3):279-87.
6. Cook RE, Schneider I, Hazlewood ME, Hillman SJ, Robb JE. Gait analysis alters decision-making in cerebral palsy. J Pediatr Orthop. 2003;23(3):292-5.
7. Toro B, Nester C, Farren P. A review of observational gait assessment in clinical practice. Physiotherapy Theory and Practice. 2003;19:137-49.
8. Brown CR, Hillman SJ, Richardson AM, Herman JL, Robb JE. Reliability and validity of the Visual Gait Assessment Scale for children with hemiplegic cerebral palsy when used by experienced and inexperienced observers. Gait Posture. 2008;27(4):648-52.
9. Toro B, Nester CJ, Farren PC. The status of gait assessment among physiotherapists in the United Kingdom. Arch Phys Med Rehabil. 2003;84(12):1878-84.
10. Mackey AH, Lobb GL, Walt SE, Stott NS. Reliability and validity of the Observational Gait Scale in children with spastic diplegia. Dev Med Child Neurol. 2003;45(1):4-11.
11. Dickens WE, Smith MF. Validation of a visual gait assessment scale for children with hemiplegic cerebral palsy. Gait Posture. 2006;23(1):78-82.
12. Borel S, Schneider P, Newman CJ. Video analysis software increases the interrater reliability of
video gait assessments in children with cerebral palsy. Gait Posture. 2011;33(4):727-9.
13. Harvey A, Gorter JW. Video gait analysis for ambulatory children with cerebral palsy: Why, when, where and how! Gait Posture. 2011;33(3):501-3.
14. Read HS, Hazlewood ME, Hillman SJ, Prescott RJ, Robb JE. Edinburgh visual gait score for use in cerebral palsy. J Pediatr Orthop. 2003;23(3):296-301.
15. Araújo PA, Kirkwood RN, Figueiredo EM. Validity and intra- and inter-rater reliability of the Observational Gait Scale for children with spastic cerebral palsy. Rev Bras Fisioter. 2009;13(3):267-73.
16. Koman LA, Mooney JF 3rd, Smith BP, Goodman A, Mulvaney T. Management of spasticity in cerebral-palsy with botulinum-A toxin - report of a preliminary, randomized, double-blind trial. J Pediatr Orthop. 1994;14(3):299-303.
17. Boyd RN, Graham HK. Objective measurement of clinical findings in the use of botulinum toxin type A for the management of children with cerebral palsy. Eur J Neurol. 1999;6(Suppl 4):S23-35.
18. Nunes LCBG. Tradução e Validação de instrumentos de avaliação motora e de qualidade de vida em paralisia cerebral [tese]. Campinas, SP: Universidade Estadual de Campinas; 2008.
19. Corry IS, Cosgrove AP, Duffy CM, McNeill S, Taylor TC, Graham HK. Botulinum toxin A compared with stretching casts in the treatment of spastic equinus: a randomised prospective trial. J Pediatr Orthop. 1998;18(3):304-11.
20. Wren TA, Rethlefsen SA, Healy BS, Do KP, Dennis SW, Kay RM. Reliability and validity of visual assessment of gait using a modified physician rating scale for crouch and foot contact. J Pediatr Orthop. 2005;25(5):646-50.
21. Palisano R, Rosenbaum P, Walter S, Russell D, Wood E, Galuppi B. Development and reliability of a system to classify gross motor function in children with cerebral palsy. Dev Med Child Neurol. 1997;39(4):214-23.
22. Landis JR, Koch GG. The measurement of observer agreement for categorical data. Biometrics. 1997;33(1):159-74.
23. Bussab WO, Morettin PA. Estatística básica. 5ª Ed. São Paulo: Saraiva; 2002.
24. Oeffinger DJ, Rogers SP, Bagley A, Gorton G, Tylkowski CM. Clinical applications of outcome tools in ambulatory children with cerebral palsy. Phys Med Rehabil Clin N Am. 2009;20(3):549-65.
25. Riad J, Haglund-Akerlind Y, Miller F. Classification of spastic hemiplegic cerebral palsy in children. J Pediatr Orthop. 2007;27(7):758-64.
26. Dini PD, David AC. Repetibilidade dos parâmetros espaço-temporais da marcha: comparação entre crianças normais e com paralisia cerebral do tipo hemiplegia espástica. Rev Bras Fisioter. 2009;13(3):215-22.
27. Zhang B, Zhang Y, Begg R. Gait classification in children with cerebral palsy by Bayesian approach. Pattern Recognition. 2009;42(4):581-6.
28. Kawamura CM, de Morais Filho MC, Barreto MM, de Paula Asa SK, Juliano Y, Novo NF. Comparison between visual and three-dimensional gait analysis in patients with spastic diplegic cerebral palsy. Gait Posture. 2007;25(1):18-24.
29. McGinley JL, Goldie PA, Greenwood KM, Olney SJ. Accuracy and reliability of observational gait analysis data: judgments of push-off in gait after stroke. Phys Ther. 2003;83(2):146-60.
30. Ong AM, Hillman SJ, Robb JE. Reliability and validity of the Edinburgh Visual Gait Score for cerebral palsy when used by inexperienced observers. Gait Posture. 2008;28(2):323-6.
31. Hillman SJ, Hazlewood ME, Schwartz MH, van der Linden ML, Robb JE. Correlation of the Edinburgh Gait Score with the Gillette Gait Index, the Gillette Functional Assessment Questionnaire, and dimensionless speed. J Pediatr Orthop. 2007;27(1):7-11.