Abstract— A distribution-free model is presented for the cumulative distribution function of the differential rain attenuation between two co-channel converging terrestrial links operating at frequencies above 10 GHz. This is accomplished through an extension of the Misme and Fimbel model, which determines the cumulative distribution of the rain attenuation on an isolated link from its parameters and data for the radio climatic region, as well as concepts from probability theory. Next, model predictions and experimental results are compared and effects from variations of the angle between the links and of the path length are studied. Finally, rain effects on the cumulative distribution of the C/I ratio between the desired and interference powers at the same receiver are analyzed, considering the angular discrimination of the receiving antenna.
Index Terms—Converging links, Differential rain attenuation, Interference between terrestrial radio links.
I. INTRODUCTION
Frequency bands above 10 GHz have been increasingly used in point-to-point, high-bandwidth,
wireless access of clients to local- and wide-area networks. The access point generally adopts a star
topology, with many wireless terrestrial links converging to a common central station. It is well
known that rain is the dominant propagation impairment factor to links operating in these frequency
bands and that the design of such star networks should consider the possibility that a link can be
severely attenuated by rain while experiencing interference by another link operating at the same
frequency but under milder conditions. In other words, the design of the network should consider the
effects from differential rain attenuation on link availability. It was observed that some rain
unavailability calculations for these networks were conservatively performed, leading to a relatively
inefficient use of the frequency spectrum. These calculations only considered rain attenuation in the
desired link, assuming clear-sky conditions for the interfering link, making it necessary to increase the
angle between them. A more realistic consideration would be that rain cells could simultaneously
attenuate both links, allowing a decrease of the angle between the links and an increase in spectral
Extension of the Misme and Fimbel Model for
the Estimation of the Cumulative Distribution
Function of the Differential Rain Attenuation
Between Two Converging Terrestrial Links
Henrique Grynszpan, Emanoel Costa, Centro de Estudos em Telecomunicações (CETUC) Pontifícia Universidade Católica do Rio de Janeiro (PUC-Rio) Rua Marquês de São Vicente 225, 22451–900 Rio de Janeiro RJ, BRAZIL
email: [email protected]–rio.br
efficiency. Indeed, efficiency is achieved if the central station serves a large number of remote
terminals and if the same frequency is reused as often as possible by the converging links.
Frequency-sharing studies in converging links are generally based on models for the cumulative
distribution function of differential rain attenuation, some of which are available in the literature. For
example, Morita et al. [1]-[4] developed a model based on the Gamma distribution for the joint
probability density function of the attenuations on two links, assumed to be correlated. The
parameters of the distribution were determined from those of another Gamma distribution, adjusted to
the measured cumulative distribution function of the point rainfall rate, in combination with an
assumed spatial structure for rain field. The cumulative distribution function of differential rain
attenuation between the links was numerically determined. Model predictions were compared with
results from measurements performed by the same authors on three short links operating at
frequencies in the 19-GHz band, converging at the Musashino Electrical Communication Laboratory
(ECL), Japan. The model proposed by Kanellopoulos et al. [5],[6] differs from the one by Morita et
al. [1]-[4] by the assumptions of Lognormal distributions for the cumulative distributions of the
rainfall rate, rain attenuation on an individual link, as well as for the joint probability density function
of the attenuations on two links. Model predictions were compared with results from measurements
performed by the Radio Propagation Group at the Centro de Estudos em Telecomunicações da
Pontifícia Universidade Católica do Rio de Janeiro (CETUC/PUC-Rio) on links operated by Empresa
Brasileira de Telecomunicações (Embratel) at frequencies in the 15-GHz band, converging at the Rua
dos Ingleses station (RIS), City of São Paulo, Brazil [7],[8]. It is interesting to observe that there are
authors who advocate the application of the Gamma and the Lognormal distributions to model
rain-derived statistics resulting from data obtained in tropical and temperate areas, respectively. Indeed,
Andrade at al. [9] concluded that the Inverse Gaussian and Gamma distributions were the most
adequate statistical models for the rain attenuation in the terrestrial links converging at the RIS station
(in a tropical region), for medium and high attenuation levels. Recently, Paulson et al. [10] adopted
the Lognormal law for joint probability density function of the attenuations on two links. However,
the parameters of the distribution were determined from measurements performed by the Chibolton
meteorological radar, United Kingdom. The model was used to determine diversity improvement (DI)
and diversity gain (DG) factors for converging links, using a maximum likelihood estimation method.
While the above could be classified as parametric methods, the empirical model by Pérez García et al.
[8] was based on measurements of the cumulative distribution functions of differential rain
attenuation on several pairs of links and of rain attenuation on individual links. These measurements
were performed at the already mentioned Rua dos Ingleses station (four 15-GHz links and two
18-GHz links), as well as in the City of Brasília, Brazil (seven 23-18-GHz links and six 38-18-GHz links).
Prediction is based on an analytic expression with coefficients determined by curve fitting to
well as the difference in path lengths to map the cumulative distribution functions of rain attenuation
on the two individual links into that of the differential rain attenuation.
The present work will present a distribution-free model based on fundamental principles and on the
measured cumulative distribution function of point rainfall rate (without assuming any specific
probability law) to determine the cumulative distribution function of the differential rain attenuation
between two converging links operating at the same frequency, greater than 10 GHz. The
development extends the Misme and Fimbel model [11], which determines the cumulative distribution
function of rain attenuation on an isolated link from its parameters and radio climatic data for the
region. Thus, the present model at least initially follows a different approach from those leading to the
previous methods. Next, the model numerically determines the joint cumulative distribution function
of the attenuations on the two links over a fine grid of two-dimensional joint attenuation points. From
this partial result, the cumulative distribution function of the differential rain attenuation between the
links is easily determined by a simple summation. The present model generalizes the development by
Stola [12], also based on the Misme and Fimbel procedures but limited to the determination of the
cumulative distribution function of the rain attenuation simultaneously exceeded on two converging
links. Following this Introduction, Section II will briefly review the original Misme and Fimbel
model [11] and will discuss its extension to the determination of the cumulative distribution function
of the differential rain attenuation between two co-channel converging links. Section III will describe
experimental campaigns providing input data for comparison with model predictions and present
effective values for climatic parameters. Section IV will compare calculation and measurement
results. Additionally, it will present model predictions of the effects of variations of the angle
between the links and the path lengths on the cumulative distribution function of the differential rain
attenuation. The features of the present model make it possible to provide explanations for the
observed changes of the cumulative distribution function due to variation on these parameters. Based
on the extended Misme and Fimbel model, Section V will analyze the effects of the differential rain
attenuation on the availability of co-channel converging links according to the conservative and more
realistic procedures, considering the angular discrimination of the receiving antenna. Finally,
conclusions will be presented in Section VI.
II. THE MISME AND FIMBEL MODEL AND ITS EXTENSION
The Misme and Fimbel model [11] for the estimation of the cumulative distribution function of the
rain attenuation on an isolated terrestrial link adopts the following simplifying assumptions for the
rain field:
• intense precipitation occurs in the form of circular cylindrical cells with constant rainfall rate R (mm/h);
(
)
β=
d
100
R
d(R)
o (1)with the parameter values do = 2.2 km and = 0.4, as long as d(R) dmax (the maximum cell
diameter, equal to 33 km);
• the point rainfall rate is a random variable characterized by its measured cumulative distribution function Pr(R) that is independent from the observation point within the region of
interest;
• at each instant of time, attenuation on a link is caused by a single rain cell;
• the specific attenuation γ (dB/km) can be related to the rainfall rate R (mm/h) through the expression γ = k Rα, with the parameters k and α being determined as functions of the
operating frequency and the polarization according to the most recent version of
Recommendation ITU-R P.838 [13].
It should be noted that, to simplify numerical procedures, instead of explicitly considering the small
contribution from residual precipitation to rain attenuation according to the Misme and Fimbel model
specification [10], these effects have been included by extending the validity of expression (1) to
rainfall rates below the original threshold of 10 mm/h. Even though relevant developments based on
the Misme and Fimbel model have been proposed with the objectives of simplifying or improving the
corresponding algorithms [14], the present work will strictly adhere to all the characteristics of the
original model, except for the slight modification described above.
As illustrate din Figure 1, the intersection Lo1 (km) between a cell with rainfall rate R and link AB
with path length D1 (km) causes the attenuation Ao1 = kRαLo1 (dB). When this rain cell is displaced by
all possible manners while keeping the length Lo1 of the intersection fixed, the cell center describes
the dashed geometric locus V11V21I1V31V41I2 also shown in Figure 1. The geometric locus limits the
area S(Ao1, R) defined by [11]
(
) (
= −)
− + − − − 21 o 2 1 o 1
o 2
1 o 2 2
2 1 o 2 1 o 1 1
o L d L
L L d arctan d
2 1 L d L D R , A
S (2)
The two terms separated by the addition sign in the right-hand side of expression (2) represent the
areas of the rectangle V11V21V31V41 and the two circular segments limited by the geometric locus
associated with link AB, respectively. For each assumed value for Ao1, a minimum rainfall rate Rmin
(mm/h) should be found to guarantee the inequalities
Lo1(Ao1, Rmin) =
A
o1kR
min∝≤
d(R
min)
andL
o1(A
o1, R
min) =
A
o1kR
min∝≤
D
1 (3)Its value should be determined from these inequalities and expression (1), considering the upper limit
expression (2) real and positive or null. It is also noted that a cell with rainfall rate R and center in the
interior of the geometric locus will cause attenuation A > Ao1.
Fig. 1. Converging links AB and AC with respective path lengths D1 and D2 making the angle θ at the common terminal, associated geometric loci V11V21I1V31V41I2 and V12I1V22V32V42I2 corresponding to attenuations Ao1 and Ao2, respectively,
and to a cylindrical cell of rainfall rate R, as well as the intersection V12I1V41I2 between the two geometric loci.
Based on the assumptions above, geometrical concepts and additional considerations, as well as on
the total probability theorem [15], Misme and Fimbel established the following general expression for
the cumulative distribution function of rain attenuation on the isolated link AB
{
}
( )
( )
( )
[
]
( )
[
]
r1
P r
2
r 1 o r
R 2
1 o 1
o dP
4 P R d
P R , A S dR R p 4 R d
) R , A ( S A
A Pr
min
min π
= π
= >
∞
(4)
In the original integral (reproduced between the equality signs in the above expression) [11],
numerically evaluated for Ao1values of interest, pr(R) is the probability density function of the point
rainfall rate, assumed to follow a lognormal law with parameters determined from corresponding
measurements. A trivial change of variable leads to the last integral of expression (4), which can be
numerically evaluated using the measured cumulative distribution function of the point rainfall rate.
That is, without resorting to particular probability distributions and also avoiding possible errors
associated with numerical differentiations involved in the determination of pr(R) from Pr(R).
Figure 1 also displays a second link AC with path length D2 (km) that makes an angle θ (degrees) with the former at the common terminal A, as well as the associated geometric locus V12I1V22V32V42I2
corresponding to the same cell with rainfall rate R and attenuation Ao2. Based on the development
summarized in the previous paragraphs, the joint probability that the attenuations in the two links
{
}
[
( )
]
( )
[
]
r1
P r
2
r 2 o 1 o 2
o 2 1 o
1
dP
4
P
R
d
P
R
,
A
,
A
S
A
A
,
A
A
Pr
min
π
=
>
>
(5)In the above expression, S (Ao1, Ao2, R) is the intersection between the surfaces limited by the two
geometric loci, represented by the light gray area in Figure 1, and Pmin is the value of the rainfall rate
cumulative distribution function corresponding to Rmin = max{Rmin1, Rmin2}, where Rmin1 and Rmin2 are
the minimum rainfall rates for the two individual links, respectively. Equation (5) generalizes the
Misme and Fimbel model to consider two converging links and also extends the formulation
presented by Stola [12], restricted to the particular case Ao1 = Ao2 and analyzed in more detail for D1 =
D2. Once the configuration of interest has been specified, the integral in expression (5) can be
numerically calculated for pairs of attenuation values (Ao1, Ao2) defined over a fine grid with
resolution ε (that is, Ao1 and Ao2 assume the values mεand nε, where m, n = 0,1, … , N, respectively). The area S (Ao1, Ao2, R) is exactly determined by means of an algorithm that combines simple
computational geometry procedures [16]. It is observed that the geometric loci are convex polygons
characterized by straight line or circular arc segments. Therefore, these features will be conserved by
their intersection, defined by all: (i) vertices of one geometric locus located in the interior of the other
(V12 and V41 in Figure 1); and (ii) crossings between segments from different geometric loci (I1 and I2
in Figure 1). Next, these points are sorted in the counter-clockwise sense and it is determined whether
two consecutive points should be connected by a straight line or a circular arc segment. In the latter
case, the position of the center of the corresponding circle is also determined. Finally, the intersecting
polygon is subdivided into triangles and circular segments. The area S (Ao1, Ao2,R) is exactly equal to
the sum of the areas of these basic elements.
In principle, the cumulative distribution function of the differential rain attenuation Pr{a1-a2 >Ao}
would be determined by the double integration of the joint probability density function paa
(
A1,A2)
2 1
in the region of interest, below the straight line A1 - A2 = Ao, as indicated by Figure 2. That is,
{
1 2}
(
1 2)
1 2max max
2 2
1 ,
Pr
a
a
A
p
A
A
dA
dA
o
o A A
o A
A A
a a o
−
+
=
>
−
(6)where Amax is an upper limit beyond which the contribution from the above integral to the cumulative
distribution function of the differential rain attenuation can be neglected. Tests have shown that the
adopted value Amax = 47 dB is adequate for this purpose. As indicated by expression (6), the integral
between square brackets should be evaluated for an arbitrary value of A2 in the interval (0, Amax-Ao).
The result, which is a function of A2, should then be integrated in the same interval.
Figure 2 indicates that the region of interest can be approximately subdivided into a large number of
{
}
(
)
{
}
{
}
{
}
[
]
= = = ε + ε − + ε + > + > − ε − > + > ≈ ≈ ε + < < ε − + > ≈ ≈ ≈ > − N 1 n n 2 2 o n 2 1 n 2 2 o n 2 1 N 1 n n 2 2 n 2 o n 2 1 N 1 n 2 A 2 A A A A 2 1 2 1 a a o 2 1 2 A a , A A a Pr 2 A a , A A a Pr 2 A a 2 A , A A a Pr dA dA A , A p A a a Pr n 2 n 2 max o n 2 2 1 (7)Note that the values for each term inside the square brackets in the last line of expression (7) have
previously been calculated by equation (5) and stored. That is, Pr{a1-a2 >Ao} values have been
directly obtained from a summation of differences of Pr{a1 > Ao1, a2 > Ao2} values, circumventing the
time-consuming and numerically-unstable determination of paa
(
A1,A2)
2
1 .
Fig. 2.Region of interest for the estimation of Pr
{
a1−a2 >Ao}
and its approximate subdivision into narrow rectangles.Figure 2 also shows that the approximated region of integration represented by the narrow gray
rectangle differs from the exact one by: (i) incorrectly considering a small triangle above the line A1 -
A2 = Ao; and (ii) incorrectly neglecting another small triangle below same line. These triangles are
images of each other around their common vertex and have the same area, which is small when
compared to that of the gray rectangle. Additionally, the joint probability density function of the
attenuations on the two links does not display discontinuities and the contributions of the two triangles
are approximately equal. Therefore, the last line of equation (7) provides a very good approximation
to Pr{a1-a2 >Ao}. Additionally, Figure 2 indicates that an upper bound to Pr{a1-a2 >Ao} can be
obtained by keeping the lower left vertices of the narrow rectangles at the line A1 - A2 = Ao and that a
line. Performed test have indicated that the two bounds converge very fast to each other and to the
results from expression (7) as soon as the value of the differential attenuation Ao exceeds a couple of
decibels, for the assumed values for the increment ε (0.01 dB for A1 or A2 less than 1 dB, since the joint probability displays fast variations in these regions, and 0.1 dB otherwise). It should be observed
that the approach described by expression (7) could be used by any model that determines the
cumulative distribution function of the differential rain attenuation from the joint cumulative
distribution function of the attenuations on two links.
Finally, it is concluded from equations (5) and (7) that, for a set of link parameters, the extended
Misme and Fimbel model maps the directly-measured cumulative distribution function of the rainfall
rate onto that of the differential rain attenuation. Therefore, the ideal comparison between
experimental results and model predictions should be based on cumulative distribution functions of
the rainfall rate and the differential rain attenuation resulting from the same period of measurements.
The results from such comparisons will be presented in the next section.
III. INPUT DATA
In a collection of papers published during the 1970’s, Morita and co-workers [1]-[4] reported on
measurements performed on three short 19-GHz links converging at the Musashino Electrical
Communication Laboratory (ECL), Japan. More recently [7],[8], similar measurements were
performed in the City of São Paulo, Brazil, using the following links operated by Empresa Brasileira
de Telecomunicações (Embratel) and converging at the central station of Rua dos Ingleses (RIS). The
names of the remote stations, frequencies of operation, path lengths, polarizations (representing
horizontal and vertical polarizations by H and V, respectively) and azimuths (at ECL) of the links, as
well as their periods of operation, are presented in Table I.
TABLE I. PARAMETERS AND PERIODS OF OPERATION OF THE LINKS
Central Station Remote Station Frequency Path Length Polarization Azimuth Operation
ECL Shakujii 19.1GHz 4.3 km H 65.0o Jul.1971 to Sep.1971
Jan.1974 to Dec.1974
ECL Shinkawa 19.3 GHz 4.7 km H 180.0o Jan.1974 to Dec.1974
ECL Sakai 19.0GHz 2.9 km H 228.0o Jul.1971 to Sep.1971
RIS Shell 18.6GHz 7.5 km V 126.6o Aug.1994 to Mar.1995
Sep.1995 to Aug.1996
RIS Cenesp15 14.6 GHz 12.8km H 220.0o Apr.1994 to Mar.1995
Sep.1995 to Aug.1996
RIS Cenesp18 18.6 GHz 12.8km V 220.0O
Apr.1994 to Mar.1995 RIS Bradesco2 14.6 GHz 12.8km V 278.6o Apr.1994 to Dec.1994 Sep.1995 to Aug.1996
RIS Barueri 14.5 GHz 21.7 km V 290.4o Apr.1994 to Mar.1995
Sep.1995 to Aug.1996
Angles between links can be determined from azimuth differences. In addition to received signal
yielding cumulative distribution functions of one-minute point rainfall rate at the central station,
attenuations on isolated links and differential attenuations on pairs of links.
Several authors performed rain cell size measurements using meteorological radars located in
temperate regions [17]-[20], and a high-elevation slant path at a tropical site [21]. Some of the results
were presented in the form of a functional relation between the average cell diameter and the rainfall
rate and seem to be in reasonable agreement with the assumed values for parameters and do of the
model represented by expression (1). However, radar measurements performed in the Amazon region
provided probabilities that a cell diameter be exceeded for rainfall rate thresholds in the convective
regime that are substantially higher than those originating from temperate climates [22]. This may be
taken as an indication that the original values are not universal. Moreover, it is easily verified that the
combination of the assumption that attenuation on a link is due to a single rain cell with the
originally-proposed values for and do, is not capable of explaining the measured attenuation values, which can
reach 33 dB or more during 0.01 % of the time for the RIS experiment.
Ideally, do and β should be determined from radar measurements, as described by items 2.2 and 2.3,
as well as by Figure 1 of the original reference for the Misme and Fimbel model [11]. Note that these
two parameters should depend only on the rain climate and should not depend on the parameters of
any link, either operational or in the planning stage. Unfortunately, radar measurements of rain cell
sizes are not available for all climatic regions of the world. To circumvent the absence of information,
we described an alternative approximate method for the estimation of the two parameters, based on
the cumulative distribution functions of the point rainfall rate and the rain attenuation on links
simultaneously measured in the region of interest. To extend the applicability of the Misme and
Fimbel model to the links converging at the RIS station, parameter values corresponding to the
effective rain cell diameter were estimated by least-squares fitting a straight line (y = βx + log do) to data rearranged as indicated in the following equation
( )
[
]
o p op p
p p
p
log
d
x
log
d
R
100
log
kR
A
log
R
d
log
y
=
=
α=
β
+
=
β
+
(8)where attenuation Ap and rainfall rate Rp values were obtained from the respective measured
cumulative distributions for the same percentages of time p. Specific attenuation values γ = kRα were
determined considering the appropriate polarizations and operating frequencies according to
Recommendation ITU-R P.838-3 [13]. For reference purposes, the same calculations were also
performed for links converging at the ECL station. Figure 3 presents the (xp, yp) data sets
corresponding to the links. The Figure also shows straight-line segments resulting from the least
squares fit to data from each link and the estimated effective values of the parameters (log do) and .
As expected, the effective values for the parameter do are larger than the original one for the relatively
Sarkar et al. [23] using data from the Indian subcontinent. On the other hand, the effective do values
for the ECL links are closer to those estimated from radar measurements, in reasonable agreement
with the original expression (1), and with the assumption that attenuation on shorter links would be
mainly due to individual cells. Due to errors in the present alternative approximation method, the
results in Figure 3 clearly indicate that the effective parameter values do and derived from equation
(8) depend on the path length, polarization and frequency of the links. However, to be consistent with
the assumptions of the original Misme and Fimbel model [11], it will be assumed that do and are
exclusively climatic parameters. Therefore, the present work estimated the effective values do= 6.80
km and = 0.52 for calculations involving the RIS links, and do= 2.80 km and = 0.14 for those
corresponding to the ECL links, by the average values of the samples from the links. It should be
remarked that tests indicated that the extended Misme and Fimbel model is relatively insensitive to
variations in the parameter β.
Fig. 3. Determination of effective values for the parameters (log do)and , displayed in the boxed equations in the same order of the
respective curves (data corresponding to ECL links adapted from references [1]-[4]).
IV. COMPARISON BETWEEN CALCULATIONS AND MEASUREMENTS, AND MODEL PREDICTIONS
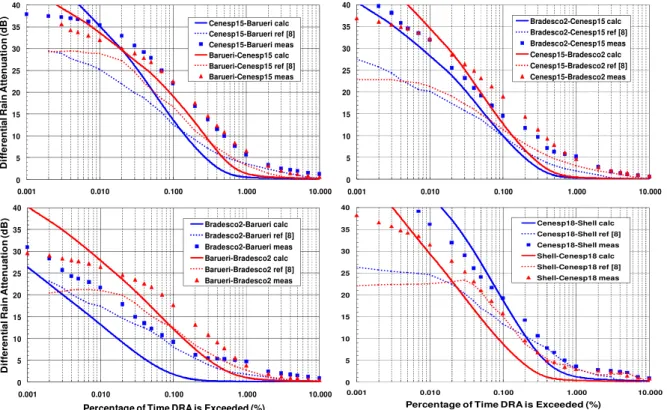
Figure 4 displays the calculated and measured cumulative distribution functions of differential rain
attenuation (DRA), corresponding to the converging ECL links. In this Figure, calculated results,
represented by continuous or dashed lines, should be compared with measurement results, represented
by filled squares or triangles. It is assumed that Ao > 0 and Figure 4 displays both sets of results for
Pr{a1 – a2>Ao} and Pr{a2 – a1>Ao}. Results for the converging RIS links are displayed in Figure 5,
using the same conventions.
y = 0.4790x + 0.8460 R² = 0.9996 y = 0.5710x + 0.7545
R² = 0.9994 y = 0.5256x + 0.8977
R² = 0.9978
y = 0.5150x + 0.7359 R² = 0.9931
y = 0.4263x + 0.7851 R² = 0.9750 y = 0.2046x + 0.6117
R² = 0.7006
y = 0.1427x + 0.4513 R² = 0.8196
0.2 0.4 0.6 0.8 1.0 1.2 1.4 1.6 1.8
0.1 0.2 0.3 0.4 0.5 0.6 0.7 0.8 0.9 1.0 1.1 1.2 1.3 1.4 1.5 1.6 1.7
y
=
l
o
g
d
(R
)
x = log(100/R)
Bradesco2 Cenesp15
Barueri Cenesp18
Shell Shakujii
Fig. 4. Calculated (continuous and dashed curves) and measured (filled symbols) cumulative distribution functions for the differential rain attenuation between the converging ECL links described in Section III (adapted from reference [4]).
Fig. 5. Calculated (continuous and dashed curves) and measured (filled symbols) cumulative distribution functions for the differential rain attenuation between the converging RIS links described in Section III.
Both Figures also show the results from the prediction model proposed by Garcia et al. [8], which
estimates the cumulative distribution function of the differential rain attenuation through
, = − 0.34 . + 0.004"# − # " . $ %& .' (9)
In equation (9), Adiff,12(p) and ai(p) (i = 1,2) are the differential rain attenuation between links 1 and 2,
the rain attenuation in link i (i = 1,2) corresponding to the percentage level p. The angle between the
links should be expressed in radians, the path lengths Di (i = 1,2) in kilometers, and the frequency in
0 5 10 15 20 25 30 35 40
0.001 0.010 0.100 1.000 10.000
D if fe re n ti a l R a in a tt e n u a ti o n ( d B )
Percentage of Time DRA is Exceeded (%)
Shakujii-Shinkawa calc Shakujii-Shinkawa ref [8] Shakujii-Shinkawa meas Shinkawa-Shakujii calc Shinkawa-Shakujii ref [8] Shinkawa-Shakujii meas 0 5 10 15 20 25 30 35 40
0.001 0.010 0.100 1.000 10.000
Percentage of Time DRA is Exceeded (%)
Shakujii-Sakai calc Shakujii-Sakai ref [8] Shakujii-Sakai meas Sakai-Shakujii calc Shakujii-Sakai ref [8] Sakai-Shakujii meas 0 5 10 15 20 25 30 35 40
0.001 0.010 0.100 1.000 10.000 Percentage of Time DRA is Exceeded (%)
Cenesp18-Shell calc Cenesp18-Shell ref [8] Cenesp18-Shell meas Shell-Cenesp18 calc Shell-Cenesp18 ref [8] Shell-Cenesp18 meas 0 5 10 15 20 25 30 35 40
0.001 0.010 0.100 1.000 10.000
D if fe re n ti a l R a in A tt e n u a ti o n ( d B ) Cenesp15-Barueri calc Cenesp15-Barueri ref [8] Cenesp15-Barueri meas Barueri-Cenesp15 calc Barueri-Cenesp15 ref [8] Barueri-Cenesp15 meas 0 5 10 15 20 25 30 35 40
0.001 0.010 0.100 1.000 10.000
Bradesco2-Cenesp15 calc Bradesco2-Cenesp15 ref [8] Bradesco2-Cenesp15 meas Cenesp15-Bradesco2 calc Cenesp15-Bradesco2 ref [8] Cenesp15-Bradesco2 meas 0 5 10 15 20 25 30 35 40
0.001 0.010 0.100 1.000 10.000
D if fe re n ti a l R a in A tt e n u a ti o n ( d B )
Percentage of Time DRA is Exceeded (%)
Gigahertz. This model is particularly attractive when the cumulative distribution functions of the rain
attenuation on both links are immediately available.
The agreement between calculations and measurements displayed in Figures 4 and 5, depending on
the tested case, ranges from good to poor. For example, it is good for both models in the cases of the
Shakujii-Shinkawa data of Figure 4 for percentages of time greater than 0.004 %. On the other hand,
it is poor in the case of the Bradesco2-Barueri data, particularly for the proposed model and
percentages of time between 0.01 % and 0.1 %, and for the model of reference [8] in the cases
displayed in the right panels of Figure 5, for percentages of time less than 0.02 %.
Figure 5 displays several examples of slow variations of the measured differential rain attenuation
as the time percentage decreases below 0.01%. This is due to link design and technical characteristics
of the receivers, which reach the reception threshold for attenuations near 37 dB. Therefore, only data
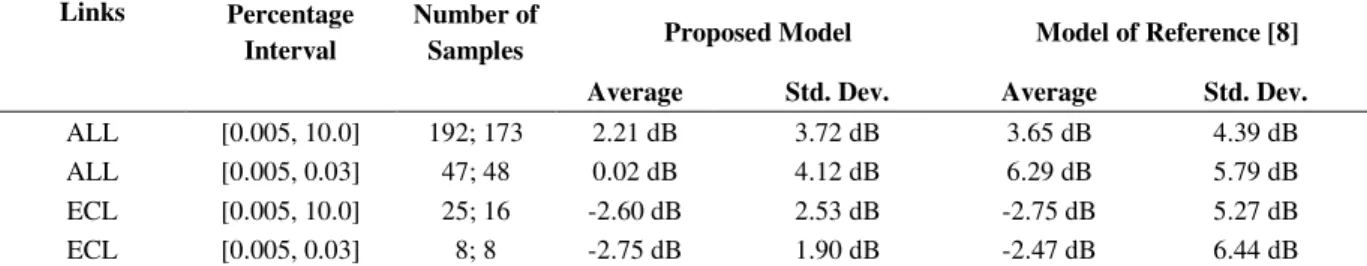
from Figures 4 and 5 corresponding to time percentages above 0.005 % were used to determine the
average value and the standard deviation of the error {DRAmeas(p) – DRAcalc(p)}, where p represents
the common percentage of time. Two percentage intervals were used in the calculations: (i) [0.005 %,
10.0 %], which covers most of the available data, emphasizing large probabilities and low DRA
values; and (ii) [0.005 %, 0.03 %], which emphasizes the exceedance probabilities of interest for
potential applications of the proposed model. The average values and the standard deviations of the
errors for the two models are presented in Table II for each percentage interval, as well as the
respective numbers of samples available for the corresponding calculations. The first two lines
consider all the pertinent data in Figures 4 and 5, including the relatively long links converging at the
RIS station. On the other hand, the last two lines consider only the shorter links converging at the
ECL station. The level of agreement observed in Table II is not uncommon in modeling efforts of rain
effects on radio links [24],[25]. It is seen that the average values and the standard deviations of the
errors resulting from the extended Misme and Fimbel model are generally less than the corresponding
figures provided by that of reference [8]. However, the parameters of the latter model were estimated
with basis on nineteen Brazilian links, and most of the ones not converging at the RIS station are
considerably shorter than those characterized in the last four lines of Table I. Indeed, nine of the links
are shorter than 2.0 km and twelve of them are shorter than 4.5 km. Additionally, expression (9) is
applied here to a data set which differs from the original one. These facts may explain why Garcia at
al. [8] reported average values and standard deviations of the errors which are substantially less than
the ones displayed in Table II.
It should also be stressed that no attempts have been made at minimizing the observed errors
through the application of parameter optimization techniques directly to the data in Figures 4 and 5.
This could have been done and would certainly improve the observed agreement. However, this
procedure has not been used, since it would be in contradiction with the essential assumptions and
methodology leading to the original Misme and Fimbel model and its present extension, which were
calculated and measured distributions are the non-uniformity of the rainfall rate inside the cell, the
effects of multiple cells on differential rain attenuation, and errors due to the estimation of do and
through the alternative approximate methodology described in Section III.
TABLE II. AVERAGE AND STANDARD DEVIATION OF ERRORS BETWEEN MEASUREMENT AND PREDICTION RESULTS
Links Percentage
Interval
Number of
Samples Proposed Model Model of Reference [8]
Average Std. Dev. Average Std. Dev.
ALL [0.005, 10.0] 192; 173 2.21 dB 3.72 dB 3.65 dB 4.39 dB
ALL [0.005, 0.03] 47; 48 0.02 dB 4.12 dB 6.29 dB 5.79 dB
ECL [0.005, 10.0] 25; 16 -2.60 dB 2.53 dB -2.75 dB 5.27 dB
ECL [0.005, 0.03] 8; 8 -2.75 dB 1.90 dB -2.47 dB 6.44 dB
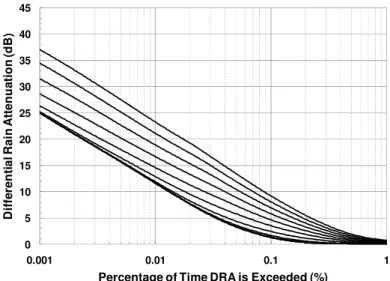
Next, the extended Misme and Fimbel model was used to determine the cumulative distributions of
the differential rain attenuation between vertically-polarized 15-GHz links located in the São Paulo
region (that is, assuming do = 6.80 km and = 0.52) with path lengths D1 = D2 = 10 km, for angles
varying between 5o and 50o with 5o increments and between 50o and 180o with 10o increments. The
resulting distributions for increasing angles are displayed in Figure 6 from left to right. Fast variations
in the curves as a function of the angle between the links are initially observed, for angles less than
approximately 60o. However, the same variation became extremely slow beyond this threshold. Note
that, for any fixed time percentage, the differential rain attenuation initially increases and gradually
tends to a constant value as the angle between the links increases [4].
Fig. 6. Cumulative distribution functions of the differential rain attenuation presented from left to right for angles varying
between 5o and 50o with 5o increments and between 50o and 180o with 10o increments, assuming vertically-polarized
15-GHz links located in the São Paulo region (do = 6.80 km and = 0.52) with fixed path lengths D1 = D2 = 10 km.
The present model was also used to analyze the effects of the increase of the path length of one link
on the cumulative distributions of the differential rain attenuation. This study was performed for
conditions of the São Paulo region and vertically-polarized 15-GHz links, fixing the path lengths D1 =
10 km and θ = 15o, while the variable path length D2 increased from 3 km to 15 km in 1-km
increments. The resulting distributions for increasing values of D2 are displayed in Figure 7 from right
0 5 10 15 20 25 30 35 40 45
0.001 0.01 0.1 1
D
if
fe
re
n
ti
a
l R
a
in
A
tt
e
n
u
a
ti
o
n
(
d
B
)
to left. Fast variations in the curves as a function of D2 are initially observed, for path lengths less than
10 km. No variations were observed beyond this threshold. For any fixed time percentage, the
differential rain attenuation initially decreases and gradually tends to a constant value as the path
length D2 increases.
Fig. 7. Cumulative distribution functions of the differential rain attenuation presented from right to left for increasing values of the path length D2 (from 3 km to 15 km in 1-km increments), assuming vertically-polarized 15-GHz links located in the
São Paulo region(do = 6.80 km and = 0.52) with fixed path length D1 = 10 km and angle θ = 15
o .
The above predictions can be explained as follows. Let a cell of rainfall rate R cause attenuations
Ao1 and Ao2 on the two converging links AB and AC of Figure 1, respectively. These values define the
geometric loci sketched in the same Figure, as already discussed. If the center of the rain cell is
located inside the polygon V11V21V31I1V12I2, then a1> Ao1, a2< Ao2, and a1 - a2> Ao1 - Ao2 = Ao. The
dotted area S(Ao1, R) – S (Ao1, Ao2, R) of this polygon, which directly contributes to Pr{a1 - a2>Ao},
initially increases very rapidly when the angle θ increases from zero. Beyond a certain threshold which depends on the parameters Ao1, Ao2, and R, this increase becomes very slow. This explains the
dependence of the cumulative distributions of the differential rain attenuation on the angle between
the two converging links with fixed path lengths, observed in Figure 6. On the other hand, the same
area initially decreases when the path length D2 of link AC increases from zero, while the path length
D1 of link AB and the angle θ are kept unchanged. Another threshold, also dependent on Ao1, Ao2, and
R, will be reached beyond which the far end of the geometric locus associated with link AC will be
located outside the geometric locus associated with link AB. Beyond this threshold, the area of the
polygon V11V21V31I1V12I2, dotted in Figure 1, will no longer change. This explains the observations in
Figure 7. It should be recognized that the present arguments have been presented for fixed values of
Ao1, Ao2, and R, and that there are infinitely many combinations of these parameters which lead to a
pre-specified value of Ao. However, these arguments can be repeated for all combinations of these
parameters yielding Ao, confirming the above justifications for the observed dependences on the angle
0 5 10 15 20 25 30 35 40 45
0.001 0.01 0.1 1
D
if
fe
re
n
ti
a
l R
a
in
A
tt
e
n
u
a
ti
o
n
(
d
B
)
between the links and the path length. Note that prediction results entirely consistent with those in
Figure 6 were previously presented by Morita and Higuti [4] without explanations.
V. DEPENDENCE OF THE AVAILABILITY OF A LINK ON THE DIFFERENTIAL RAIN ATTENUATION
This section analyzes two procedures to determine the cumulative distribution function of the ratio
C/I (dB) between the desired and interference powers at the same receiver, assuming the existence of
only two vertically-polarized 8-km converging links operating at the frequency of 15 GHz under the
climatic conditions of the São Paulo region (do = 6.80 km and = 0.52). The first procedure is
conservative: it considers the rain attenuation Ad (dB) on the desired link and neglects the attenuation
Ai (dB) on the interfering link, in such a way that the ratio C/I is estimated using the simple expression
C/I = (C/I)o- Ad. The second procedure is realistic and considers both attenuations. In this case, the
ratio C/I and the differential rain attenuation are related through C/I = (C/I)o- (Ad - Ai) = (C/I)o - Adiff.
In both expressions, (C/I)o = -grd(θ) represents the nominal value of the ratio C/I, assuming clear-sky
conditions, and grd(θ) is the discrimination (dB) of the receiving (interfered with) antenna for the
angle θ between the links, provided by the corresponding normalized radiation pattern. The
(C/I)ovalues of 50 dB, 45 dB, and 40 dB, assumed in the present study for the angles of 50º, 20º, 12º,
respectively, are inferior to the worst-case values provided by Recommendation ITU-R F.699-7 [26]
for 6-ft (1.8 m) antennas operating at 15 GHz and consider equal equipment on both links. Both
AdandAdiff are random variable, and their cumulative distribution functions were determined by the
models described in section II, considering the above angles, when applicable. From these results and
the above expressions, the cumulative distribution functions of the random variable C/I were obtained
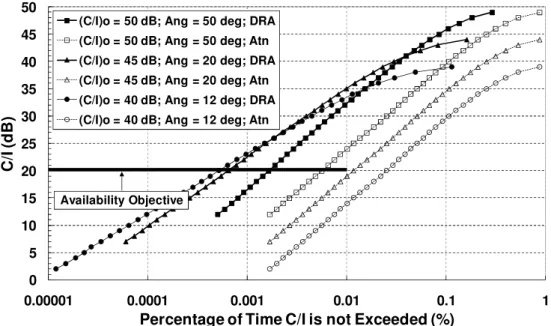
for the two procedures and the three values of (C/I)o. Figure 8 displays the results for the conservative
procedure using dashed lines with hollow symbols and those for the realistic procedure using
continuous lines with filled symbols. Note that a common symbol is adopted for each value of (C/I)o.
The results indicate that, for C/I< 35 dB, regardless of the value of the ratio (C/I)o (or, equivalently, of
the angle between the links), the time percentage that any given level of the ratio C/I is not exceeded
is always greater when calculated by the conservative procedure.
To analyze the impact of the above procedures for the estimation of the effects of the differential
rain attenuation on the availability of a link and on the efficient use of the electromagnetic spectrum,
link-design criteria have to be established. It will be assumed that the thermal noise power level is
much less than that of interference and can be neglected. It will also be assumed that a link is
unavailable when C/I 20 dB. As a design objective, it will be required that, due to differential rain
attenuation, the link should be available during 99.99 % of the time (that is, it should be unavailable
during less than 53 minutes in a year). In other words, to meet this availability objective, the C/I
cumulative distribution curve for the link should intercept the black horizontal bar displayed in Figure
8. Note that the curves corresponding to the conservative procedure and to the values of 40 dB and 45
procedure would have to aim at a very high 50-dB attenuation margin for the link and to avoid reusing
the same frequency and the same polarization for other converging links making angles less than 50o
with the planned one. Therefore, only seven links converging at the central station would be able to
share the same frequency and polarization. On the other hand, based on the realistic procedure, it
would be possible to design the same link with a 40-dB attenuation margin and to reuse the same
frequency and polarization for links making angles of 12o with the planned one. In this case, 31 links
converging at the central station would be able to share the same frequency and polarization. Note that
the present analysis is based on a best-case scenario, which assumes only one interfering link.
Additional interference from other links would degrade the C/I curves in Figure 8, moving their
intersections with the availability objective bar to the right. This may be critical in terms of the
conservative procedure, but Figure 8 indicates that designs based on the realistic procedure would
support additional degradation.
Fig. 8. Cumulative distribution functions of the ratio C/I for the conservative (dashed lines with hollow symbols) and realistic (continuous lines with filled symbols) procedures, and three values of the ratio (C/I)o (or, equivalently, three angle
between the converging links), as well as the availability objective adopted in link design
VI. CONCLUSION
This work presented a distribution-free method that extends the Misme and Fimbel model to
determine the cumulative distribution function of the differential rain attenuation between two
converging links in co-channel operation at frequencies greater than 10 GHz.
Model predictions were compared with results from measurements performed by Morita et al.
[1]-[4],and by the Radio Propagation Group at CETUC/PUC-Rio [7],[8], as well as with those from
another model [8]. These comparisons justify the introduction of the present model. However,
additional tests involving other models and additional experimental data are necessary to a better
understanding of the present line of study. 0
5 10 15 20 25 30 35 40 45 50
0.00001 0.0001 0.001 0.01 0.1 1
C
/I
(
d
B
)
Percentage of Time C/I is not Exceeded (%) (C/I)o = 50 dB; Ang = 50 deg; DRA
(C/I)o = 50 dB; Ang = 50 deg; Atn (C/I)o = 45 dB; Ang = 20 deg; DRA (C/I)o = 45 dB; Ang = 20 deg; Atn (C/I)o = 40 dB; Ang = 12 deg; DRA (C/I)o = 40 dB; Ang = 12 deg; Atn
Observed differences between the predictions from the proposed model and the experimental results
could be attributed to several factors: the existence of prevailing directions of rain structures in the
region, different cell shapes, non-uniformity of the rainfall rate inside the cell, and the effects of
multiple cells on differential attenuation. A very important source of errors is the estimation of the
parameters do and by the methodology described in Section III. Possibly different distributions for
convective and stratiform rain may not be adequately considered by the model. The inclusion of any
of these effects in more refined models would be a challenging task, open to future contributions to
this area of study.
Next, the extended Misme and Fimbel model was used to determine the effects of the increase of
the angle between the links and of the path length of one link on the cumulative distribution of the
differential rain attenuation. For a fixed time percentage, a fast increase of the differential rain
attenuation with the angle was initially observed. However, the increase became very slow beyond a
threshold. On the other hand, the initially fast decrease the differential rain attenuation with the path
length of the interfering link ceased to occur beyond another threshold. Explanations for these
observations were provided in terms of the geometric loci associated with attenuation levels on the
two links. One of the positive features of prediction methods based on fundamental principles such as
the extended Misme and Fimbel model is that they may provide physical explanations and better
understanding of the effects of different input parameters on the observed variables. This may provide
useful guidance to designers and researchers in their respective works.
Two procedures to determine the cumulative distribution function of the ratio C/I (dB) between the
desired and interference powers at the same receiving antenna were also analyzed, for different
angular discrimination values. The first procedure is conservative: considers the rain attenuation on
the desired link and neglects the attenuation on the interfering link. The second procedure is more
realistic and considers both attenuations. To analyze the impact of the above procedures for the
estimation of the effects of the differential rain attenuation on the availability of a link and on the
efficient use of the electromagnetic spectrum, a link-design objective was established. To strictly meet
the objective, the designer using the conservative procedure would have to aim at a 50-dB attenuation
margin for the link and to avoid reusing the same frequency and the same polarization for other
converging links making angles less than 50o with the planned one. However, based on the more
realistic procedure, it would be possible to design the same link with a 40-dB attenuation margin and
to reuse the same frequency and polarization for links making angles of 12o with the planned one.
That is, these results indicate that the more realistic procedure could provide more economic link
designs and more efficient use of the spectrum. Therefore, it would be interesting to confirm these
calculations by the analysis of additional configurations and by appropriate measurements.
Finally, it should be observed that the application of the present model to converging satellite links
be relatively short and the assumption that attenuation is caused by a single rain cell is expected to
hold. Such an application may be the object of a future report.
ACKNOWLEDGMENT
The authors thank Dr. Rodolfo S. L. de Souza (Instituto Nacional de Metrologia, Normalização e
Qualidade Industrial, Rio de Janeiro, Brazil) and Prof. N. A. Pérez García (Universidad de los Andes,
Mérida, Venezuela) for providing and processing the Cenesp18-RIS/Shell-RIS data, respectively.
They also thank the reviewers for their detailed and insightful comments and constructive
suggestions. Their valuable contributions helped the authors to produce an improved paper.
REFERENCES
[1] M. Shimba, K. Morita, and A. Akeyama, “Radio propagation characteristics due to rain at 20-GHz band,” IEEE Transactions on
Antennas and Propagation, vol. 22, no. 3, pp. 507-509, May 1974.
[2] K. Morita, O. Sasaki, and A. Akeyama, “Differential rain attenuation on adjacent 20-GHz band links,” IEEE Transactions on
Antennas and Propagation, vol. 23, no. 2, pp. 300-301, March 1975.
[3] O. Sasaki, K. Morita, and M. Kikushima, “19-GHz rain attenuation characteristics on four tandem links,” IEEE Transactions on
Antennas and Propagation, vol. 24, no. 2, pp. 216-220, March 1976.
[4] K. Morita and I. Higuti, “Prediction of differential rain attenuation on adjacent microwave and millimeter wave links,” Review of the
Electrical Communication Laboratories, vol. 25, no. 1-2, pp. 96-103, January-February 1977.
[5] J. D. Kanellopoulos and S. G. Koukoulas, “Analysis of the rain outage performance of route diversity systems,” Radio Science, vol. 22, no. 4, pp. 549-565, July-August 1987.
[6] A. D. Panagopoulos and J. D. Kanellopoulos, “Statistics of differential rain attenuation on converging terrestrial propagation paths,”
IEEE Transactions on Antennas and Propagation, vol. 51, no, 9, doi: 10.1109/TAP.2003.816643, pp. 2514-2517, September 2003.
[7] L. A. R. da Silva Mello, E. Costa, and R. S. L. Souza, “Rain attenuation measurements at 15 and 18 GHz,” Electronics Letters, vol. 38, no. 4, doi: 10.1049/el:20020105, pp. 197-198, February 2002.
[8] N. A. Pérez García, L. A. R da Silva Mello, and M. S. Pontes, “Measurements and prediction of differential rain attenuation in convergent links,” Electronics Letters, vol. 41, no. 17, doi: 10.1049/el:20052223, pp. 942-943, August 2005.
[9] F. J. A. Andrade, L. A. R. da Silva Mello, M. S. Pontes, and M. E. C. Rodrigues, Statistical Modeling of Rain Attenuation in Tropical Terrestrial Links, Journal of Microwaves, Optoelectronics and Electromagnetic Applications, Vol. 11, no. 2, pp. 296-303, December 2012.
[10] K. S. Paulson, R. J. Watson, and I. S. Usman, “Diversity improvement estimation from rain radar databases using maximum likelihood estimation,” IEEE Transactions on Antennas and Propagation, vol. 54, no. 1, doi: 10.1109/TAP.2005.861571, pp. 168-174, January 2006.
[11] P. Misme and J. Fimbel, “Détermination théorique et expérimentale de l'affaiblissement par la pluie sur um trajet radioélectrique,”
Annales des Télécommunications, vol. 30, no. 5-6, pp. 149-158, November-December 1975.
[12] L. Stola, “An approach to compute the performance of route diversity systems at frequencies above 10 GHz,” CSELT Rapporti
Tecnici, vol. IX, no. 6, pp. 617-620, December 1981.
[13] Specific Attenuation Model for Rain for Use in Prediction Methods, ITU-R (2005), Recommendation ITU-R P.838-3.
[14] O. Rue, “An improved method for rain attenuation prediction on terrestrial and Earth-space paths,” in Proceedings of the 12th
European Microwave Conference, Helsinki, Finland, October 4-6, 1982, pp. 578-583.
[15] A. Papoulis, Probability, Random Variables, and Stochastic Processes. New York: McGraw-Hill, 1991. [16] J. O’Rourke, Computational Geometry in C. New York: Cambridge University Press, 2005.
[17] J. Goldhirsh and B. Musiani, “Rain cell size statistics derived from radar observations at Wallops island, Virginia,” IEEE
Transactions on Geoscience and Remote Sensing, vol. 24, no. 6, pp. 947-954, November 1986.
[18] C. Capsoni, F. Fedi, C. Magistroni, A. Paraboni, and A. Pawlina, “Data and theory for a new model of the horizontal structure of rain cells for propagation applications,” Radio Science, vol. 22, no. 3, pp. 395-404, May-June 1987.
[19] L. Féral, H. Sauvageot, L. Castanet, and J. Lemorton, “HYCELL – A new hybrid model of the horizontal distribution for propagation studies: 1. Modeling of the rain cell,” Radio Science, vol. 38, no. 3, 1056, doi:10.1029/2002RS002802, pp. 22.1-22.20, May-June 2003.
[20] L. Féral, H. Sauvageot, L. Castanet, and J. Lemorton, “HYCELL – A new hybrid model of the horizontal distribution for propagation studies: 2. Statistical modeling of the rain rate field,” Radio Science, vol. 38, no. 3, 1057, doi:10.1029/2002RS002803, pp. 23.1-23.18, May-June 2003.
[21] Q. W. Pan and G. H. Bryant, “Effective rain-cell diameters and rain-column heights in the tropics,” Electronics Letters, vol. 30, no. 21, pp. 1800-1802, October 1994.
[22] J. L. R. P. de Cerqueira, M. S. Assis, and L. A. R. da Silva Mello, “Spatial structure of rain in the Amazon region,” in Proceedings of
the European Conference on Antennas and Propagation, Nice, France, November 06-10, 2006, CD ESA SP-626 347987jc.pdf.
[23] S. K. Sarkar, M. V. S. N. Prasad, H. N. Dutta, B. M. Reddy, and D. N. Rao, “Rain and extent of rain cells over the Indian subcontinent,” in Proceedings of the 6th International Conference on Antennas and Propagation, Coventry, UK, April 4-7, 1989, vol.
2, pp. 318-321.
[24] E. Matricciani and C. Riva, “The search for the most reliable long-term rain attenuation CDF of a slant path and the impact on prediction models,”IEEE Transactions on Antennas and Propagation, vol. 53, no. 9, doi: 10.1109/TAP.2005.854539, pp. 3075-3079, September 2005.
[25] N. A. Pérez García and L. A. R. da Silva Mello, “Improved method for prediction of rain attenuation in terrestrial links,” Electronics
Letters, vol. 40, no. 11, doi: 10.1049/el:20040464, pp. 683-684, May 2004.
[26] Reference radiation patterns for fixed wireless system antennas for use in coordination studies and interference assessment in the
![Fig. 3. Determination of effective values for the parameters (log d o )and , displayed in the boxed equations in the same order of the respective curves (data corresponding to ECL links adapted from references [1]-[4])](https://thumb-eu.123doks.com/thumbv2/123dok_br/18887911.424270/10.892.111.773.509.895/determination-effective-parameters-displayed-equations-respective-corresponding-references.webp)