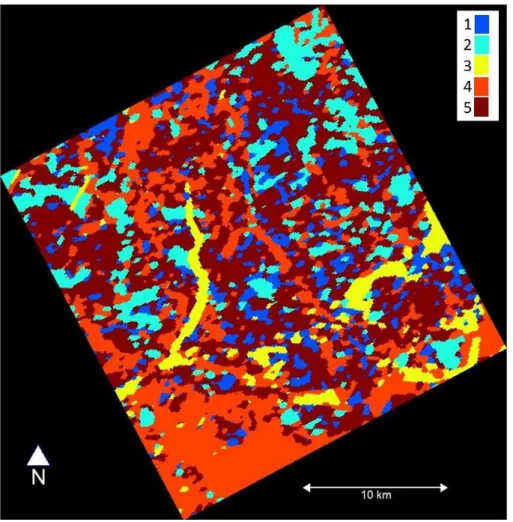
Comparison of automatic segmentation of full polarimetric SAR sea ice images with manually drawn ice charts
Texto
Imagem


Documentos relacionados
The mean values and uncertainties of snow depth and ice and snow densities, determined for FY ice and MY ice, were used to calculate the total error in ice thickness retrieval
ther investigations of surface structure and snow cover on seasonal sea ice in parallel to measurements of driving pa- rameters like heat flux, radiation, ice temperature and
Spectral reflectance of (a) the natural snow surface and (b) bare ice with manually removed snow cover in the study lakes: 1, Lovojärvi; 2, Pääjärvi; 3, Iso Valkjärvi; 4, Peipsi;
To investigate the influence of snow depth, sea ice density, and area on sea ice thick- ness and volume estimates we use freeboard retrievals from ICESat, together with dif-
To establish the extent to which a snow cover will mitigate the albedo e ff ect of black carbon in sea ice two di ff erent Arctic snow types (also described by Grenfell and
Melt No.. It allowed for the assessment of the influence of aluminium added in the quantity falling into the concerned range on both the graphitization of cast iron
The idea of the proposed ice flow estimation method is based on parallax decomposition of two adjacent matched ice-flow features from two images acquired at different
Power demand of the mixer’s drive reveals the mixer’s operating characteristics and reliable monitoring of the mixing processes involving the evaluation of power consumption
