ABSTRACT
This paper presents a computer simulaion model to analyze energy saving in waste recycling. This simula-ion aims to support environmental decissimula-ion-making process especially in regards to issues as agenda set-ing for Environmental Policy and its evaluaion. The proposed model is based on the followset-ing parameters: populaion growth rate, solid waste and recycling rates, gravimetric composiion of the material in the total waste generated, Per capita waste generaion and, electrical energy saving materials. . For modeling and system implementaion the Vensim sotware from Ventana Systems was used. Through the results gener-ated by the model, it is expected that environmental managers will be able to, for example, set incenives to reduce the total generaion of waste and produce campaigns emphasizing reuse and recycling. Model validaion was made through the analysis of future scenarios for a given city in southern Brazil.
Keywords: Computer Simulaion; Municipal Solid Waste; Environmental Management; Waste
Management; Saving Energy; Populaion Growth.
Recebido 06/11/2012 Aceito 29/05/2013
USO DE SYSTEMS DYNAMICS PARA AVALIAÇÃO
DE CENÁRIOS SOBRE A RECICLAGEM DE RESÍDUOS
SÓLIDOS E SEU IMPACTO NA ECONOMIA
DE ENERGIA ELÉTRICA
Recycling using System Dynamics
Eugênio de Oliveira Simoneto1 Nilson Ribeiro Modro2 Luiz Cláudio Dalmolin3
1 Possui graduação em Análise de Sistemas pela Universidade Católica de Pelotas, mestrado em Ciência da Computação pela Poniícia Universidade Católica do Rio Grande do Sul, doutorado em Administração pela Universidade Federal do Rio Grande do Sul e estágio pós-doutoral no PPGTE da Universidade Tecnológica Federal do Paraná. Atualmente é professor adjunto no CTISM e no Programa de Pós-Graduação em Administração da Universidade Federal de Santa Maria – UFSM. Santa Maria, Rio Grande do Sul, Brasil. E-mail: [email protected].
2 Possui graduação em Tecnologia e Processamento de Dados pela Universidade do Estado de Santa Catarina - UDESC, graduação em Ciência da Computação pela Universidade do Sul de Santa Catarina, mestrado e doutorado em Engenharia de Produção pela Universidade Federal de Santa Catarina - UFSC. Atualmente é professor Associado da Universidade do Estado de Santa Catarina – UDESC. São Bento do Sul, Santa Catarina, Brasil. E-mail: [email protected] Doutor em Engenharia da Produção pela Universidade Federal de Santa Catarina (UFSC). Professor do Departamento de Ciências Administraivas da Universidade Federal de Santa Maria (UFSM). Santa Maria, Rio Grande do Sul, Brasil. E-mail: [email protected]
RESUMO
A reciclagem é um tópico de grande importância na gestão integrada dos resíduos, prova disso
é sua importância na Políica Nacional dos Resíduos Sólidos. Nesse arigo apresenta-se um modelo de simulação computacional, desde seu desenvolvimento até sua validação, que tem por objeivo auxiliar gestores ambientais em suas decisões com relação à deinição e/ou manutenção de políicas de reciclagem de resíduos sólidos, bem como avaliar os beneícios do processo no meio ambiente (nesse arigo foi ava-liada a economia de energia elétrica). Para a construção do modelo considerou-se: a taxa de crescimento natural populacional (nascimentos e mortes), percentual de resíduo sólido reciclado (para cada ipo de material), composição gravimétrica do material no total de resíduo gerado, quanidade de resíduos gerada por habitante e a economia de energia elétrica ocasionada por cada ipo disinto de material. Através dos resultados gerados pelo modelo, os usuários inais (gestores ambientais) do mesmo poderão, por exemplo, deinir incenivos à redução da geração total de resíduos sólidos, produzir campanhas valorizando o reuso e a reciclagem e avaliar os beneícios relaivos à economia de energia elétrica ocasionados pela reciclagem. A validação do modelo foi através da análise de cenários futuros para um determinado município da região sul do Brasil. Para a modelagem e execução do sistema foi uilizado o sotware Vensim da Ventana Systems.
Palavras-Chave: Simulação Computacional; Reciclagem de Resíduos; Gestão Ambiental.
1 INTRODUCTION
The evoluion of integrated solid waste management in recent years turned it into an im-portant and criical area for municipal and environmental managers, and general populaion. These developments have also led to new problems to be considered, such as environmental, economic and legal problems. Among them are the results of misuse and waste disposal, which can cause major adverse impacts to the environment, featuring a waste of the material originally used.
In order that the waste generated by populaion and industries be reused, and contribute to reducing the use of natural resources becoming more and more scarce, it is essenial to have accurate and reliable informaion on the physicochemical characterisics of the waste, the amounts generated, collected, as well as its desinaion. Waste recycling is an excellent alternaive in the search of sustainable development in the integrated management of solid waste, for it allows elec-trical energy saving as well as a lower use of natural resources in the producion of steel, aluminum, paper/cardboard, plasic and glass. Another aspect denoing the importance of waste recycling is that it is considered a priority acion by the Brazilian Policy for Solid Waste - PNRS (Ministry, 2011).
The study of integrated management solid waste has catch the atenion of researchers in the area of decision support systems in recent years, because through the use of this tools it is possible to represent a real-world situaion, to study their behavior and take decisions based on the conclusions drawn (Bani et al., 2009). Proof of this are the numerous studies published, which range from the allocaion of vehicles to collect waste (Bhat, 1996; Everet and Shahi, 1997) to build models of environmental impact assessment caused by the disposal of waste, taking into account the disposiion type, the type of waste and the area where it was deposited (Perrodin et al., 2002).
Other authors (Huang et al., 1998; Chang and Wei, 2000; Chang et al., 2008; Cosi et al., 2004; Suian and Bala, 2007; Tanskanen, 2000; Tung and Pinnoi, 2000; Weintraub et al., 1998) have used techniques and methods of decision support systems to develop researches in this speciic area, although these researches are few in Brazil.
evaluated the electrical energy saving achieved with the recycling process of diferent types of recycled materials. To illustrate the energy saving achieved by recycling we can point out alumi-num (Hisatugo and Marçal Jr., 2007): to produce 1 ton from raw material 17.6 Mwh is used, and to produce the same amount, from recycled aluminum only 0.75 Mwh is used, thus generaing saving of 16.85 MWh (95% of electrical energy saving).
For such problem, this research consisted of invesigaion, deiniion and validaion of the variable components of the simulaion model as well as its design and validaion. To develop the computer model, techniques of the system dynamics area were used (Gharajedaghi, 2011; Daellenbach and McNickle, 2005). The use of decision support systems tools seeks to add quality to the decision-making process because, even today, many decisions on solid waste management are based only upon the experience of managers (Chang and Wei, 2000).
The paper is organized as follows: Secion 2 presents the research methodology, as well as the formulaion of the dynamic hypothesis used in the development of this study and de-scribes the problem of modeling, the variable components and the model developed. Secion 3 presents the validaion, the simulaion scenarios, and the experiment using the model as well as the discussion of results. Final consideraions and conclusions are presented in secion 4.
2 MATERIAL AND METHODS
Simon (1990) states that modeling systems can be classiied into two types, predicion and prescripion. Although the fascinaion with predicing the future, which is natural in human beings, ater all it is about its own future, a model that takes the predicion of iming behavior of large systems has no chance of complete success. The modelling with the highest chance of success is the prescripive one. According to Simon (1990) taking the issue raised by the Club of Rome, about the predicion of “nuclear winter”, approaching it as a prescripive problem and not as a predicive problem, would be the most appropriate way, since important issues would arise in order to be answered. What is the populaion that can be maintained on earth in “steady state” with a reasonable standard of living, and what is the steady-state amount of energy pro-duced possible to be maintained without serious damage to the environment.
In this study the research methodology used to develop the computer model was based on the methodology proposed by Law and Kelton (1991) and consisted of the following steps: (1) exploratory studies in scieniic papers, reference manuals and interviews with managers from solid waste area, in which the problem was characterized and structured, as well as the dynamic hypothesis was formulated, which is presented in secion 2.3; (2) developing the soluion, through the construcion of formal models able to describe the problem; (3) computer implementaion of the soluion, using the Vensim simulator (Vensim, 2012) from system dynamics area; (4) soluion validaion, through laboratory and ield tests, to verify if the results are in accordance with the reality observed, as well as through simulaion of an experiment by using three scenarios.
2.1 System Dynamics
The system dynamics method (SD) allows studying the system behavior over ime, so as to permit assessing the consequences of our decisions (Daellenbach and McNickle, 2005). For this reason and the need to study the waste recycling at a future ime horizon it was decided to use it in computer modeling and simulaion. An SD model can be interpreted as the structure resuling from the interacion of policies. This structure consists of two main components, which are the stocks and lows, so that Ford (2009) deines SD as a combinaion of stocks and lows using a computer structure to be simulated. Stocks describe variables that are accumulated and lows work as decision funcions or policies of a system.
These components may be arranged in circular relaionships of cause and efect, known as balance feedbackor reinforcement, and they are subject to ime lags in the system. Suian and Bala (2007) used this approach for modeling the solid waste management system of the city of Dhaka, Bangladesh. Several other authors have also used this method, among which can be cited Abeliois et al. (2009); Dyson and Chang (2005); Kum et al. (2005).
2.2 Waste Recycling
Recycling, according to O’Leary & Walsh (1999), is the process by which the waste in-tended for inal disposal are collected, processed and reused. Monteiro et al. (2001) deines recy-cling as being the separaion of household waste materials such as paper, plasics, glass and ma-terials, in order to bring them back to industry to be beneited. These materials are reprocessed into marketable products.
The recycling of solid waste is an excellent alternaive to provide the preservaion of natural resources, energy saving, reducion of the area demanding the landill, generaion of jobs and income, as well as public awareness for environmental issues. However, for the beter func-ioning, it is very important to implement a wide system of selecive collecion in the ciies, where recyclables MSW (municipal solid waste) be segregated in homes and collected by the municipal selecive collecion system. Despite being a good alternaive for the reducion of waste intended to landills, only a small porion (about 10%) of waste are reused or recycled in the ciies of Rio Grande do Sul, according to CEMPRE (Non-Governmental Organizaion of Business Commitment for Recycling) (Neto, 2001). One of the reasons for such low recycling is the poor packaging waste by populaion, due to the lack of informaion about selecive collecion.
Other factors contribuing to low waste recycling rates is the high cost of selecive col-lecion for municipaliies (O’Leary et al., 1999; Monteiro et al., 2001), as well as the lack of a properly sized system in terms of storage capacity and processing waste at the soring units. But despite the problems faced, ciies are invesing and supporing increasingly waste recycling, ei-ther through selecive collecion or through the construcion of recycling plants, due to the fact of excessive ime in waste decomposiion and to a coninued search for a beter use of these waste (Chang and Wei, 2000).
2.3 Formulaion of Dynamic Hypothesis
The irst one (populaion change) is understood as the most diicult to control, since the place used already grows at a diminuive rate of 0.7% per year, and this rate remained ixed with-in the three scenarios. The current average of waste generaion is 1.223 kg/person (ABRELPE, 2012); in two scenarios this rate was modiied, considering the annual increase (about 1%). In another, the amount of 1.223 kg / person remained staic throughout the simulated ime. As for recycled materials and their recycling rates as well as their paricipaion in the gravimetric com-posiion of solid waste, we used those presented in the Brazilian Plan for Solid Waste (Ministry, 2011). The energy saving rates for each type of recycled material were achieved in technical ari-cles (Hisatugo and Marçal Jr., 2007) and sites of organizaions that work on integrated solid waste management (Waste Management, 2012).
The aim of this step is to formulate a hypothesis to explain the dynamics as a result of the internal structure of the system through the interacion between the variables and the agents represented in the model, including decision rules (Strauss, 2010). Therefore, the dynamic hy-pothesis of the systems dynamics model of this study is deined below as:
- The populaion variaion regarding the amount of waste generated by the component elements of the populaion inluences directly on the total amount of solid waste generated and recycled, inluencing the electrical energy saving resuling from the recycling of aluminum, steel, paper / cardboard , glass and plasic.
3 SIMULATION MODEL AND VARIABLE COMPONENTS
The Brazilian Policy for Solid Waste (PNRS) (Ministry, 2011) deined the order of acions to be followed in waste management, among which was included recycling as one of the main acions. Recycling, under the law, is the process of transforming waste involving change of its physical, physicochemical or biological properies, in order to transform them into inputs or new products. (ABRELPE, 2012)
Associated with the priority given by PNRS, there is a growing generaion of solid waste by the populaion (ABRELPE, 2012), so demanding that viable alternaives to the beter uilizaion of solid waste be created and put into pracice. In this regard, waste recycling becomes a viable alternaive, since in the moment in which material is recycled it does not require space in a landill, it does not pollute the environment and do not use natural resources excessively in its transformaion.
Basing the priority given to recycling by PNRS and the environmental gains incurred, this study aimed to develop a simulaion model that allowed both to environmental managers, as to solid waste recycling area evaluate waste recycling policies referring to recycled materials and environmental gains, aiming at a sustainable development. In the model developed, the recycled materials considered were aluminum, steel, paper / cardboard, glass and plasic.
On the quesion regarding the environmental gains in the model, the electrical energy saving caused by the recycling of such materials was evaluated. Other resources could be evaluated, such as: reducion of the felling of trees, water consumpion reducion, minimizing of use of oil, etc.
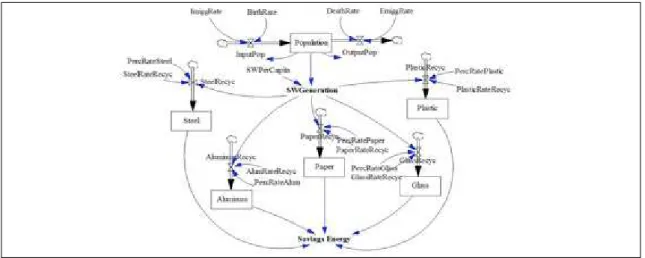
For the deiniion of the simulaion model variables (Figure 1) academic and govern-mental studies form solid waste area were used (ABRELPE, 2012; IBGE, 2010; Kum et al., 2005; Ministry, 2010; Ministry, 2011; Monteiro et al., 2001; UNEP, 2005). The validaion of these vari-ables was made with the paricipaion of environmental managers and professionals from solid waste area. The selected variables and their interrelaionships with other variables, which inlu-ence the total values of generaion and inal disposal of urban solid waste, are:
- The annual birth rate (BirthRate), the annual mortality rate (DeathRate), the annual immigraion rate (ImiggRate) and the annual emigraion rate (EmiggRate), all these directly in-luencing the low of input and output populaion (InputPop and OutputPop), which determine the total populaion (Populaion) of the city. In the model, the natural growth or vegetaive rate was used (total births - total deaths), which corresponds to the only possible way to increase or decrease the world’s populaion and, when it is analyzed the growth of speciic areas should be considered, too, migraion. These variables are represented by equaions (1), (2) and (3) in the mathemaical formulaion of the ordinary diferenial equaions model. (Figure 2)
- The average waste amount (SWPerCapita) generated per capita muliplied by the total populaion results in the total waste amount (SWGeneraion) of the city. The variables described are represented in equaion (4) of the mathemaical model in Figure 2;
- The input streams of recyclable waste in diferent types of recyclable material( Steel-Recyc, AluminumSteel-Recyc, PaperSteel-Recyc, PlasicSteel-Recyc, GlassRecyc), which represent the total annual recyclable solid waste from each of the diferent types of material and are obtained through the product from the total waste amount (SWGeneraion) by the percentage rate of solid waste in total waste generated (gravimetric composiion) and also its product by the material recycling rate under analysis. Equaions (Figure 2) represening the variables on the input streams are de-scribed in the mathemaical model by equaions (5), (6), (7), (8) and (9);
- The total accumulated amount of each type of recycled material is represented by Steel (Steel), Aluminum (Aluminum), Paper (Paper/Cardboard), Plasic (Plasic) and Glass (Glass) var-iable levels. The varvar-iables regarding the cumulaive totals of recyclable waste are described in equaions (10), (11), (12), (13) and (14), in Figure 2;
- The amount of energy saved (SavingEnergy) through the recycling process is obtained by equaion (15) described in Figure 2, which for its calculaion uses data regarding the saving achieved by diferent types of materials, as well as the total generaion of each of them.
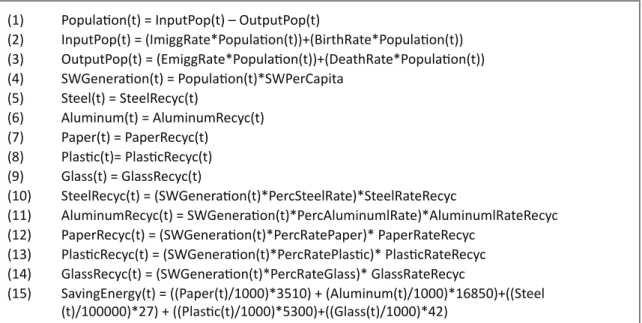
The simulaion model using systems dynamics (Figure 1) and its mathemaical formulaion (Figure 2) help us to understand the variables and their interrelaionships, thus facilitaing the understanding of it.
Figure 1 – Simulaion model developed Source: Authors
(1) Populaion(t) = InputPop(t) – OutputPop(t)
(2) InputPop(t) = (ImiggRate*Populaion(t))+(BirthRate*Populaion(t))
(3) OutputPop(t) = (EmiggRate*Populaion(t))+(DeathRate*Populaion(t))
(4) SWGeneraion(t) = Populaion(t)*SWPerCapita
(5) Steel(t) = SteelRecyc(t)
(6) Aluminum(t) = AluminumRecyc(t)
(7) Paper(t) = PaperRecyc(t)
(8) Plasic(t)= PlasicRecyc(t)
(9) Glass(t) = GlassRecyc(t)
(10) SteelRecyc(t) = (SWGeneraion(t)*PercSteelRate)*SteelRateRecyc
(11) AluminumRecyc(t) = SWGeneraion(t)*PercAluminumlRate)*AluminumlRateRecyc
(12) PaperRecyc(t) = (SWGeneraion(t)*PercRatePaper)* PaperRateRecyc
(13) PlasicRecyc(t) = (SWGeneraion(t)*PercRatePlasic)* PlasicRateRecyc
(14) GlassRecyc(t) = (SWGeneraion(t)*PercRateGlass)* GlassRateRecyc
(15) SavingEnergy(t) = ((Paper(t)/1000)*3510) + (Aluminum(t)/1000)*16850)+((Steel
For the deiniion of the simulaion model variables (Figure 1) academic and govern-mental studies form solid waste area were used (ABRELPE, 2012; IBGE, 2010; Kum et al., 2005; Ministry, 2010; Ministry, 2011; Monteiro et al., 2001; UNEP, 2005). The validaion of these vari-ables was made with the paricipaion of environmental managers and professionals from solid waste area. The selected variables and their interrelaionships with other variables, which inlu-ence the total values of generaion and inal disposal of urban solid waste, are:
- The , the ( ), the
immigraion rate ( and the annual emigraion rate ( , all these directly in-luencing the low of and output populaion ( ), which determine the total populaion (Populaion) of the city. In the model, the natural growth or vegetaive rate was used (total births - total deaths), which corresponds to the only possible way to increase or decrease the world’s populaion and, when it is analyzed the growth of speciic areas should be considered, too, migraion. These variables are represented by equaions (1), (2) and (3) in the mathemaical formulaion of the ordinary diferenial equaions model. (Figure 2)
- The average waste amount ( ) generated per capita muliplied by the total populaion results in the total waste amount (SWGeneraion) of the city. The variables described are represented in equaion (4) of the mathemaical model in Figure 2;
- The input streams of recyclable waste in diferent types of recyclable material
Recyc, AluminumRecyc, PaperRecyc, PlasicRecyc, GlassRecyc, which represent the total annual recyclable solid waste from each of the diferent types of material and are obtained through the product from the total waste amount (SWGeneraion) by
(gravimetric composiion) and also its product by the material recycling rate under analysis. Equaions (Figure 2) represening the variables on the input streams are de-scribed in the mathemaical model by equaions (5), (6), (7), (8) and (9);
- The total accumulated amount of each type of recycled material is represented by Plasic (Plasic) and var-iable levels. The varvar-iables regarding the cumulaive totals of recyclable waste are described in equaions (10), (11), (12), (13) and (14), in Figure 2;
- The amount of energy saved ( ) through the recycling process is obtained by equaion (15) described in Figure 2, which for its calculaion uses data regarding the saving achieved by diferent types of materials, as well as the total generaion of each of them.
The simulaion model using systems dynamics (Figure 1) and its mathemaical formulaion (Figure 2) help us to understand the variables and their interrelaionships, thus facilitaing the understanding of it.
Figure 1 – Simulaion model developed Source: Authors
(1) Populaion(t) = InputPop(t) – OutputPop(t)
(2) InputPop(t) = (ImiggRate*Populaion(t))+(BirthRate*Populaion(t))
(3) OutputPop(t) = (EmiggRate*Populaion(t))+(DeathRate*Populaion(t))
(4) SWGeneraion(t) = Populaion(t)*SWPerCapita
(5) Steel(t) = SteelRecyc(t)
(6) Aluminum(t) = AluminumRecyc(t)
(7) Paper(t) = PaperRecyc(t)
(8) Plasic(t)= PlasicRecyc(t)
(9) Glass(t) = GlassRecyc(t)
(10) SteelRecyc(t) = (SWGeneraion(t)*PercSteelRate)*SteelRateRecyc
(11) AluminumRecyc(t) = SWGeneraion(t)*PercAluminumlRate)*AluminumlRateRecyc
(12) PaperRecyc(t) = (SWGeneraion(t)*PercRatePaper)* PaperRateRecyc
(13) PlasicRecyc(t) = (SWGeneraion(t)*PercRatePlasic)* PlasicRateRecyc
(14) GlassRecyc(t) = (SWGeneraion(t)*PercRateGlass)* GlassRateRecyc
(15) SavingEnergy(t) = ((Paper(t)/1000)*3510) + (Aluminum(t)/1000)*16850)+((Steel
(t)/100000)*27) + ((Plasic(t)/1000)*5300)+((Glass(t)/1000)*42)
3 RESULTS AND DISCUSSIONS
The validaion has been given atenion in several research areas, such as Operaional Research, intelligent systems, and also in decision support systems. Consequently, it is diicult to ind a standard deiniion for “what validaion is.” In this study, we adopted the deiniion given by Pidd (1998), which states that “a model is a representaion of the real world or at least part of it. Therefore, validaion is really straighforward - in principle. All validaion needs to do is to check whether the behavior of the model and the real world occurs under the same condiions. If they do, the model is valid. If they don’t, then the model is not valid. “
For developing of validaion of the simulaion model we used the approach proposed by Finlay (1994) for validaion of decision models and decision support systems (DSS). The approach of Finlay (1994) proposes the validaion of decision models by combining two methods:
Analyical Validaion - Each part of the decision-making model is checked individually and also its integraion with other parts of the system components.
Validaion Synopic - In this type of validaion, the decision-making model is examined as a whole and then the system performance is tested. The validaion is performed by comparing the real world results (outputs) with the model results. If the system produces “acceptable” re-sults in accordance with the supplied inputs, we can say that the system is valid.
In the irst validaion phase, that is, the validaion conceptual problem, the funcional requirements are validated, non-funcional and variable components of the model. In this iniial stage, we used data from scieniic aricles, from the Brazilian Policy for Solid Waste (Ministry, 2011), technical manuals regarding the area of solid waste and, with the paricipaion of spe-cialists in environmental management. In the second validaion phase, when implemening the Vensim simulator (Vensim, 2012), we used historical data on the Brazilian populaion and RSU (urban solid waste) management (ABRELPE, 2012; IBGE, 2002; IBGE, 2010; Ministry, 2011) for the veriicaion individual modules and their integraion with other model component modules (analyical validaion). The results generated by the simulaion model and its compliance with data and results in the real world were also veriied and validated, relecing the correctness of
the model (synopic validaion). In both phases the results met the expectaions of simulaion projectors and experts (environmental managers).
In the subsequent validaion phase, for the experiment construcion, data and real rates (populaion, populaion growth and data on solid waste management), of a city of Rio Grande do Sul, were used.
For such, we generated two (2) scenarios to be simulated in the model: (a) Current sce-nario with varying current rates and (b) posiive scesce-nario, which is based on increasing rates of waste recycling and staic maintenance rate of solid waste generaion by populaion. This type of validaion can be recognized as a sensiivity analysis of the simulaion model, since the variables were used in inputs and changes in results were checked. The detailing and quanifying rates for
each simulated scenario are presented below in subsecion 4.1.
3.1 Scenarios simulated in the model
To best describe the scenarios simulated in Table 1 are presented the basic rates for the populaion growth, the waste generaion, the gravimetric composiion of recycled materials in the total waste generated, and the recycling rate for each material analyzed by the model. To obtain such data the Populaion Census (IBGE, 2010), the Overview on Solid Waste in Brazil-2011 (ABRELPE, 2012) and the Brazilian Policy for Solid Waste (Ministry, 2011) were analyzed. The sce-narios generated were conceived by the researchers, with the aid of environmental managers.
Table 1 – Base rates considered in the simulaion
Populaion Growth We considered current birth and death rates, where the average
pop-ulaion growth in a city in Rio Grande do Sul was 0.7% (Ibge 2010).
Waste Generaion The average of daily urban waste generaion is approximately 1,223
kg/person (Abrelpe 2012). The annual generaion evoluion is 2%. Gravimetric Material
Composi-ion in the Waste Generated Rates were achieved in (Ministry 2011):Steel – corresponds to 2.3% of solid waste generated. Aluminum – corresponds to 0.6% of solid waste generated.
Paper / Cardboard – corresponds to 13.1% of solid waste generated. Plasic- corresponds to 19% of solid waste generated.
Glass – corresponds to 2.4% of solid waste generated.
Recycling Rate for Material Rates were achieved in (Ministry 2011):
Steel – 35% of the recycled steel are collected.
Aluminum – 36% of the aluminum collected are recycled. Paper / Cardboard – 43% of the paper collected are recycled. Plásico- 19% of the plasic collected are recycled.
Glass – 21% of the glass collected are recycled.
Energy Saving by Recycling Rates were achieved in (Garbelini et al. 2011; Hisatugo and Marçal Jr
2007; Waste Management 2012): Steel – 27 Kwh /100 t.
Aluminum – 16850 Kwh / t. Paper / Cardboard – 3510 Kwh / t. Plasic – 5300 KWh / t.
Glass – 42 Kwh / t.
Posiive Scenario
In designing the posiive scenario, increasing rates of the recycling of the materials ana-lyzed and their gravimetric composiion in total waste generated were simulated, however, the
per capita generaion rate of solid waste remained staic. Populaion growth was maintained for
the purposes of this simulated scenario. The scenario descripion can be seen in Table 2.
Table 2 – Rates used in the simulaion with a posiive scenario
Populaion Growth We considered current birth and death rates of the city analyzed.
Waste Generaion In this scenario, the generaion rate remained staic unil the end of the
ime simulated and the annual evoluion rate of 2% was not considered. Gravimetric Material
Composi-ion in the Waste Generated In this scenario, we considered an increase of 30% of the gravimetric composiion for the past ten years simulated (20° to 30°).
Recycling Rate for Material In this scenario, we considered an increase of 30% in the recycling
rate for each material in the irst ten years simulated. From the 11th year to 30th year we considered an increase of 50% in the recycling rate for each type of material.
Source: Authors
Current Scenario
In the current scenario the recycling rates of populaion growth and the waste genera-ion per capita were considered, but the gravimetric composiion remained staic, and it was
con-sidered a small increase in levels of material recycling. The scenario details can be seen in Table 3.
Table 3 – Rates used in a simulaion with a current scenario
Populaion Growth We considered current birth and death rates of the city analyzed.
Waste Generaion In this scenario we considered an annual evoluion of 2% in the
gen-eraion rate. Gravimetric Material
Composi-ion in the Waste Generated In this scenario, the gravimetric composiion index of the recycled materials regarding solid waste generaion remained unchanged.
Recycling Rate for Material In this scenario, we considered an increase of 0.3% in recycling rates
(per year) for each type of recycled material. Source: Authors
3.2 Experiment
Once the scenarios for the experiment using the model were deined, simulaions were per-formed. As described earlier, the data used in both scenarios were a city with about 265,000 inhab-itants in Rio Grande do Sul, which has selecive collecion of solid waste, as well as screening units aiming at solid waste recycling. The other rates were obtained in technical documents, as can be seen above in secion 4.1. The simulated ime horizon of the study was 30 (thirty) years, but seing this variable is responsibility of managers (potenial end users) and / or the simulaion projectors.
In performing the simulaions we used the Vensim simulator (Vensim, 2012) in a com-puter framework with Intel Core (i5 2450) 2.5 Ghz, 4 Gb of RAM and the runime simulaion of
3.3 Results Achieved
With the implementaion of the model, the results generated are several, but the aricle will discuss aspects regarding the amount of waste recycled in relaion to the total generaion of solid waste, as well as those related to electrical energy saving generated by waste recycling.
First of all, it will be analyzed the amount of waste recycled in both scenarios; for such, it was considered the last years simulated in the model, that is, 30th year. In this analysis there is
a high rate of recycling caused by the posiive scenario, where it reaches the mark of 27.33% of waste generated recycling (42,670 tonnes). In this same analysis, the current scenario reaches an 11.76% rate of waste generated recycling (24,503 tonnes), which shows a growth of 9.3% to the current recycling rate (about 10.7%). The results generated, and the detailment of the simulated amount for each waste can be seen in Table 4.
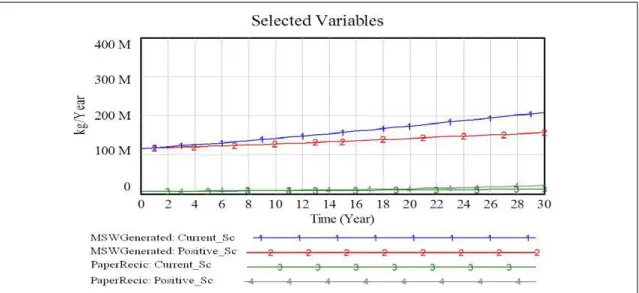
The posiive scenario with a recycling rate of 27.33% provides an excellent growth of 153% if related to the current recycling rate, but with all this growth, this rate is sill lower than that recorded in many European countries. For example, the Netherlands has a percentage of 32% of waste recycling (EUROSTAT, 2011). To demonstrate how small is the amount of waste recycled in Brazil, a comparaive chart between the paper / cardboard recycling (waste of greatest recycling rate) with the total waste generaion throughout the simulated period is presented in Figure 3. At the end of the simulated ime, in the posiive scenario, the paper recycling rate was 14.28% (22,203 tonnes), while in the current scenario the recycling rate was 6.14% (12, 800 tonnes).
Figure 3 – Relaion between the amount of recycled paper and the total waste generated Source: Authors
Table 4 – Results of scenarios in the latest simulated year and the relaion to the total generated waste
Current Scenario (Year 30) Posiive Scenario (Year 30)
Material Recycled Amount Relaion Total Generaion Recycled Amount Relaion Total Generaion
Steel 1,830,390 kg 0.88% 3,196,550 kg 2.05%
Aluminum 489,992 kg 0.24% 876,769 kg 0.56%
Paper/Cardboard 12,799,600 kg 6.14% 22,293,400 kg 14.28%
Plasic 8,233,200 kg 3.95% 14,306,400 kg 9.16%
Glass 1,149,980 kg 0.55% 1.997.090 kg 1.28%
TOTAL 24,503,162 kg 11.76% 42,670,209 kg 27.33%
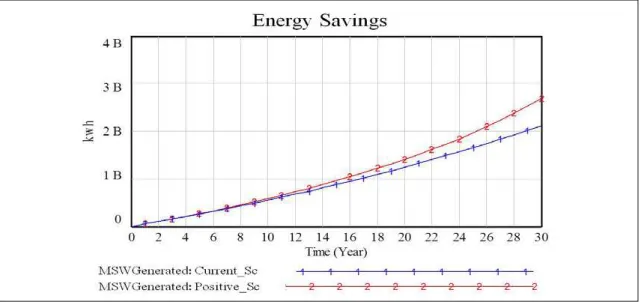
Another analysis performed on the simulaion model was the amount of electricity saved over the thirty years simulated, according to the results presented (Garbelini et al., 2011; Hisatugo and Marçal Jr., 2007; Waste Management, 2012 ) for each material analyzed. In this analysis the beneits of recycling solid waste to the environment and the conservaion of natural resources are clear, for example, the posiive scenario gets a monthly average saving of 7,500 MWh, and in the current scenario, a monthly saving of 5,800 Mwh. These values are considered as excellent, for the total approximated consumpion of a city the size of the analyzed one is 82,000 MWh / month (CEEE, 2012), therefore, it is esimated in the posiive scenario an electrical energy saving of 9.1% per month and in the current scenario a saving of 7%. Figure 4 shows the total cumulaive of electrical energy in the simulated years, where it is noiced that for the posi-ive scenario the value is 2,694,280 MWh and 2,108,060 MWh for the current scenario.
Figure 4 – Electrical energy saving throughout 30 years. Source: Authors
4 CONCLUSIONS
The aim of this paper was to present the development, the validaion and the use of a computer simulaion model to aid environmental managers in the decision-making process, regarding solid waste recycling policies. To develop the model we used variables such as the populaion growth rate (births and deaths), percentage of solid waste recycled (for each type of material), gravimetric composiion of the material in the total waste generated, the amount of waste generated per capita and electrical energy saving caused by each diferent type of material
in a given period of ime (which, in the model developed can vary from minutes to years). Through the results generated by the model, end users (environmental managers) will be able to, for example, set incenives to reduce the total solid waste generaion, incenives to increase rates of green consumpion, produce campaigns emphasizing reuse and recycling of materials and evaluate the beneits regarding electrical energy saving provided by recycling.
Regarding the results produced by the model, we highlight the posiive scenario, be-cause it sought to portray a proile of people concerned about environmental issues, that is, about generaing less solid waste, increasing the amount of potenially recyclable waste and recycling rates. In this analysis, the amount of recycled waste would have an increase of 153% compared to current standards. As for the current scenario, the amount of waste recycled at the end of the simulated ime would grow by 9.3%. Despite all the growth caused by the posiive scenario, with a recycling rate of about 27%, it is below the European community countries, such as Germany, Belgium, Sweden, Holland and Ireland, which present rates upper to 30% of solid waste generated recycling.
As for energy savings, despite the posiive scenario generates a higher saving (7500 MWh / month), the current standards (current scenario) show a considerable possibility of reduc-ion of 5,800 MWh / month, which demonstrates the vital importance of recycling solid waste in search for sustainable development and in the Brazilian Policy for Solid Waste.
REFERENCES
Abeliois, K, Karaiskou K, Togia A, Lasaridi K (2009). Decision Support Systems in Solid Waste Management: A Case Study at the Naional and Local Level in Greece. Global NEST J. 11(2): 117-126.
ABRELPE – Brazilian Associaion of Special Waste and Public Cleaning (2012). Overview of Solid Waste in Brazil – 2011, ABRELPE, São Paulo. (In Portuguese).
Bani MS, Rashid ZA, Hamid KHK, Harbawi ME, Alias AB, Aris MJ (2009). The Development of Decision Support System for Waste Management; a Review, World Academy of Science, Eng. Technol. 49: 161-168.
Bhat VN (1996). A model for the opimal allocaion of trucks for the solid waste management. Waste Management & Research. 14: 87-96.
CEEE. State Company for Electric Power (2012). Energeic balance of 2011. Available at: htp:// www.ceee.com.br/pportal/ceee/component/ Controller.aspx?CC=46490. (Accessed in 14 August 2012). (In Portuguese).
Chang N, Parvathinathan G, Breeden JB (2008). Combining GIS with fuzzy mulicriteria decision-making for landill siing in a fast growing urban region. Journal of Environmental Manage. 87: 139-153.
Chang N, Wei Y (2000). Siing recycling drop-of in urban area by geneic algorithm-based fuzzy muliobjecive nonlinear integer programming modeling, Fuzzy Sets and Syst. 114: 133-149. Cosi P, Minciardi R, Robba M, Rovai M, Sacile R (2004). An environmentally sustainable decision model for urban solid waste management. Waste Manage. 24(3): 277-295. Daellenbach HG, McNickle DC (2005). Decision making through systems thinking. Palgrave MacMillan, New York.
Dyson B, Chang NB (2005). Forecasing municipal solid waste generaion in a fast-growing urban region with system dynamics modeling. Waste Manage. 25(7): 669-679. EUROSTAT- European Commission Staisical (2011). Environment in the EU27 - Recycling accounted for a quarter of total municipal waste treated in 2009. Available at: htp://epp. eurostat.ec.europa.eu/cache/ITY_PUBLIC/8-08032011-AP/EN/8-08032011-AP-EN.PDF. (Accessed in 07 June 2011).
Everet JW, Shahi S (1997). Vehicle and labor requirements for yard waste collecion. Waste Management & Res. 15: 627-640.
Finlay PN (1994). Introducing decision support systems. Blackwell Publishers, Oxford.
Ford A (2009). Modeling the Environment. Island Press.
Garbelini SM, Borges DM, Silva RC. (2011). Pracise Selecive Collecion. Public Prosecuion Service of Goiás. (In Portuguese).
Gharajedaghi J (2011). Systems thinking: managing chaos and complexity, 3rd. Ed.,
Elsevier, Burlington.
Hisatugo E, Marçal Jr. O (2007). Selecive Collecion and Recycling as Tools for Environmental Conservaion: A Case Study in Uberlândia – MG. Sociedade & Natureza 19(2): 205-216. (In Portuguese).
Huang GH, Baetz BW, Patry GG (1998). Trash-Flow Allocaion: Planning Under Uncertainty, Interfaces 28(6): 36-55.
IBGE a. Brazilian Insitute of Geography and Staisics (2002). Naional Survey of Basic Sanitaion. Available at: htp://www. ibge.gov.br/home/estatistica/populacao/ condicaodevida/pnsb/pnsb.pdf. (Accessed in 12 June 2011). (In Portuguese).
http://www.ibge.gov.br/home/download/ estaisica.shtm. (Accessed in 12 June 2011). (In Portuguese).
Kum V, Sharp A, Harnpornchai N (2005). A System Dynamics Study of Solid Waste Recovery Policies in Phnom Penh City. The 23rd Internaional Conference of the System
Dynamics Society, Boston. Proceedings... Boston: SDS.
Law AM, Kelton WD (1991). Simulaion Modeling & Analysis. 2a Ed., McGraw-Hill, New
York.
Mansvelt J (2010). Green Consumerism: An A-to-Z Guide. SAGE Publicaions.
Ministry of Ciies - Department of Naional Environmental Sanitaion (2010). Naional Informaion System on Sanitaion: Diagnosic management of municipal solid waste - 2008. MinisterioCidades, Brasília. (In Portuguese). Ministry of Environment (2011). Brazilian Policy for Solid Waste. MinisterioMeioAmbiente (MMA), Brasília. (In Portuguese).
Monteiro JHP et al. (2001). Handbook for Integrated Management of Solid Waste, Brazilian Insitute of Municipal Administraion, Rio de Janeiro. (In Portuguese).
Neto A (2001). The Wasteful Waste. Zero Hora Newspaper, Edited in 09 September 2001, p.32. (In Portuguese).
O’Leary PR, Walsh P (1999). Decision Maker’s Guide to Solid Waste Management. Vol. 2, U.S. Environmental Protecion Agency, Washington DC.
Perrodin Y, Gobbey A, Grellier-Volaier L, Canivet V, Fruget JF, Gilbert J, Texier C, Cluzeau D, Gros RL, Poly F, Jocteur-Monrozier L (2002). Waste ecocompaibility in storage and reuse scenarios: global methodology and detailed presentaion of the impact study on the recipient environments. Waste Manage. 22:215-228.
Pidd M (1998). Computer Simulaion in Management Science. John Willey.
Silva ECP (2006). The impact of management on the size of the police force in the rate of violence in Curiiba: A qualitaive approach under the reference of system dynamics. Dissertaion (Master of Science in Product and System Engineering) - Poniical Catholic University of Paraná, 2006. (In Portuguese). Simon HA (1990). Predicion and prescripion in systems modeling. Operaions Research, 38: 7-14.
Straus LM. A system dynamics model for higher educaion (2010). Dissertaion (Master of Science in Management Science) – Federal University of Rio Grande do Sul. (In Portuguese). Suian MA, Bala BK (2007). Modeling of urban solid waste management system: The case of Dhaka city, Waste Management. 27(7): 858-868.
Tanskanen JH (2000). Strategic planning of municipal solid waste management. Resourc. Conserv. and Recycl. 30: 111-133.
Tung DV, Pinnoi A (2000) Vehicle rouing-scheduling for waste collecion in Hanoi, Eur. J. Oper. Res. 125: 449-468.
UNEP - United Naions Environment Programme. (2005). Solid Waste Management, Vol.1, CalRecovery Inc, New York.
Ventana Systems (2012). Vensim Simulaion Sotware. Available at: htp://www.vensim. com. (Accessed in 14 August 2012).
Waste Management (2012). Recycling Facts and Tips. Available at: tp://sacramentovalley. wm.com/recyclingfacts.asp. (Accessed in 05 August 2012).