Image Classification through integrated K- Means
Algorithm
Balasubramanian Subbiah1 and Seldev Christopher. C2
1
Department of Information and Communications Engineering, Anna University of Technology, Tirunelveli, Tamil Nadu 627 007, India
2
Department of Information and Communications Engineering, Anna University of Technology, Tirunelveli, Tamil Nadu 627 007, India
Abstract
Image Classification has a significant role in the field of medical diagnosis as well as mining analysis and is even used for cancer diagnosis in the recent years. Clustering analysis is a valuable and useful tool for image classification and object diagnosis. A variety of clustering algorithms are available and still this is a topic of interest in the image processing field. However, these clustering algorithms are confronted with difficulties in meeting the optimum quality requirements, automation and robustness requirements. In this paper, we propose two clustering algorithm combinations with integration of K-Means algorithm that can tackle some of these problems. Comparison study is made between these two novel combination algorithms. The experimental results demonstrate that the proposed algorithms are very effective in producing desired clusters of the given data sets as well as diagnosis. These algorithms are very much useful for image classification as well as extraction of objects.
Keywords: Clustering algorithm, Image classification, Road extraction, Image segmentation.
1. Introduction
Clustering is a process which separate a given dataset into homogeneous groups based on specific requirements. The similar objects are kept in a group whereas dissimilar objects are in different groups. Clustering plays an important role in various fields including image processing, mobile communication, computational biology, medicine and economics. The main objective of this paper is to provide a segmentation algorithm which will be used in image classification tool in an effective manner. Another objective is pattern recognition. Edge detection is having a significant role in pattern recognition. We have combined the successful clustering algorithm called K-Means clustering algorithm with the edge detection
algorithms like LoG filter and Prewitt filter. The images used for this purpose are both satellite images [1, 2] and synthetic datasets. The image is classified with the Means algorithm and Log Filter combination as well as K-Means algorithm and Prewitt filter combination.
Image classification includes two steps: a) Segmentation step
b) Classification step
Motivated with this, we propose, in this paper, the image segmentation and classification done using K-Means and Laplacian of Gaussian filters or Prewitt Filter. Our algorithm has no specific requirement of prior knowledge of any parameters and the mathematical details of the data sets. We have tested our algorithm on number of synthetic dataset as well as real world dataset. The experimental results are shown in section IV for visual judgment of the performance of the proposed algorithm. We have used known data sets as well as some real world data sets for the testing.
The manuscript is organized as follows. We have explained the concept of K-Means algorithm, LoG filter and Prewitt filter in section 2. The proposed integrated algorithm is presented in section 3. The experimental results for visual judgment are shown in section 4 followed by the conclusion in section 5.
2. Terminologies
2.1 K – Means Algorithm
pixels in the feature space, each of them defined by its center. Initially each pixel in the image is allocated to the nearest cluster. Then the new centers are computed with the new clusters. These steps are repeated until convergence. Basically we need to determine the number of clusters K first. Then the centroid will be assumed for these clusters. We could assume random objects as the initial centroids or the first K objects in sequence could also serve as the initial centroids.
The K means algorithm in a logical representation: Execute the below steps until convergence.
Do the following while no object move group.
a) Determine the centroid coordinate (Random assignment).
b) Determine the distance of each Object pixel to the Centroids.
c) Group the object based on minimum distance with the Centroid.
2.2 Laplacian of Gaussian (LoG) filter
A 2-D isotropic measure of the 2nd spatial derivative of an image is called as Laplacian. The Laplacian of an image showcase the regions of rapid intensity change. For this specific property this algorithm is popularly used for edge detection. For example in zero crossing edge detectors, this algorithm is well placed. We need to pre format the image in order to reduce its sensitivity to noise. The image is smoothed by approximating a Gaussian smoothing filter.
Fig. 2.1: 3D Filter preview
That’s why the name is Laplacian of Gaussian filter (LoG), which is a combination of a Laplacian and Gaussian filter. The characteristic are determined by the s parameter and the kernel size as shown in the mathematical expression of the kernel as shown below:
… Eqn. 2.1
Find the fig 2.1 "3D Filter Preview" in the Output Options. The shape of the kernel could be monitored in 3D while modifying the kernel parameters:
Because of the kernel shape Laplacian of Gaussian filters are also called as Mexican hat filters.
The kernel size should be selected large enough to accommodate the negative values. This could positively impact the Gaussian smoothing filter.
2.3 Prewitt Filter
The Prewitt Filter is another well known edge detection filter uses two 3X 3 kernels. One kernel is used for the changes in the horizontal direction and another kernel is for the changes in the vertical direction. Assume Gx and Gy as two images that contain the horizontal and vertical derivative approximations respectively. The computations are:
Gx = and Gy =
… Eqn. 2.2
Where: I is the original source image.
The X and Y coordinates are defined as increasing in the right-direction and the down-direction respectively. Gx and Gy are computed by moving the appropriate kernel (window) over the input image. Simply computing the value for one pixel and then shifting one pixel to the right and once the end of the row is reached, then move down to the beginning of the next row.
3. Proposed Algorithm
The basic principle of the proposed algorithm is integrating the K-Means algorithm with LoG filter and Prewitt filter as follows.
Algorithm: 1
Step 1: Read the RGB Image available for classification.
Step 2: Convert available image from RGB color space to L*a*b* color Space
Step 3: Classify the colors in 'a*b*' space using K-means clustering algorithm
Step 4: Label every pixel of the image using the results from K-means algorithm
Step 6: Segment the nuclei of the image into a separate image
Step 7: The Laplacian of Gaussian filter finds edges by looking for zero crossings.
Algorithm: 2
Step 1: Do the Step 1 to 6 proposed in the algorithm 1 Step 2: Prewitt Filter finds edges by looking for zero crossings.
The proposed algorithms consist of two phases. In the first phase, we construct the clusters using the K-Means algorithm. If k and d are fixed as per the algorithm, the problem can be exactly solved in time O (ndk+1 log n), where n is the number of entities to be clustered. In the second phase we find the classified image by the way of filtering the clusters through a Laplacian and Gaussian filter or through a Prewitt Filter.
Laplacian of Gaussian:
A 2-D isotropic measure of the 2nd spatial derivative of an image is called as Laplacian. The Laplacian of an image showcase the regions of rapid intensity change. For this specific property this algorithm is popularly used for edge detection. For example in zero crossing edge detectors, this algorithm is well placed. We need to pre format the image in order to reduce its sensitivity to noise. The image is smoothed by approximating a Gaussian smoothing filter..
The Laplacian L(x, y) of the given image with pixel intensity values I(x, y) is as provided below:
… Eqn. 3.1
The input image is represented as set of discrete pixels. The discrete convolution kernel could be identified by approximating the second derivatives as per the definition of the Laplacian. Three commonly used small kernels are shown as in Figure 3.1.
0 1 0 1 -4 1 0 1 0
1 1 1 1 -8 1 1 1 1
-1 2 -1 2 -4 2 -1 2 -1
Figure 3.1 Three commonly used discrete approximations to the Laplacian filter.
The kernels are very much sensitive to noise since they are approximating to a second derivative measurement on the image. To overcome this, the images are smoothed with Gaussian filter before applying the Laplacian filter. While smoothing the noise components are removed as much as possible. This mainly eliminates the high frequency noise components.
Gaussian smoothing filter will be convolved with the Laplacian filter, and then convolve this hybrid filter with the given image to achieve the required result for the following advantages.
This method requires far fewer arithmetic operations and only one convolution needs to be performed at run-time on the image.
The 2-D LoG function centered at zero with Gaussian standard deviation σ as shown below:
… Eqn. 3.2 and is shown in Figure 3.2.
Fig. 3.2: LoG function centered at zero with Gaussian standard deviation σ
0 1 1 2 2 2 1 1 0
1 2 4 5 5 5 4 2 1
1 4 5 3 0 3 5 4 1
2 5 3 -12 -24 -12 3 5 2
2 5 0 -24 -40 -24 0 5 2
2 5 3 -12 -24 -12 3 5 2
1 4 5 3 0 3 5 4 1
1 2 4 5 5 5 4 2 1
Fig. 3.3 Discrete approximation to LoG function with Gaussian σ = 1.4
Prewitt Filter
The Prewitt Filter is another well known edge detection filter uses two 3X 3 kernels. One kernel is used for the changes in the horizontal direction and another kernel is for the changes in the vertical direction.
The below example shows the calculation of the value Gx:
a1 1
a1 2
a1 3
…
a2 1
a2 2
a2 3
…
a3 1
a3 2
a3 3
…
… … … …
Fig. 3.4: Input Image
Kernel =
1 0 -1
1 0 -1
1 0 -1
b1 1
b12 b1 3
…
b2 1
b2 2
b2 3
…
b3 1
b32 b3 3
…
… … … …
Fig. 3.5: Output image (Gx)
b22 = -a11+a13+a21+a23+a31+a33 … Eqn. 3.3
4. Experimental Results
We have tested our algorithm using MATLAB 7. The experiments were performed on a Intel Core 2 Duo Processor machine with T9400 chipset, 2.53 GHz CPU
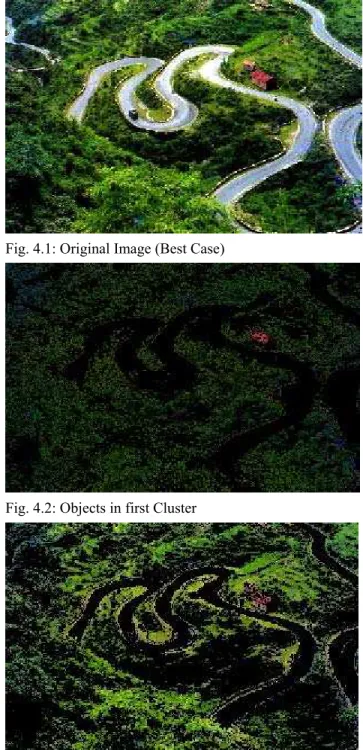
and 2 GB RAM running on the platform Microsoft Windows Vista. To investigate, we first run the K Means algorithm and the input image with region of interest is divided into various clusters as shown in fig 4.2, fig 4.3 and fig 4.4. Then the clusters are passed through a LoG filter and the resultant image shown in fig 4.6. The segmented clusters through K-Means algorithm then passed through the Prewitt filter and the resultant image is shown in fig 4.5. The outputs from LoG and Prewitt filters are compared.
Fig. 4.1: Original Image (Best Case)
Fig. 4.2: Objects in first Cluster
Fig. 4.4: Objects in third cluster
Fig. 4.5: Output of Prewitt Filter (Extracted Road)
Fig. 4.6: Output of LoG Filter (Extracted Road)
The same experiments are conducted with the satellite images and the results are provided below with descriptions. The comparison study is also done between these two algorithm combinations. The above results i.e. with the synthetic images shows the best case scenario and the below results shows the worst case scenario with the poor satellite images.
Fig. 4.7: Original Satellite Image (Worst Case)
Fig. 4.8: Objects in first Cluster
Fig. 4.10: Objects in third Cluster
Fig. 4.11: LoG Filter output (Extracted Road)
Fig. 4.12: Prewitt Filter output (Extracted Road)
5. Conclusions
In this paper, we have combined K Means algorithm with Laplacian of Gaussian algorithm and compared that with the combination of K Means algorithm with Prewitt Filter. The integrated novel clustering algorithms for image classification are tested with different images including satellite images. We found that the later is performing well compared to the earlier. These algorithms are robust and very effective in producing
desired classifications especially in the field of pattern recognition as per the region of interest as demonstrated by the experimental results.
In future different neural network algorithms can be used to classify the satellite images instead of Prewitt and LoG filters in the above novel algorithm and the classification results of those will be compared with the existing algorithms.
Acknowledgments
We take this opportunity with much pleasure to thank the Management and Faculty members of St. Xavier’s Catholic College of Engineering, Chungankadai, Nagercoil, Tamilnadu for supporting this work.
References
[1] Flayed Sabine and W.H.Freeman, “Remote sensing, Principles and Interpretation”.
[2] S.N. Sivanandam & Sumathi & S. N. Deepa, “Introduction to Neural Networks using Matlab 6.0”. [3] K. Mumtaz and Dr. K. Duraiswamy, “A Novel Density
based improved k-means Clustering Algorithm – Dbkmeans” International Journal on Computer Science and Engineering ISSN : 0975-3397 213; Vol. 02, No. 02, 2010, 213-218
[4] Madjid Khalilian, Norwati Mustapha, MD Nasir Suliman, MD Ali Mamat “A Novel K-Means Based Clustering Algorithm for High Dimensional Data Sets ” International Multi Conference of Engineers and Computer Scientists 2010 Vol I, IMECS 2010, March 17-19, Hong Kong
[5] Baldacci, R., Hadjiconstantinou, E., and Mingozzi, A. An exact algorithm for the capacitated vehicle routing problem based on a two commodity network flow formulation. Operations Research, 52(5):723–738, 2004.
[6] Chaves, A. A., de Assis Correa, F., and Lorena, L. A. N. Clustering search heuristic for the capacitated p-median problem. Advances in Software Computing Series (Springer), pages 136– 143, 2007.
[7] Franca, P. M., Sosa, N. M., and Pureza, V. An adaptive tabu search algorithm for the capacitated clustering problem. International Transactions in Operational Research, 6:665–678, 2006.
[8] Milan Sonka, Vaclav Lavaca &Roger Bole, “Image Processing, analysis and Machine Vision”.
[9] William Pratt, “Digital Image Processing”.
[10]Rafael C. Gonzalez & Richard E.Woods, “Digital Image Processing”.
[11]Rui Xu and Donald Wunsch, “Survey of Clustering Algorithms”, IEEE, Vol. 16, No.3, pp.645-678, May 2005.
Development method”, IEEE, Vol. 16, No.3 pp.601-616, May 2005.
[13]G. Dong & M. Xie, “Color Clustering & Learning for Image Segmentation Based on Neural Networks”, IEEE, Vol. 16, No. 4, Pp.925- 936.
[14]Xiao yang Tan, Song can Chen & Zhizhou,” Recognizing partially. Occluded Expression Variant Faces from Single Training Image per Person with SOM & soft K-NN Ensemble,” IEEE Trans. Pattern Anal. Vol.16, No. k4, pp.875-855, July 2005.
[15]P.D.Deshpande, “Survey of Satellite Image Segmentation and Classification”, NCETE2006, MAE, Alandi (D), Pune.
[16]http://www.rst.gsfc.nasa.gov [17]http://www.remotesensing.org [18]http://www.rst.gfsc.nasa.gov/front [19]http://www.mathtools.com
[20]http://www.imageprocessingplace .com [21]http://www.ccrs.nrcan.gc.ca/ccrs/learn/ [22]tutorials/fundam/fundam-e.html [23]http://www.nrsa.gov.in
Balasubramanian Subbiah is doing his Doctorate in Philosophy research works at Anna University, Tirunelveli, India. He obtained Master of Engineering in Applied Electronics from Sathyabama Institute of Science and Technology, Chennai, India in the year 2005 and Bachelor of Engineering in Electronics and Communication Engineering from Jayamatha Engineering College, Aralvoimozhi, India in the year 2000. He achieved his Masters in Business Administration in Systems from Madurai Kamaraj University, in 2008. He has eleven years of experience and his area of interest includes Digital Image Processing, Communication System, Digital Signal Processing and Mainframes. He is a Member of Institute of Electrical & Electronics Engineers (IEEE), USA and Project Management Institute, USA. He is holding 43 International Certifications in various technologies.
Dr. C.SELDEV CHRISTOPHER works as Professor in the