DOI: 10.5935/2359-4802.20170059
Abstract
The article aimed to critically analyse studies which evaluated the capacity of anthropometric and clinical indicators to predict MetS in the elderly. Bibliographical research was performed using the electronic databasese Medline/PubMed, LILACS e SciELO , references from selected articles and contact with several authors. Twenty one articles involving anthropometric and clinical indicators in the elderly were analysed, using different MS criteria. Fourteen studies report anthropometric indicators, being the waist circumference (WC) and waist-to-height ratio (WHtR), described as the best MS predictors, with the area under the ROC curve (AUC) over 0.70 (p < 0.05). The neck circumference was also described as an alternative indicator but with less discriminatory power. Lipid accumulation product (LAP) was the parameter with the best performance to identify MS, with an AUC over 0.85 and eficiency greater than 70%. The WC, WHtR and LAP indicators were the most sensitive for predicting MS. The use of these parameters may facilitate the early identiication of MS, with good accuracy and low cost. In addition, it is important to determine speciic cutoff points for the elderly, since obesity alone does not appear to be a strong predictor of MS in the elderly.
Introduction
Metabolic syndrome (MetS) is defined as a set of risk factors that includes resistance to insulin, dyslipidemia, abdominal obesity and high blood
pressure, and increases the risk of cardiovascular diseases and diabetes.1,2 The most up-to-date criteria to
define MetS were prepared by the International Diabetes Federation (IDF) task force.2 In their guidelines, it has
been established that abdominal obesity is no longer a compulsory component, and specific cut-off points should be used to classify waist circumference (WC) by ethnic groups, in addition to criteria for changes in glucose and lipid metabolism and high blood pressure.2
The use of clinical and anthropometric indicators can help to identify the presence of MetS.3-5 Clinical indicators
are those which associate biochemical parameters to analysis measurements, particularly the lipid accumulation product (LAP) and visceral adiposity index (VAI).3,4 Anthropometric indicators include body mass
index (BMI), WC, hip ratio (WHR), waist-to-height ratio (WHtR), the sagittal abdominal indicator (SAD) and neck circumference (NC).5,6
The use of indicators to predict MetS may facilitate its identification in clinical practice, as they are simple, quick and functional. However, there is no consensus on the best indicator able to identify MetS in the elderly due to different functional characteristics and varied cut-off points, many of which are specific to young adults, and with different criteria for defining MetS.1,2 Nevertheless,
early identification of MetS is important in this age group since it may assist health teams to decide on strategies aimed at reducing global cardiovascular risk.1
This review aimed to critically analyse studies that evaluated the capability of anthropometric and clinical indicators to predict MetS in the elderly.
Methods
Search strategy
The search was performed on the MEDLINE/ PUBMED, LILACS and SciELO bibliographic databases,
REVIEW ARTICLE
Mailing Address: Carolina Cunha de Oliveira
Rua Conego José Felix de Olieira, 485, Ap 10. Postal Code: 49035-170, Coroa do Meio, Aracaju, SE – Brazil E-mail: [email protected], [email protected]
Predictors of Metabolic Syndrome in the Elderly: A Review
Carolina Cunha de Oliveira,1,2 Emanuelle Dias da Costa,3 Anna Karla Carneiro Roriz,4 Lilian Barbosa Ramos,4
Mansueto Gomes Neto1
Programa de Pós-Graduação Medicina e Saúde – Universidade Federal da Bahia (UFBA), BA;1 Universidade Federal de Sergipe, SE;2 Residência em
Nutrição Clínica – UFBA;3 Programa de Pós-Graduação em Alimentos, Nutrição e Saúde – UFBA,4 Salvador, BA – Brazil
Manuscript received July 03, 2016; revised manuscript October 17, 2016; accepted February 28, 2017.
Aged; Body weights and Measures; Risk Factors; Anthropometry; Obesity; Metabolic Syndrome; Indicators.
Figure 1 – Flowchart of selection of papers for the review.
using the following word combinations: (“metabolic syndrome” or “syndrome X” or “plurimetabolic syndrome”) and (“elderly” or “older adults” or “aged”) and (“predict” or “identify” or “ability”). These expressions were searched either in combination with each other or alone. Articles of interest listed in the references were also identified and reviewed. Several authors were contacted for relevant information not provided in the articles.
Criteria for including the articles
Only original articles written in English, Spanish or Portuguese were included in the review. Articles published between January 2010 and January 2016 were selected and classic studies published on the topic prior to this period were also included. Population-based studies in the
elderly or studies on institutionalised elderly people that evaluated anthropometric and clinical indicators (LAP, VAI or lipid ratios) as predictors of MetS were included.
Data extraction
After screening of titles and abstracts according to eligibility criteria, relevant articles were selected for full-text reading (Figure 1).
WC, WHR, WHtR, SAD, NC and clinical indicators: LAP, VAI and lipid ratios: HDLc/TC, HDL/LDL and TG/LDL); 5) MetS classification criteria (IDF, National Cholesterol Education Program-Adult Treatment Panel III or the harmonized criteria2 for MetS); 6) main results (area under
the ROC curve: AUC; 95% CI: Confidence Interval; Cut-off points, SENS: sensitivity and SPEC: specificity).
Results
Two hundred and eighty-nine studies were identified on the bibliographic databases searched. After reading the titles and abstracts, 244 studies were excluded.
Thus, 45 articles were eligible for evaluation, and 26 of these papers were excluded as: 7 presented data on a young adult population; 5 evaluated global cardiovascular risk; 4 evaluated isolated MetS components (dyslipidemia, high blood pressure, diabetes or obesity); 2 evaluated predictors of resistance to insulin; 5 evaluated complete blood count components as predictors of MetS; 1 were with patients admitted to hospital and 2 studies written in Chinese. Finally, after reviewing the bibliographic references for articles of interest, two further papers were included. Thus, 21 articles were analysed in this review (Figure 1).
Of the articles analysed, 13 discussed anthropometric indicators (Tables 1 and 2), 7 evaluated clinical indicators (LAP, VAI and lipid ratios) (Tables 3 and 4) and one
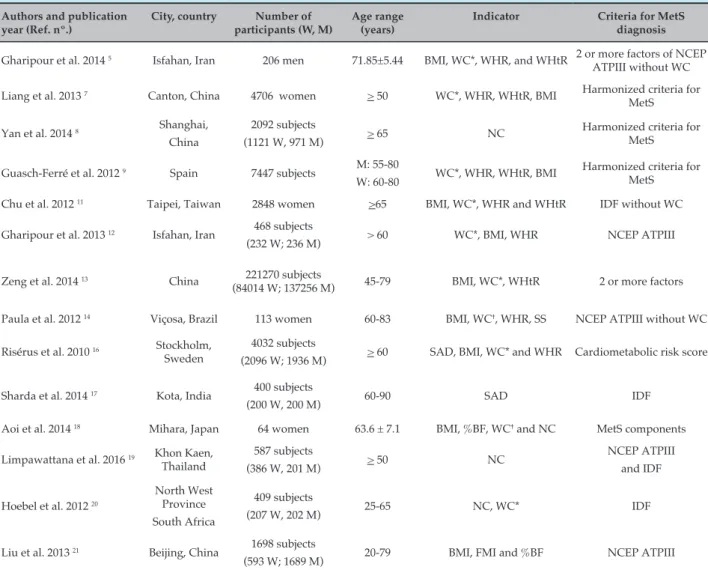
Table 1 – Studies evaluating the anthropometric indicators as predictors of metabolic syndrome in the elderly
Authors and publication year (Ref. nº.)
City, country Number of
participants (W, M)
Age range (years)
Indicator Criteria for MetS
diagnosis
Gharipour et al. 2014 5 Isfahan, Iran 206 men 71.85±5.44 BMI, WC*, WHR, and WHtR 2 or more factors of NCEP ATPIII without WC
Liang et al. 2013 7 Canton, China 4706 women > 50 WC*, WHR, WHtR, BMI Harmonized criteria for MetS
Yan et al. 2014 8 Shanghai, China
2092 subjects
(1121 W, 971 M) > 65 NC
Harmonized criteria for MetS
Guasch-Ferré et al. 2012 9 Spain 7447 subjects M: 55-80
W: 60-80 WC*, WHR, WHtR, BMI
Harmonized criteria for MetS
Chu et al. 2012 11 Taipei, Taiwan 2848 women >65 BMI, WC*, WHR and WHtR IDF without WC
Gharipour et al. 2013 12 Isfahan, Iran 468 subjects
(232 W; 236 M) > 60 WC*, BMI, WHR NCEP ATPIII
Zeng et al. 2014 13 China 221270 subjects
(84014 W; 137256 M) 45-79 BMI, WC*, WHtR 2 or more factors
Paula et al. 2012 14 Viçosa, Brazil 113 women 60-83 BMI, WC†, WHR, SS NCEP ATPIII without WC
Risérus et al. 2010 16 Stockholm, Sweden
4032 subjects
(2096 W; 1936 M) > 60 SAD, BMI, WC* and WHR Cardiometabolic risk score
Sharda et al. 2014 17 Kota, India 400 subjects
(200 W, 200 M) 60-90 SAD IDF
Aoi et al. 2014 18 Mihara, Japan 64 women 63.6 ± 7.1 BMI, %BF, WC† and NC MetS components
Limpawattana et al. 2016 19 Khon Kaen, Thailand
587 subjects
(386 W, 201 M) > 50 NC
NCEP ATPIII and IDF
Hoebel et al. 2012 20
North West Province South Africa
409 subjects
(207 W, 202 M) 25-65 NC, WC* IDF
Liu et al. 2013 21 Beijing, China 1698 subjects
(593 W; 1689 M) 20-79 BMI, FMI and %BF NCEP ATPIII
W: women; M: men; MetS: metabolic syndrome; IDF: International Diabetes Federation; NCEP ATPIII: National Cholesterol Education Programme Adult Treatment Panel III; BMI: body mass index; WC: waist circumference; WHR: waist-to-hip ratio; WHtR: waist-to-height ratio; SAD: sagital abdominal diameter; NC: neck circumference; SS: sum of the four skinfolds; %BF: percentage of body fat; FMI: fat mass index.
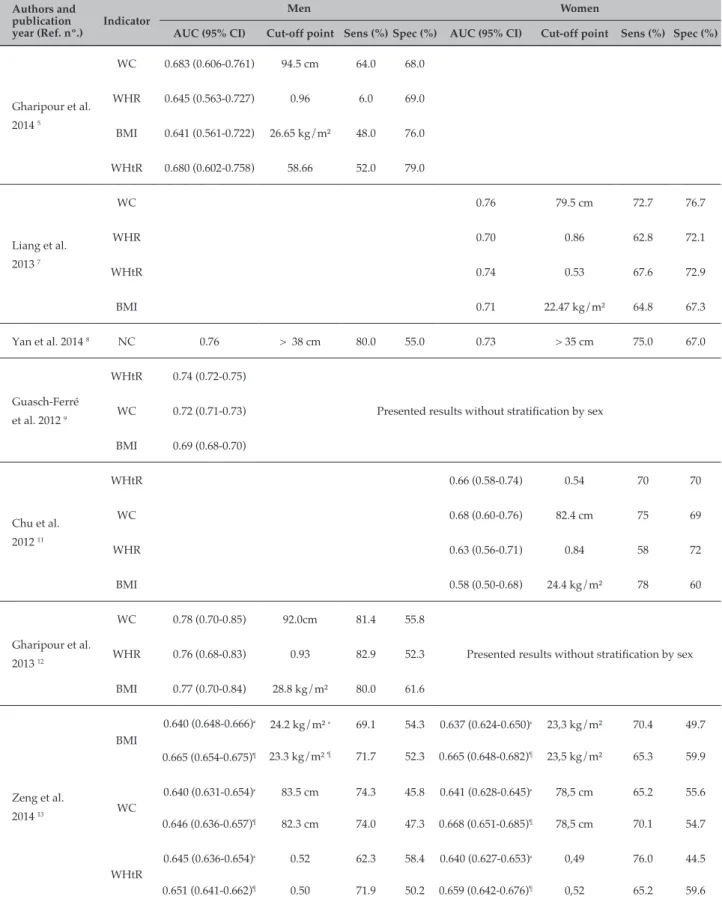
Table 2 – Cut-offs and areas under the ROC curve, sensitivity and specificity of anthropometric indicators to determine metabolic syndrome in the elderly
Authors and publication year (Ref. nº.)
Indicator
Men Women
AUC (95% CI) Cut-off point Sens (%) Spec (%) AUC (95% CI) Cut-off point Sens (%) Spec (%)
Gharipour et al. 2014 5
WC 0.683 (0.606-0.761) 94.5 cm 64.0 68.0
WHR 0.645 (0.563-0.727) 0.96 6.0 69.0
BMI 0.641 (0.561-0.722) 26.65 kg/m² 48.0 76.0
WHtR 0.680 (0.602-0.758) 58.66 52.0 79.0
Liang et al. 2013 7
WC 0.76 79.5 cm 72.7 76.7
WHR 0.70 0.86 62.8 72.1
WHtR 0.74 0.53 67.6 72.9
BMI 0.71 22.47 kg/m² 64.8 67.3
Yan et al. 2014 8 NC 0.76 > 38 cm 80.0 55.0 0.73 > 35 cm 75.0 67.0
Guasch-Ferré et al. 2012 9
WHtR 0.74 (0.72-0.75)
WC 0.72 (0.71-0.73) Presented results without stratiication by sex
BMI 0.69 (0.68-0.70)
Chu et al. 2012 11
WHtR 0.66 (0.58-0.74) 0.54 70 70
WC 0.68 (0.60-0.76) 82.4 cm 75 69
WHR 0.63 (0.56-0.71) 0.84 58 72
BMI 0.58 (0.50-0.68) 24.4 kg/m² 78 60
Gharipour et al. 2013 12
WC 0.78 (0.70-0.85) 92.0cm 81.4 55.8
WHR 0.76 (0.68-0.83) 0.93 82.9 52.3 Presented results without stratiication by sex
BMI 0.77 (0.70-0.84) 28.8 kg/m² 80.0 61.6
Zeng et al. 2014 13
BMI
0.640 (0.648-0.666)⸗
0.665 (0.654-0.675)¶
24.2 kg/m² ⸗
23.3 kg/m² ¶ 69.1
71.7 54.3
52.3
0.637 (0.624-0.650)⸗
0.665 (0.648-0.682)¶
23,3 kg/m²
23,5 kg/m²
70.4
65.3
49.7
59.9
WC
0.640 (0.631-0.654)⸗
0.646 (0.636-0.657)¶
83.5 cm
82.3 cm
74.3
74.0 45.8
47.3
0.641 (0.628-0.645)⸗
0.668 (0.651-0.685)¶
78,5 cm
78,5 cm
65.2
70.1
55.6
54.7
WHtR
0.645 (0.636-0.654)⸗
0.651 (0.641-0.662)¶
0.52
0.50
62.3
71.9 58.4
50.2
0.640 (0.627-0.653)⸗
0.659 (0.642-0.676)¶
0,49
0,52
76.0
65.2
44.5
59.6
article7 compared anthropometric indicators and lipid
ratios to predict MetS in the elderly (and hence is cited in anthropometric and clinical indicators’ tables).
The IDF’s and the NCEP-ATP III’s criteria were most commonly used criteria for definition of MetS). Only 5 articles used the most recent harmonized criteria for MetS.7-10 The harmonized criteria states that obesity
itself is not a prerequisite for diagnosis of MetS, which should be established based on the presence of any 3 or 5 risk factors (among which obesity is included).
Anthropometric indicators
Fourteen studies reported anthropometric indicators as predictors of MetS (Tables 1 and 2). Among the anthropometric indicators, those most cited were BMI, WC and WHR. The most recent studies analysed WHtR, SAD and NC.
The majority of the papers5,7,11-13 which evaluated
anthropometric indicators highlight WC and WHtR as the best predictors of MetS in the elderly, when compared to BMI and WHR.
Continuation
Paula et al. 2012 14
WC 0.694 (0.600-0.777) 92.0 cm 80 58.2
BMI 0.619 (0.523-0.708) 25.4 kg/m² 66.7 55.1
WHR 0.752 (0.662-0.829) 0.98 80 59.2
SS 0.669 (0.574-0.726) 108 mm 66.7 64.3
Risérus et al. 2010 16
SAD 0.80 (0.77-0.82) 22.2 cm 0.77 (0.75-0.80) 20.1 cm
WC 0.78 (0.75-0.80) 100 cm 0.77 (0.75-0.80) 88.4 cm
WHR 0.74 (0.71-0.77) 0.97 0.76 (0.74-0.79) 0.82
BMI 0.78 (0.76-0.81) 27.9 kg/m² 0.74 (0.72-0.77) 27.6 kg/m²
Sharda et al.
2014 17 SAD > 22 cm 88.0 83.0 > 20 cm 87.0 80.0
Aoi et al. 2014 18 NC NC was associated with BMI (r = 0.747, p < 0.0001), %BF (r = 0.715, p < 0.0001), TG (r = 0.276, p = 0.028), decrease in HDLc (r = –0.401, p < 0.001) and HbA1c (r = 0.298, p = 0.019), HOMA-R and leptin (r = 0.488, p < 0.001)
Limpawattana et
al. 2016 19 NC
0.84 (0.79-0.90)‡
0.71 (0.64-0.78)§
> 39 cm‡ 70.89 81.15
0.79 (0.75-0.84)‡
0.77(0.72-0.82)§
> 33 cm‡ 86.54 59.39
Hoebel et al.
2012 20 NC
0.70 (0.50-1.00)*
0.70 (0.60-0.90)†
> 35 cm*
> 41 cm†
0.60 (0.40-0.80)*
0.80 (0.70-0.90)†
> 35 cm*
> 33 cm†
Liu et al. 2013 21
BMI 0.904 (0.882-0.925) 27.45 kg/m² 80.6 84.3 0.869 (0.869-0.928) 23.85 kg/m² 92.7 72.9
BF 0.883 (0.859-0.908) 23.95% 84.1 7.8 0.855 (0.818-0.892) 31.35% 77.1 81.4
FMI 0.920 (0.900-0.940) 7.00 kg/m² 80.2 86.9 0.898 (0.869-0.927) 7.90 kg/m² 78.9 85.7
AUC: area under ROC curve; 95% CI: 95% conidence interval; Sens: sensitivity; Spec: speciicity; BMI: body mass index; WC: waist circumference; WHR: waist-to-hip ratio; WHtR: waist-to-height ratio; SAD: sagital abdominal diameter; NC: neck circumference; SS: sum of the four skinfolds; %BF: percentage of body fat; FMI: fat mass index; HbA1c: glycated haemoglobin.
The works of Liang et al.7 and Guasch-Ferré et al.9
reported an AUC over 0.70 for WC and WHtR to detect MetS, considering the harmonized criteria for MetS. For women, Liang et al.7 identified the cut-off points of
79.5 cm for WC (sens: 72.7%; spec: 76.7%) and 0.53 for WHtR (sens: 67.6%; spec: 72.9%), with efficiency higher than 70%. Zeng et al,.13 evaluating the presence of a
minimum of two MetS components and stratifying the results by sex and age, observed similar AUCs and cut-off points for elderly women at the age range of 60-69 and 70-79 years (Table 2).
Among the indicators with unsatisfactory performance, Paula et al.14 established that the BMI and the sum of
four skinfolds were the anthropometric parameters of adiposity which presented the least efficiency in identifying MetS.
Another indicator cited was SAD, which is able to estimate the excess of visceral fat and, consequently, is a better predictor of cardiometabolic risk than classic indicators.15 Only two studies16,17 evaluated SAD in the
elderly; Sharda et al.17 aimed to identify the best SAD
off points to predict MetS, and suggested the cut-off points of 22 cm for men and 20 cm for women, with sensitivity and specificity higher than 80% for both sexes. Similar cut-offs were found by Risérus et al.16 using a
cardiometabolic risk in elderly subjects.
In relation to NC, the articles analysed its performance in identifying MetS and its isolated components. Aoi et al.18 showed that the increase in NC is associated
to a rise in metabolic risk factors, such as resistance to insulin (leptin, HbA1c and HOMA-IR) and lipid profile (TG and HDL).
In the studies8,19,20 which evaluated the predictive
capacity of the NC, the cut-off points suggested by the authors were quite similar, varying between 35 and 41 cm for men and 33 and 35 cm for women (Table 2). Hoebel et al.20 observed that white men presented a
higher cut-off point (41 cm) when compared to black men (35 cm). The cut-off points for women were similar between white and black women, although the cut-off point for black women did not predict MetS, in contrast to what was observed for men. Limpawattana et al.19
Table 3 – Studies evaluating the clinical indicators as predictors of metabolic syndrome in the elderly
Authors and publication year (Ref. nº.)
City, country Number of participants Age range
(anos)
Indicator Criteria for MetS diagnosis
Liang et al. 2013 7 Canton, China 4706 women > 50 TG/HDL, HDL/
TC, HDL/LDL
Harmonized criteria for MetS
Arthur et al. 2012 10 Kumasi, Ghana 250 women 20-78 TG/HDL,
HDL/TC
Harmonized criteria for MetS
Tellechea et al. 2009 22 Buenos Aires, Argentina
601 men 18-65 LAP NCEP ATPIII
Taverna et al. 2011 23 Province of Segovia, Central
Spain
768 subjects (416 W; 352 M)
36-77 LAP, TG/HDL, TG, WC and BMI
NCEP ATPIII vs. IDF
Chiang & Koo 2012 24 Taiwan 513 subjects (247 W; 266 M)
> 50 LAP, WHtR, BMI and WC
MetS criteria for Taiwanese people
Ejike 2011 25 Abia State, Nigeria
40 men 65-84 LAP, VAI, BMI,
WHtR and WHR
IDF
Motamed et al. 2015 26 Amol, Iran 5511 subjects (2392 W; 3119 M)
18-90 LAP, WC, BMI, WHtR, WHR
IDF
Amato et al. 2011 27 Alcamo, Italy 1764 subjects (1179 W; 585 M)
16-99 VAI NCEP ATPIII
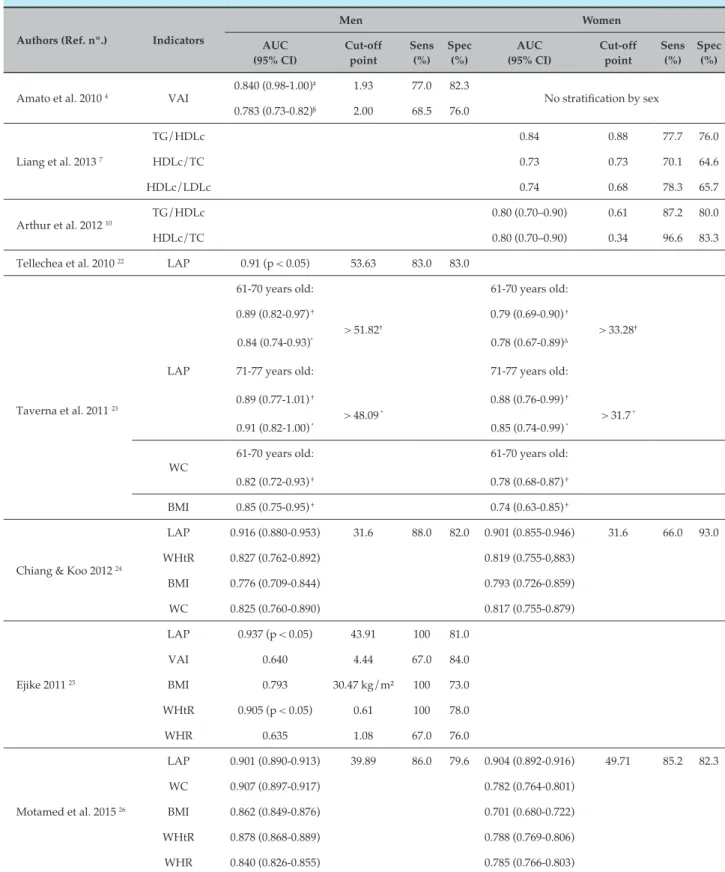
Table 4 – Cut-offs and areas under the ROC curve, sensitivity and specificity of clinical indicators to determine metabolic syndrome in the elderly
Authors (Ref. nº.) Indicators
Men Women
AUC (95% CI)
Cut-off point
Sens (%)
Spec (%)
AUC (95% CI)
Cut-off point
Sens (%)
Spec (%)
Amato et al. 2010 4 VAI
0.840 (0.98-1.00)‡ 1.93 77.0 82.3
No stratiication by sex 0.783 (0.73-0.82)§ 2.00 68.5 76.0
Liang et al. 2013 7
TG/HDLc 0.84 0.88 77.7 76.0
HDLc/TC 0.73 0.73 70.1 64.6
HDLc/LDLc 0.74 0.68 78.3 65.7
Arthur et al. 2012 10
TG/HDLc 0.80 (0.70–0.90) 0.61 87.2 80.0
HDLc/TC 0.80 (0.70–0.90) 0.34 96.6 83.3
Tellechea et al. 2010 22 LAP 0.91 (p < 0.05) 53.63 83.0 83.0
61-70 years old:
> 51.82†
> 48.09 *
61-70 years old:
> 33.28†
> 31.7 * Taverna et al. 2011 23
LAP
0.89 (0.82-0.97) †
0.84 (0.74-0.93)*
71-77 years old:
0.89 (0.77-1.01) †
0.91 (0.82-1.00) *
0.79 (0.69-0.90) †
0.78 (0.67-0.89)Δ
71-77 years old:
0.88 (0.76-0.99) †
0.85 (0.74-0.99) *
WC
61-70 years old:
0.82 (0.72-0.93) †
61-70 years old:
0.78 (0.68-0.87) †
BMI 0.85 (0.75-0.95) † 0.74 (0.63-0.85) †
Chiang & Koo 2012 24
LAP 0.916 (0.880-0.953) 31.6 88.0 82.0 0.901 (0.855-0.946) 31.6 66.0 93.0
WHtR 0.827 (0.762-0.892) 0.819 (0.755-0,883)
BMI 0.776 (0.709-0.844) 0.793 (0.726-0.859)
WC 0.825 (0.760-0.890) 0.817 (0.755-0.879)
Ejike 2011 25
LAP 0.937 (p < 0.05) 43.91 100 81.0
VAI 0.640 4.44 67.0 84.0
BMI 0.793 30.47 kg/m² 100 73.0
WHtR 0.905 (p < 0.05) 0.61 100 78.0
WHR 0.635 1.08 67.0 76.0
Motamed et al. 2015 26
LAP 0.901 (0.890-0.913) 39.89 86.0 79.6 0.904 (0.892-0.916) 49.71 85.2 82.3
WC 0.907 (0.897-0.917) 0.782 (0.764-0.801)
BMI 0.862 (0.849-0.876) 0.701 (0.680-0.722)
WHtR 0.878 (0.868-0.889) 0.788 (0.769-0.806)
WHR 0.840 (0.826-0.855) 0.785 (0.766-0.803)
AUC: area under ROC curve; 95% CI: 95% conidence interval; Sens: sensitivity; Spec: speciicity; LAP: Lipid Product Accumulation; VAI: Visceral Adiposity Index; WC: waist circumference; WHR: waist-to-hip ratio; WHtR: waist-to-height ratio; BMI: body mass index; HDLc/TC: HDL-cholesterol to total cholesterol ratio; HDL/LDL: HDL-cholesterol to LDL: cholesterol ratio; TG/LDL: triglyceride to HDL-cholesterol ratio.
and Yan et al.8 presented similar cut-off points for
NC to predict MetS in individuals aged over 50 and 65 respectively, and Limpawattana et al.19 showed an
efficiency over 72% for the cut-off point suggested for men (sens: 70.89%; spec: 81.15%) and women (sens: 86.54%; spec: 59.39%).
A parameter that has been insufficiently investigated was the Fat Mass Index (FMI), which is normalizes body fat for individual’s height. This index has been suggested to independently evaluate body fat from changes in fat free mass. In the study performed by Liu et al.,21 FMI
was the parameter with the highest AUC, and high FMI showed significantly higher odds ratio for MetS than the low FMI in both sexes. These authors suggested that a FMI of 7.00 kg/m² for men and 7.90 kg/m² for women, evaluated by bioelectrical impedance analysis, could predict the presence of MetS.
Clinical indicators
Tables 3 and 4 demonstrate the characteristics and results, respectively, of the eight studies which evaluated LAP and VAI clinical indicators and lipid ratios as predictors of MetS according to NCEP and IDF criteria and harmonized criteria for MetS.
LAP is an indicator proposed to estimate lipid concentration in adults, described for the first time by Kahn.3 It is an emerging cardiovascular risk index based
on the product of WC multiplied by fasting triglyceride concentration. LAP has proven to be a reliable marker for cardiovascular disease in adults, outperforms other predictors of this risk as BMI.3 Most of the studies
analysed evaluated a mixed population, stratified by sex and/or age range. The cut-off point for LAP suggested by the authors22-26 varied from 31.6 to 51.8, with a difference
between the sexes (Table 4). Among men, the LAP AUC to predict MetS varied from 0.84 to 0.937, while for women the lowest AUC was 0.78 and highest was 0.904 (Table 4).
Taverna et al.23 reported a lower AUC for men and
women in the 61-70 age range, considering the IDF criteria (area under the curve, AUC: 0.84; 95% CI: 0.74-0.93 for men and 0.78; 95% CI: 0.76-0.99 for women) when compared to the other studies.
Ejike CECC25 investigated LAP as a predictor of MetS in
the elderly (aged between 65 and 84); the authors reported an AUC of 0.937 (p=0.013) and suggested a LAP cut-off point of 43.9 (sens: 100%; spec: 81%). Tellechea et al.22,
Chiang & Koo24 and Motamed et al.26 also observed the
high predictive capacity of LAP to identify MetS (AUC higher than 0.90). Among these studies, the lowest LAP
cut-off point to identify MetS was reported by Chiang & Koo24 (31.6 for both sexes).
VAI is a gender-specific, empirical-mathematical model based on a combination of anthropometric measurements (WC and BMI) with biochemical parameters (TG and HDLc), which may be and indicator of fat distribution and function.4 The Alkam Metabolic
Syndrome Study4 introduced VAI as a new marker of
adipose tissue dysfunction, independently associated with cardiovascular events, which was not observed for WC and BMI. Only two studies investigated this indicator in MetS.25,27 For Amato et al.27, a VAI value higher than
2.00 (sens: 68.5% and spec: 76.0%) for individuals aged over 66 was able to predict MetS. However, in the study by Ejike CECC,25 VAI showed an AUC of 0.640 but
without statistical significance (p = 0.426), suggesting a cut-off point higher than 4.4, with relatively better sensitivity and specificity to identify MetS in the elderly (sens: 67% and spec: 84%).
Two papers7,10 described the results of lipid ratios,
with different cut-off points between the studies. Arthur et al.10 observed that the TG/HDL and HDL/CT
ratios presented AUC of 0.80 (95% IC: 0.70-0.90) for both ratios, suggesting a cut-off point of 0.61 (sens: 87.2% and spec: 80%) for the TG/HDL ratio and 0.34 (sens: 96.6% and spec: 83.3%) for the HDL/CT ratio, therefore demonstrating efficiency of over 83%.
Discussion
The anthropometric indicators that showed a better performance in identifying MetS were WC and WHtR (among the classic indicators) and NC (among the recently studied indicators). Regarding the clinical parameters, LAP was the best indicator, followed by the HDL/CT ratio.
An important point to be discussed is the criteria used to define MetS (IDF, NCEP ATPIII and harmonized criteria), which may justify the diversity of results discussed in this review. In addition, the use of different criteria and measurement techniques, particularly in relation to WC, does not ensure comparability between the studies.
WC and WHtR were the best parameters evaluated,5,7,9,13
and WHtR showed similar results to BMI and WHR, with an AUC lower than 0.70 to detect a minimum of three MetS criteria in women. This divergence could be attributed to the age of the elderly (average of 71.9 years), with high prevalence of other comorbidities, apart from obesity, that contribute to the development of MetS. Therefore, obesity appears not to be a decisive criterion for MetS detection in this age range.
A further indicator discussed in the literature is SAD. Although very few studies have evaluated this indicator as a predictor of MetS, the cut-off points suggested by Risérus et al.16 and Sharda et al.17 are in line with other
studies that evaluated SAD as a predictor of visceral fat.15,28 Despite being related to visceral abdominal fat
deposits, SAD has not been widely used in clinical practice since it requires a specific measuring instrument (abdominal caliper – Holtain, Ltd, Dyfed, Wales, U.K).
NC was also evaluated, with similar cut-off points suggested by the authors,8,19,20 which can be explained by
the fact that this measurement is little affected by aging-related changes in body composition. The association between NC and MetS may be related to the fact that subcutaneous fat in the neck area is responsible for higher systemic release of free fatty acids.19 This excess
of free fatty acids is associated with resistance to insulin, hypertriglyceridemia, vascular lesion and high blood pressure, and could predict MetS.
Differences between sexes and ethnic groups were reported in the study by Hoebel et al.20 The authors
observed that a NC cut-off point of 35 cm was not able to predict MetS in black women, in contrast with what was observed in men, suggesting a concept of “healthy obesity”. However, a limitation of this study was that the authors considered individuals aged between 46 and 65 as the elderly group and, for this reason, their results cannot be extrapolated to individuals aged over 65. Altogether, the studies8,18-20 suggested the use of NC,
as it is a simple and practical anthropometric parameter, able to identify MetS. Another advantage of the NC is the fact that it is not affected during respiratory movement or in the postprandial period.
FMI was only discussed in the study by Liu et al.21
Although the authors suggested a cut-off point, it is worth pointing out that there was no stratification by age group in the data analysis. In addition, the study was conducted in China, in a smaller population with brevilineal biotype, which limit the extrapolation of results to other populations.
The studies included showed that the cut-off points for obesity indicators need to be specific for the elderly,
with higher values when compared to other age groups, as obesity does not appear to be a strong predictor of MetS in the elderly.
With regards to clinical indicators, LAP was the parameter most discussed in the studies. Kahn3 highlights
that the WC and TG levels tend to increase with age, accumulating over time. From this perspective and considering that lipid accumulation intensifies cardiometabolic consequences, the use of LAP seems an advantageous approach in evaluating MetS and cardiovascular risk.
The cut-off points for LAP suggested by the studied showed a wide variety, which could be justified by ethnic diversity, extensive age ranges and different criteria used to define MetS. In addition, two studies22,26 did
not adequately define the age group of the elderly. While Motamed et al.26 did not stratify the results between
adults and the elderly, Tellechea et al.22 considered the
elderly group to be aged between 45 and 65. These facts limit the understanding of this indicator’s performance, specifically among the elderly.
Although Taverna et al.23 has reported the lowest LAP
AUC for the elderly aged between 61-70 years when compared with other studies, these authors show a better performance of LAP as a predictor of MetS in the elderly. Besides, although Ejike CECC25 demonstrated
good results using the LAP indicator, a small sample (only 40 men) was included, which was an important limitation of the study.
The lowest LAP cut-off point to predict MetS suggested by Chiang & Koo,24 could be related to the criterion
used to define MetS and the physical characteristics of the population evaluated. The capacity of LAP to identify MetS, compared with that of other parameters, is associated to the fact that this indicator reflects anatomical and physiological alterations associated to visceral fat and its accumulation,22,25 indicating that,
regardless of how excess lipids are stored, it will be identified by LAP.25
Another clinical indicator also related to the dysfunction of the adipose tissue is VAI, which uses WC, BMI, TG and LDL measurements for its calculation. Only two studies25,27 have analysed its performance
and proposed a VAI cut-off point to identify MetS. However, the cut-off points suggested diverged among the authors. It is of note that three of the variables on which VAI is based (WC, TG and HDL) are also MetS components, which makes the use of this index in patients with clear MetS pointless.29 The studies7,10 using
isolation is not able to identify MetS, particularly among the elderly, but rather to identify isolated cardiovascular risk factors.
The results were clear in showing that WC, WHtR and LAP indicators were the most sensitive ones for predicting MetS. Therefore, the use of these parameters may facilitate the early identification of MetS through easily-applied, precise and low cost diagnostic methods. The use of these indicators by health professionals is important to optimise MetS prevention and treatment, and to minimize its complications.
To summarise, the studies included propose different indicators to predict MetS. However, the cut-off points suggested vary between each other, as they are linked to different populations, with different age and ethnic characteristics. Further studies are required to identify the best practical, validated method to predict MetS. Also, studies comparing different indicators are needed, considering specific aspects, such as sex, well-defined age ranges and ethnic groups.
Different MetS classification criteria have been adopted, which makes the comparison between the studies problematic and the standardisation of the criteria essential. In addition, there is no consensus on the best indicator to predict MetS in the elderly, and studies in this population is still scare. These data affect the understanding of the indicators’ performance in predicting MetS in this age group.
The most of these studies presented to methodological differences and study designs, as well as limitations inherent to observational studies, which make the comparison between results and the control of population biases difficult.
Conclusion
Analysis of the studies included in this review allowed us to infer that the WC, WHtR and LAP indicators presented the best predictive power for MetS in the elderly
because they are strongly related to visceral abdominal fat deposits. However, the disparate values between the studies substantiated that the prevalence of other comorbidities, rather than obesity, may be contributing to the development of MetS in this population. Thus, the results revealed that the distribution of abdominal fat, instead of overweight appears to be a fundamental criterion for this age group, but the distribuition of abdominal fat. The need to identify a simple method which facilitates the approach and detection of high risk for MetS in the elderly is highlighted, allowing the early prevention of cardiovascular events.
Author contributions
Conception and design of the research: Oliveira CC, Roriz AKC, Ramos LB, Gomes Neto M. Acquisition of data: Oliveira CC, Costa ED. Analysis and interpretation of the data: Oliveira CC, Roriz AKC, Ramos LB, Gomes Neto M. Statistical analysis: Oliveira CC. Obtaining financing: Ramos LB. Writing of the manuscript: Oliveira CC, Costa ED, Gomes Neto M. Critical revision of the manuscript for intellectual content: Oliveira CC, Roriz AKC, Ramos LB, Gomes Neto M.
Potential Conflict of Interest
No potential conflict of interest relevant to this article was reported.
Sources of Funding
This study was funded by FAPESB - Fundação de Amparo à Pesquisa do Estado da Bahia (parecer nº 0007/2013).
Study Association
This article is part of the thesis of Doctoral submitted by Carolina Cunha de Oliveira, from Programa de Pós Graduação em Medicina e Saúde da Universidade Federal da Bahia.
1. Akbulut G, Köksal E, Bilici S, Acar Tek N, Yildiran H, Karadag MG, et al. Metabolic syndrome (MS) in the elderly: A cross sectional survey. Arch Gerontol Geriatr. 2011;53(3):e263–6.
2. Alberti KG, Eckel RH, Grundy SM, Zimmet PZ, Cleeman JI, Donato K A, et al. Harmonizing the Metabolic Syndrome: A Joint Interim Statement of the International Diabetes Federation Task Force on Epidemiology and Prevention; National Heart, Lung, and Blood Institute; American Heart Association; World Heart Federation; International. Circulation. 2009;120(16):1640–5.
3. Kahn H. The “lipid accumulation product” performs better than the body mass index for recognizing cardiovascular risk: a population-based comparison. BMC Cardiovasc Disord. 2005;5(26):10.
4. Amato MC, Giordano C, Galia M, Criscimanna A, Vitabile S, Midiri M, et al. Visceral Adiposity Index: a reliable indicator of visceral fat function associated with cardiometabolic risk. Diabetes Care. 2010;33(4):920–2.
5. Gharipour M, Sadeghi M, Dianatkhah M, Bidmeshgi S, Ahmadi A, Tahri M, et al. The Cut-Off Values of Anthropometric Indices for Identifying Subjects at Risk for Metabolic Syndrome in Iranian Elderly Men. J Obes. 2014;2014:1–6.
6. Zhou J, Ge H, Zhu M, Wang L, Chen L, Tan Y, et al. Neck circumference as an independent predictive contributor to cardio-metabolic syndrome. Cardiovasc Diabetol. 2013;12:76.
7. Liang H, Chen X, Chen Q, Wang Y, Wu X, Li Y, et al. The metabolic syndrome among postmenopausal women in rural canton: prevalence, associated factors, and the optimal obesity and atherogenic indices. PLoS One. 2013;8(9):e74121.
8. Yan Q, Sun D, Li X, Zheng Q, Li L, Gu C, et al. Neck circumference is a valuable tool for identifying metabolic syndrome and obesity in Chinese elder subjects: a community-based study. Diabetes Metab Res Rev. 2014;30(1):69–76.
9. Guasch-Ferré M, Bulló M, Martínez-González MÁ, Corella D, Estruch R, Covas M-I, et al. Waist-to-height ratio and cardiovascular risk factors in elderly individuals at high cardiovascular Rrsk. PLoS One .2012; 7(8):e43275.
10. Arthur FKN, Adu-Frimpong M, Osei-Yeboah J, Mensah FO, Owusu L. Prediction of metabolic syndrome among postmenopausal Ghanaian women using obesity and atherogenic markers. Lipids Health Dis. 2012;11:101.
11. Chu F-L, Hsu C-H, Jeng C. Low predictability of anthropometric indicators of obesity in metabolic syndrome (MS) risks among elderly women. Arch Gerontol Geriatr. 2012;55(3):718–23.
12. Gharipour M, Sarrafzadegan N, Sadeghi M, Andalib E, Talaie M, Shafie D, et al. Predictors of metabolic syndrome in the iranian population: waist circumference, body mass index, or waist to hip ratio? Cholesterol. 2013;2013:198384.
13. Zeng Q, He Y, Dong S, Zhao X, Chen Z, Song Z, et al. Optimal cut-off values of BMI, waist circumference and waist:height ratio for defining obesity in Chinese adults. Br J Nutr. 2014;112(10):1735–44.
14. Paula HA A, Ribeiro RCL, Rosado LE, Abranches MV, Franceschini S C. Classic anthropometric and body composition indicators can predict risk of metabolic syndrome in the elderly. Ann Nutr Metab. 2012;60(4):264–71.
15. Carneiro Roriz AK, Santana Passos LC, Cunha de Oliveira C, Eickemberg M, de Almeida Moreira P, Ramos Sampaio L. Discriminatory power of indicators predictors of visceral adiposity evaluated by computed tomography in adults and elderly individuals. Nutr Hosp 2014;29(6):1401–7.
16. Risérus U, de Faire U, Berglund L, Hellénius M-L. Sagittal abdominal diameter as a screening tool in clinical research: cut-offs for cardiometabolic risk. J Obes. 2010;Pii:757939.
17. Sharda M, Nagar D, Soni A. Sagittal abdominal diameter as a predictor of metabolic syndrome in the elderly. J Indian Acad Geriatr. 2014 Mar;10:5–9.
18. Aoi S, Miyake T, Harada T, Ishizaki F, Ikeda H, Nitta Y, et al. Neck circumference has possibility as a predictor for metabolic syndrome in postmenopausal women. Hiroshima J Med Sci. 2014;63(4):27–32.
19. Limpawattana P, Manjavong M, Sopapong R. Can neck circumference predict metabolic syndrome? An experience from a university community. Endocr Pract. 2016;22(1):8–15.
20. Hoebel S, Malan L, de Ridder JH. Determining cut-off values for neck circumference as a measure of the metabolic syndrome amongst a South African cohort: the SABPA study. Endocrine. 2012;42(2):335–42.
21. Liu P, Ma F, Lou H, Liu Y. The utility of fat mass index vs. body mass index and percentage of body fat in the screening of metabolic syndrome. BMC Public Health. 2013;13:629.
22. Tellechea ML, Aranguren F, Martinez-Larrad MT, Serrano-Rios M, Taverna MJ, Frechtel GD. Ability of lipid accumulation product to identify metabolic syndrome in healthy men from Buenos Aires. Diabetes Care. 2009;32(7):e85.
23. Taverna MJ, Martinez-Larrad MT, Frechtel GD, Serrano-Rios M. Lipid accumulation product: a powerful marker of metabolic syndrome in a healthy population. Eur J Endocrinol .2011;164(4):559–67.
24. Chiang J-K, Koo M. Lipid accumulation product: a simple and accurate index for predicting metabolic syndrome in Taiwanese people aged 50 and over. BMC Cardiovasc Disord. 2012;12:78.
25. Ejike CECC. Lipid accumulation product and waist-to-height ratio are predictors of the metabolic syndrome in a nigerian male geriatric population. J Rural Trop Public Health. 2011;10:101–5.
26. Motamed N, Razmjou S, Hemmasi G, Maadi M, Zamani F. Lipid accumulation product and metabolic syndrome: a population-based study in northern Iran, Amol. J Endocrinol Invest .2016;39(4):375-82.
27. Amato MC, Giordano C, Pitrone M, Galluzzo A. Cut-off points of the visceral adiposity index (VAI) identifying a visceral adipose dysfunction associated with cardiometabolic risk in a Caucasian Sicilian population. Lipids Health Dis. 2011;10:183.
28. Roriz AKC, de Oliveira CC, Moreira PA, Eickemberg M, Medeiros JMB, Sampaio LR. Methods of predicting visceral fat in Brazilian adults and older adults: a comparison between anthropometry and computerized tomography. Arch Latinoam Nutr. 2011;61(1):5–12.