Safety Culture in an electronic Brazilian version
Correspondence:
Luiz Eduardo Lima de Andrade – Rua Alberto Silva, nº 1375, Bloco E, Apto. 503, Lagoa Seca, Natal-RN, Brasil. CEP: 59022-300 E-mail: [email protected]
Abstract
Objective: to adapt the Hospital Survey on Patient Safety Culture (HSOPSC) to the Brazilian context and validate a computer program that facilitates the collection and analysis of data in hospitals with different types of management. Methods: methodological study developed in six hospitals in Natal-RN, Brazil; a software which allows data collection via e-mail, cloud storage and automatic data report was developed; validity was verified through confirmatory factor analysis and reliability, through consistency analysis with Cronbach's alpha. Results: 863 professionals participated in the study; the adapted version presented total Cronbach's alpha of 0.92 and median of 0.69 in the 12 dimensions (90% confidence interval: 0.53;0.87); the model was fitted and showed good indexes in the confirmatory factor analysis. Conclusion: the results confirmed the validity and reliability of the instrument with adequate psychometric properties for the assessment of patient’s safety culture in Brazilian hospitals.
Keywords: Validation Studies as Topic; Organizational Culture; Security Management; Quality of Health Care; Patient Safety. doi: 10.5123/S1679-49742017000300004
Luiz Eduardo Lima de Andrade1
Laiza Oliveira Mendes de Melo1
Ivanise Gomes da Silva2
Roselma Marinho de Souza2
André Luiz Barbosa de Lima2
Marise Reis de Freitas3
Almária Mariz Batista4
Zenewton André da Silva Gama2
1Universidade Federal do Rio Grande do Norte, Faculdade de Ciências da Saúde do Trairí, Santa Cruz-RN, Brasil
2Universidade Federal do Rio Grande do Norte, Departamento de Saúde Coletiva, Natal-RN, Brasil
3Universidade Federal do Rio Grande do Norte, Departamento de Medicina, Natal-RN, Brasil
Introduction
The occurrence of adverse events in health services has caused avoidable damages to patients and there is an urgent need for preventing it in Brazil and worldwide.1,2 The awareness towards this issue transformed the patient safety into a priority of health care quality and an important component of systems’ management and health services.3
The safety culture in an organization may be defined as the product of individuals and group values, attitudes, perceptions, competences and behavior patterns that determine compromise, style, proficiency, health in an organization and safety management.4 Organization with a positive safety culture are characterized by communications based on mutual trust, common perceptions towards the importance of safety and conviction in the efficacy of preventable measures.5
The consensus over the importance of the safety culture is also present in guidelines of health organizations, such as the National Quality Forum (NQF), from the United States of America; this institution is responsible for preparing a document advising about the establishment and maintenance of a patient safety culture based on four recommendations: (i) development of leadership structures and systems for safety; (ii) measurement, feedback and intervention on safety culture; (iii) teamwork training and skill building; and (iv) systematic implementation of risk management.6
In the context of Brazilian health care policies, we can highlight the National Patient Safety Program, which aims to promote and support the implementation of actions related to the patient safety.7 The current sanitary regulation supports these actions through the mandatory preparation of the Patient Safety Plans and implementation of Centers for Patients Safety in health facilities.8
To promote the patient safety culture, the diagnosis and planning of interventions to minimize or reduce the fragilities detected are essential. It is important to highlight that the safety culture must be periodically assessed, as a monitoring activity for the improvements achieved.6
Among the instruments used to assess the safety culture, the Hospital Survey on Patient Safety Culture (HSOPSC) is, probably, one of the most used worldwide. The HSOPSC had its psychometric properties assessed in a big sample of North-American hospitals;9 this tool is internationally recognized and was translated into several languages.10,11
HSOPSC was translated into Portuguese and validated.12,14 However, the final version presented low Cronbach's alpha in some dimensions, probably due to translation flaws.15
The objective of this study was to adapt the Hospital Survey on Patient Safety Culture (HSOPSC) to the Brazilian context and validate a computer program that facilitates the collection and analysis of data in hospitals with different types of management.
Methods
This is a methodological study that aims to make a cross-cultural adequacy and validation of an electronic tool to assess the patient safety culture: the HSOPSC.9
The original tool was translated into Portuguese and, then, passed through a cross-cultural adequacy to the context of Brazilian hospitals. After that, a computer program was developed, in which the electronic survey was provided, to make the data collection easier and to allow automatic analysis of results and reports. Finally, an assessment of the psychometric properties of this instrument was conducted in six hospitals under different types of management.
The assessment tool HSOPSC, object of this research, is self-administered and covers 12 dimensions of the patient safety culture, two of them related to results on patient safety: (i) frequency of events reported and (ii) overall perceptions of patient safety; and ten about safety culture: (i) supervisor/manager expectations and actions promoting patient safety, (ii) organizational learning/ continuous improvement, (iii) team work within units, (iv)communication openness, (v) feedback and communication about error, (vi) nonpunitive response to errors, (vii) staffing, (viii) management support for patient safety, (ix) teamwork across units and (x) Handoffs and transitions. Besides these 12 dimensions, the tool covers two more items: (i) number of events reported and (ii) patient safety grade.
The original survey was developed and validated by the Agency for Health Care Research and Quality
(AHRQ)9, located in the United States, where this survey is widely used, as well as in other countries which made their own validation and adaptation.10-15 This survey allows blank answers, in case they do not apply to that professional or unit.
The HSOPSC was translated into Portuguese by a native English speaker translator, from a translation company. Then, a panel composed of five Brazilian specialists performed the back translation: four health professionals – from pharmacy, medicine and physiotherapy areas –and one specialist from quality management in health services, all of them with experience in patient safety. Afterwards, both translations were compared.
A universalist approach was adopted for the cross-cultural adaptation, which highlights that every measurement instrument, when out of its original context, must consider the fact that the concepts can be different between countries.16 Initially, the technical group assessed concepts and items, for which each member of the group gave a score from 1 to 5 (1 = totally disagree; 5 = totally agree), for each item of the survey and also for the survey as a whole. In this stage, the criterion adopted was the conceptual coherence of the instrument and the items with what was intended to be measured (content validity): safety culture and culture dimensions, according to the original survey. The criterion for items approval was the presentation of a median equal to 4 or 5 in the scores of the technical group. After this stage, a semantic review was conducted, by comparing the Portuguese translation draft of HSOPSC with other reference translations (Spanish,17 European Portuguese18 and initial stage of the Brazilian Portuguese12,13), enabling the adaptation of the assessed version to the local language and terminology.
The computer program was developed using open access technology, with the following programming language: Java, PostgreSQL and Linux, and Play! Framework, a fast tool in the development of Internet applications. The fast development methodology chosen was XP (Extreme Programming), whose objective is to optimize the project development and ensure the client satisfaction. This methodology allows small and medium teams of software creators to develop objective and practical projects, from a focal point. Thus, the HSOPSC was adapted for online and offline collection and analysis, based on the proposals of data analysis of AHRQ, available at: www.ahrq.gov/professionals/quality-patient-safety/ patientsafetyculture/hospital/index.html
The program developed is composed by two main modules, electronic survey and administrative system. The first module aims at data collection and enables the instrument to be sent to the e-mail of a previously registered participant, together with a presentation letter of the research and a model of the Free Informed Term of Consent to be signed. In this electronic survey, there is an extra tab with 10 indicator-questions related to good practices on patient safety, recommended by the NQF 2010.6 The second module aims to evaluate the management of hospitals and professionals that are taking part in the research, tabulate the data and conduct descriptive analyses of the respondents’ characteristics. Each form is recognized by a unique identifier, automatically and randomly generated by the system, known as access token. This technique enables the confidentiality over the identification of the professional respondent, not hampering the aggregate analysis for the hospital. During the survey filling, the system saves the inserted information, every minute, to ensure the storage of data in case of accidental system closure, blackout or problems on the device used (computer, tablet or smartphone).
After filling and submitting the first survey, the administrative system allows the researchers to view the statistical analysis of the answers in an informative panel with the percentage of answers, average time for filling, frequency of participants per profession, sex, and hospital service, among other professional characteristics. Tables and charts of indicators are built for the Percentage of Positive, Neutral and Negative Answers, in relation to the individual items, the dimensions of safety culture and the general survey. All the results are automatically generated, in real-time, for each hospital and for the total of hospitals assessed.
The computer program enables data to be exported to other softwares, to achieve a more detailed analysis, such as Excel, Statistical Package for the Social Sciences (SPSS) and Google Drive. The file with exported data is created in CSV (Comma Separated Values), a format adopted worldwide to export and integrate data between systems.
Telessaúde/RN website: http://www.telessaude.ufrn.br/ index.php/2013-11-04-22-58-23/seguranca-do-paciente This research was developed in six hospitals that present different types of management: three federal public hospitals, two state public hospitals and one private hospital in Rio Grande do Norte State. Among the three federal public hospitals that participated, two are maternity wards and one is a general hospital. Only the maternity wards have emergency rooms (ER) and five hospitals have intensive care units (ICU) – except one of the maternity wards. Of the state hospitals, one is a reference center for infectious diseases and another one for trauma and emergency care, both with ER and ICU. The private facility is a general hospital with ER and ICU and is level 1, according to the National Commission on Accreditation.
The professionals that took part in the survey had high school or higher education degree, worked with health assistance, or hospital management, and had permanent or temporary working contracts. To ensure more reliable information from the hospitals and reduce the probability of including professionals with little knowledge on patient safety, all the substitute professionals were excluded from the study. Convenience sampling was chosen.
The sample size should be large enough to perform factor analysis. For this study there were approximately 20 cases for each item of the survey (42 items x 20 = 840 cases), which is recommended for the adequate statistical confirmatory factor analysis: approximately 140 cases for each one of the six hospitals.18
Initially, the data collection was conducted via e-mail. The human resources sectors from each hospital provided a list with the electronic addresses of the professionals of health assistance and management, who were active and had available e-mails. In each hospital, posters and memos were distributed into their units, aiming a wide dissemination of the research and gathering a high number of answers, in order to avoid selection bias related to lack of responses. Professionals who did not answer within 7, 10 and 15 days also received automatic reminders in their e-mails.
To increase the number of participants, we also collected data in person, using electronic devices (tablets and smartphones with operational system Android 4.0 or higher) with the self-administered survey available for the professionals. This stage extended the collection to professionals who did not use e-mails or did not answer the survey via e-mail.
Data were collected from January to March 2015, after a pilot-study with 215 participants.
The answers followed Likert scale from 1 to 5, covering the following options: strongly disagree; disagree; neither; agree; strongly agree; or never; rarely; sometimes; most of the time; and always. The scale was recoded and the percentage of specific positive answers – in the dimension or the item – was the main analysis indicator. The database analyses were automatically generated, by the specific software for databases analyses. In the case of reverse questions – formulated with negative clauses –, the answers for Likert scale from 1 to 5 were inverted.
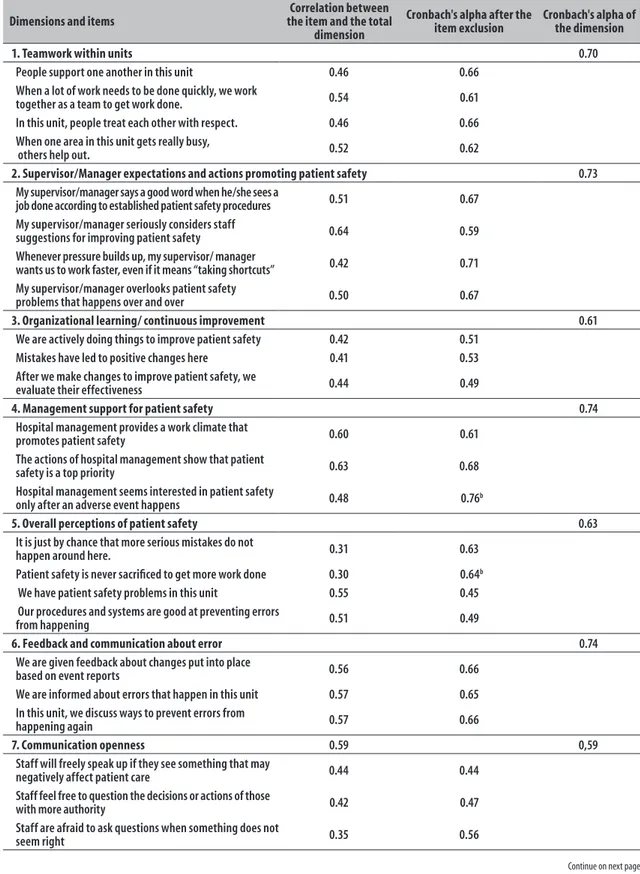
The reliability of the tool was analyzed in an internal consistency study, through the calculation of Cronbach's alpha. This indicator measured the level that the translated items are related within each dimension of the safety culture and in the whole survey. That is, the higher the covariates and correlations are, the higher will be the consistency of measure in the same dimension or the concepts. Regarding the reliability of dimensions and of the full survey, Cronbach's alpha higher than 0.6 is considered as acceptable reliability, higher than 0.7, good reliability, and higher than 0.9, excellent.19,20
The verification of concept validity and the analysis of the multidimensional model were conducted through confirmatory factor analysis. We used the model for structure equations to investigate the adjustment of the data observed to the dimension proposed by the HSOPSC. The statistical package MPlus v.7 (Muthen & Muhthen) was used, with robust estimation method with weighted least squares adjusted for the average and variance (WLSMV). The analysis, thus, was based on the polychoric matrix used for ordinal data. The assessment measures of the fit used to verify the adequacy of the model to the data were (i) chi-square ratio/degree of freedom, (ii) root mean square error of approximation (RMSEA), (iii) comparative fit index (CFI) and (iv) Tucker-Lewis index (TLI). We considered good fit when the chi-square ratio/degree of freedom was <3.21
This study project was approved by the Ethics Research Committee (CEP Central) of the Federal University of Rio Grande do Norte (UFRN), on April 26th 2013. Report No. 261.289. All the institutions and individuals formally authorized their participation. The professionals’ names were not released, to ensure the anonymity of participants and get more reliable answers.
Results
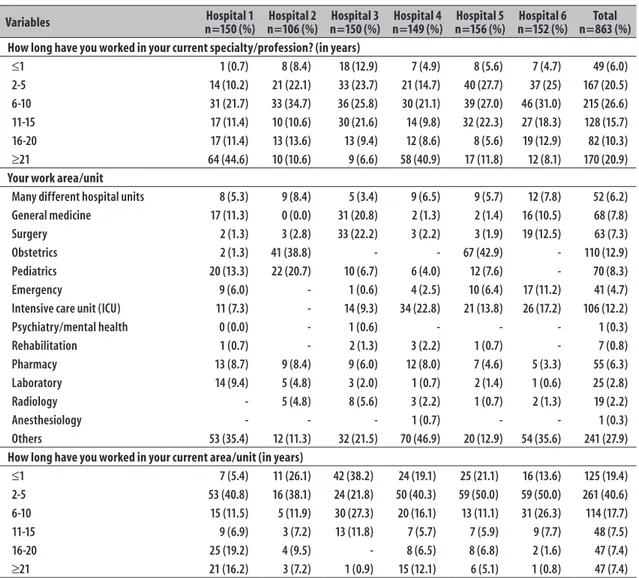
A total of 863 respondents from the six hospitals participated, most of them were females: 77.2%. The majority of respondents worked on health assistance, and 84.7% of the participants had direct contact with patients. Among the participants, most were nursing professionals, especially nurse technicians (44.6%), and nurses (16.2%). These numbers reflect the higher proportions of those professionals in Brazilian hospitals. A small amount of the staff had been working for less than
a year (5.7%). As two of the hospitals were maternity wards and the private hospital also has maternal-infant care, the most prevalent area/unit of work was obstetrics: 12.7% (Table 1).
The reliability of the tool, confirmed by Cronbach's alpha, was excellent, except for dimensions ‘Nonpunitive response to errors’ and ‘Staffing’. The internal consistency in three dimensions – ‘Overall perceptions of patient safety’, ‘Management support for patient safety’ and ‘Staffing’ – increased with the exclusion or change of one of the questions, but the first two already presented good reliability. For example, this latter dimension, ‘Staffing’, after the exclusion of the item ‘We use more temporary/ agency staff than is best for patient care.’, was the only one that presented good internal consistency (Table 2). The assessment measures of adjustments used to verify the adequacy to the model of data showed that the instrument is valid and adequate to the 12 dimensions, as proposed by the original HSOPSC, with chi-square ratio
Table 1 – Characteristics of the participants of the survey for cross-cultural adequacy and validation of the tool Hospital Survey on Patient Safety Culture (HSOPSC),a conducted in the municipality of Natal, Rio
Grande do Norte, 2015
Variables n=150 (%)Hospital 1 n=106 (%)Hospital 2 n=150 (%)Hospital 3 n=149 (%)Hospital 4 n=156 (%)Hospital 5 n=152 (%)Hospital 6 n=863 (%)Total
Sex
Male 34 (22.7) 35 (33.4) 28 (19.0) 20 (13.5) 27 (17.4) 46 (30.2) 190 (22.7)
Female 116 (77.3) 70 (66.6) 119 (81.0) 128 (86.5) 128 (82.6) 106 (69.8) 667 (77.3)
Contact with the patient
Yes 128 (85.3) 98 (92.4) 139 (94.6) 118 (79.2) 137 (90.1) 111 (73.5) 731 (85.7)
No 22 (14.7) 8 (7.6) 8 (5.4) 29 (20.8) 15 (9.9) 40 (26.5) 122 (14.3)
Staff position in the hospital
Nurse 14 (9.0) 25 (23.7) 26 (17.3) 19 (12.8) 31 (19.9) 25 (16.6) 140 (16.3)
Nurse technician 66 (42.9) 33 (31.2) 93 (62.6) 64 (42.9) 63 (40.6) 66 (43.6) 385 (44.7)
Nursing assistant 6 (3.9) 1 (0.9) 3 (2.1) 5 (3.2) 5 (3.6) 4 (2.6) 24 (2.3)
Staff Physician 10 (6.4) 2 (1.8) 3 (2.1) 6 (4.2) 19 (12.2) 10 (6.5) 50 (5.9)
Resident physician 2 (1.3) 2 (1.8) 1 (0.7) 0 (0.0) 6 (3.8) - 11 (1.2)
Pharmacist 9 (5.9) 9 (8.5) 5 (3.6) 5 (3.2) 4 (2.5) - 32 (3.9)
Nutritionist 4 (2.6) 2 (1.8) 6 (4.2) 3 (2.1) 3 (1.9) 2 (1.3) 20 (2.4)
Social worker 5 (3.3) 3 (2.9) 0 (0.0) 6 (4.2) - - 14 (1.7)
Dentist 4 (2.6) 6 (5.6) 0 (0.0) 4 (2.6) - - 10 (1.2)
Psychologist 0 (0.0) 4 (3.8) 3 (2.1) 4 (2.6) - 1 (0.7) 12 (1.3)
Physical, Occupational, or Speech Therapist 4 (2.6) 5 (4.8) 1 (0.7) 16 (10.7) 2 (1.2) 2 (1.3) 30 (3.5)
Technician (others) 12 (7.8) 8 (7.6) 2 (1.3) 3 (2.1) 3 (1.9) 8 (5.2) 36 (4.1)
Administration/management 1 (0.7) 1 (0.9) - - - 3 (1.9) 5 (0.6)
Unit assistant/Secretary 4 (2.6) 3 (2.9) 1 (0.7) 3 (2.1) 11 (7.2) 19 (12.5) 41 (4.9)
Others 13 (8.4) 2 (1.8) 4 (2.6) 11 (7.3) 8 (5.2) 12 (7.8) 50 (5.9)
Table 1 – Conclusion
Variables n=150 (%)Hospital 1 n=106 (%)Hospital 2 n=150 (%)Hospital 3 n=149 (%)Hospital 4 n=156 (%)Hospital 5 n=152 (%)Hospital 6 n=863 (%)Total
How long have you worked in your current specialty/profession? (in years)
≤1 1 (0.7) 8 (8.4) 18 (12.9) 7 (4.9) 8 (5.6) 7 (4.7) 49 (6.0)
2-5 14 (10.2) 21 (22.1) 33 (23.7) 21 (14.7) 40 (27.7) 37 (25) 167 (20.5)
6-10 31 (21.7) 33 (34.7) 36 (25.8) 30 (21.1) 39 (27.0) 46 (31.0) 215 (26.6)
11-15 17 (11.4) 10 (10.6) 30 (21.6) 14 (9.8) 32 (22.3) 27 (18.3) 128 (15.7)
16-20 17 (11.4) 13 (13.6) 13 (9.4) 12 (8.6) 8 (5.6) 19 (12.9) 82 (10.3)
≥21 64 (44.6) 10 (10.6) 9 (6.6) 58 (40.9) 17 (11.8) 12 (8.1) 170 (20.9)
Your work area/unit
Many different hospital units 8 (5.3) 9 (8.4) 5 (3.4) 9 (6.5) 9 (5.7) 12 (7.8) 52 (6.2)
General medicine 17 (11.3) 0 (0.0) 31 (20.8) 2 (1.3) 2 (1.4) 16 (10.5) 68 (7.8)
Surgery 2 (1.3) 3 (2.8) 33 (22.2) 3 (2.2) 3 (1.9) 19 (12.5) 63 (7.3)
Obstetrics 2 (1.3) 41 (38.8) - - 67 (42.9) - 110 (12.9)
Pediatrics 20 (13.3) 22 (20.7) 10 (6.7) 6 (4.0) 12 (7.6) - 70 (8.3)
Emergency 9 (6.0) - 1 (0.6) 4 (2.5) 10 (6.4) 17 (11.2) 41 (4.7)
Intensive care unit (ICU) 11 (7.3) - 14 (9.3) 34 (22.8) 21 (13.8) 26 (17.2) 106 (12.2)
Psychiatry/mental health 0 (0.0) - 1 (0.6) - - - 1 (0.3)
Rehabilitation 1 (0.7) - 2 (1.3) 3 (2.2) 1 (0.7) - 7 (0.8)
Pharmacy 13 (8.7) 9 (8.4) 9 (6.0) 12 (8.0) 7 (4.6) 5 (3.3) 55 (6.3)
Laboratory 14 (9.4) 5 (4.8) 3 (2.0) 1 (0.7) 2 (1.4) 1 (0.6) 25 (2.8)
Radiology - 5 (4.8) 8 (5.6) 3 (2.2) 1 (0.7) 2 (1.3) 19 (2.2)
Anesthesiology - - - 1 (0.7) - - 1 (0.3)
Others 53 (35.4) 12 (11.3) 32 (21.5) 70 (46.9) 20 (12.9) 54 (35.6) 241 (27.9)
How long have you worked in your current area/unit (in years)
≤1 7 (5.4) 11 (26.1) 42 (38.2) 24 (19.1) 25 (21.1) 16 (13.6) 125 (19.4)
2-5 53 (40.8) 16 (38.1) 24 (21.8) 50 (40.3) 59 (50.0) 59 (50.0) 261 (40.6)
6-10 15 (11.5) 5 (11.9) 30 (27.3) 20 (16.1) 13 (11.1) 31 (26.3) 114 (17.7)
11-15 9 (6.9) 3 (7.2) 13 (11.8) 7 (5.7) 7 (5.9) 9 (7.7) 48 (7.5)
16-20 25 (19.2) 4 (9.5) - 8 (6.5) 8 (6.8) 2 (1.6) 47 (7.4)
≥21 21 (16.2) 3 (7.2) 1 (0.9) 15 (12.1) 6 (5.1) 1 (0.8) 47 (7.4)
a) Hospital Survey on Patient Safety Culture (HSOPSC): electronic tool to assess the patient safety culture, based on a previously adapted version.12
and degrees of freedom <3 (X2/gl=2.82; p-value<0.001). The RMSEA criterion reinforced that the model tested was good, since the p-value found was over 0.05, highlighting failure in refute the null hypothesis, supporting the model tested (estimate=0.046/90%CI=0.044;0.048; RMSEA probability ≤0.05=0.998). Two other tests also confirmed the adequacy of the multidimensional model, presenting values from 0.90 to 0.95 (CFI=0.944 and TLI=0.936).
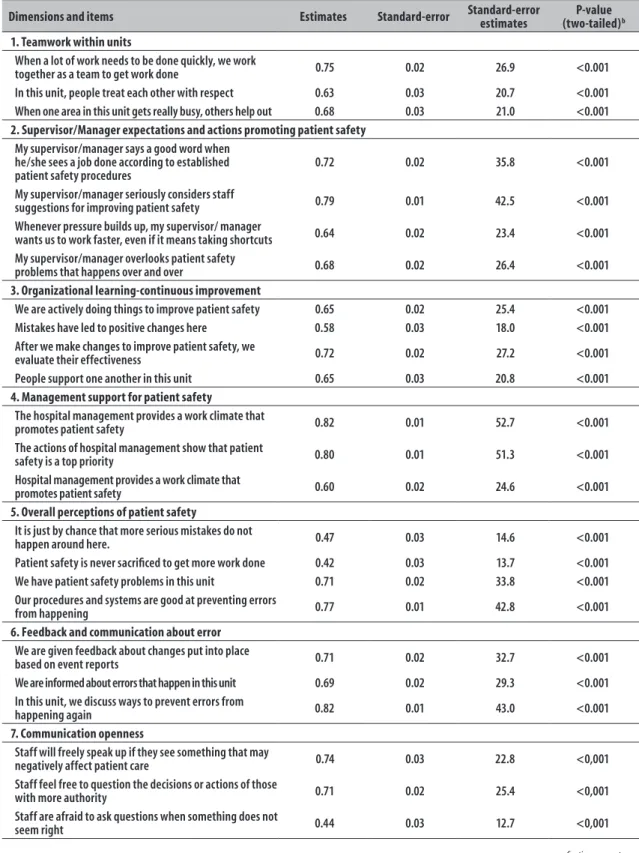
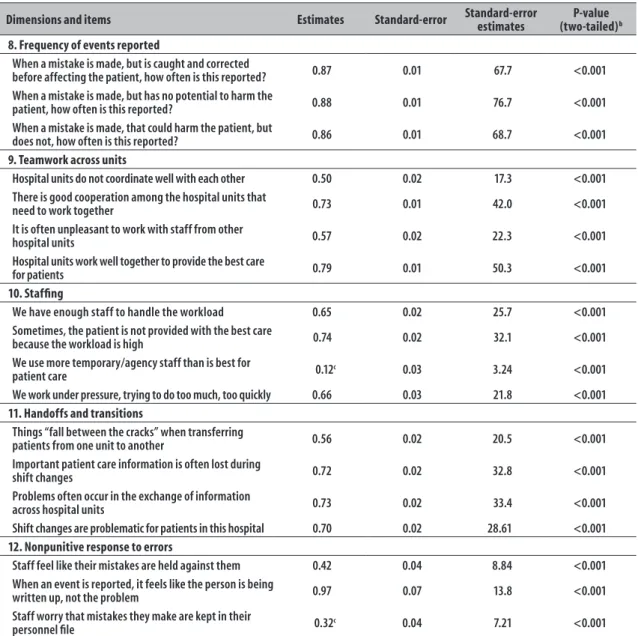
The standard model shows that almost all the indicators – except the questions ‘We use more temporary/agency staff than is best for patient care’ and ‘Staff worry that mistakes they make are kept in their personnel file’ – presented factorial load over 0.40, showing weak indicators for their respective factors.
However, as there are statistically significant factorial loads (p<0.05), they could be kept as indicators in the confirmatory factor analysis (Table 3). The tool also presented better psychometric properties than the first Brazilian version12,13 (Table 4).
Discussion
Table 2 – Reliability of the dimensions of the Portuguese version on the Hospital Survey on Patient Safety Culture (HSOPSC),a according to data from the municipality of Natal, Rio Grande do Norte, 2015
Dimensions and items
Correlation between the item and the total
dimension
Cronbach's alpha after the item exclusion
Cronbach's alpha of the dimension
1. Teamwork within units 0.70
People support one another in this unit 0.46 0.66
When a lot of work needs to be done quickly, we work
together as a team to get work done. 0.54 0.61
In this unit, people treat each other with respect. 0.46 0.66
When one area in this unit gets really busy,
others help out. 0.52 0.62
2. Supervisor/Manager expectations and actions promoting patient safety 0.73
My supervisor/manager says a good word when he/she sees a
job done according to established patient safety procedures 0.51 0.67
My supervisor/manager seriously considers staff
suggestions for improving patient safety 0.64 0.59
Whenever pressure builds up, my supervisor/ manager
wants us to work faster, even if it means “taking shortcuts” 0.42 0.71
My supervisor/manager overlooks patient safety
problems that happens over and over 0.50 0.67
3. Organizational learning/ continuous improvement 0.61
We are actively doing things to improve patient safety 0.42 0.51
Mistakes have led to positive changes here 0.41 0.53
After we make changes to improve patient safety, we
evaluate their effectiveness 0.44 0.49
4. Management support for patient safety 0.74
Hospital management provides a work climate that
promotes patient safety 0.60 0.61
The actions of hospital management show that patient
safety is a top priority 0.63 0.68
Hospital management seems interested in patient safety
only after an adverse event happens 0.48 0.76b
5. Overall perceptions of patient safety 0.63
It is just by chance that more serious mistakes do not
happen around here. 0.31 0.63
Patient safety is never sacrificed to get more work done 0.30 0.64b
We have patient safety problems in this unit 0.55 0.45
Our procedures and systems are good at preventing errors
from happening 0.51 0.49
6. Feedback and communication about error 0.74
We are given feedback about changes put into place
based on event reports 0.56 0.66
We are informed about errors that happen in this unit 0.57 0.65
In this unit, we discuss ways to prevent errors from
happening again 0.57 0.66
7. Communication openness 0.59 0,59
Staff will freely speak up if they see something that may
negatively affect patient care 0.44 0.44
Staff feel free to question the decisions or actions of those
with more authority 0.42 0.47
Staff are afraid to ask questions when something does not
seem right 0.35 0.56
Table 2 – Conclusion
Dimensions and items
Correlation between the item and the total
dimension
Cronbach's alpha after the
item exclusion Cronbach's alpha of the dimension
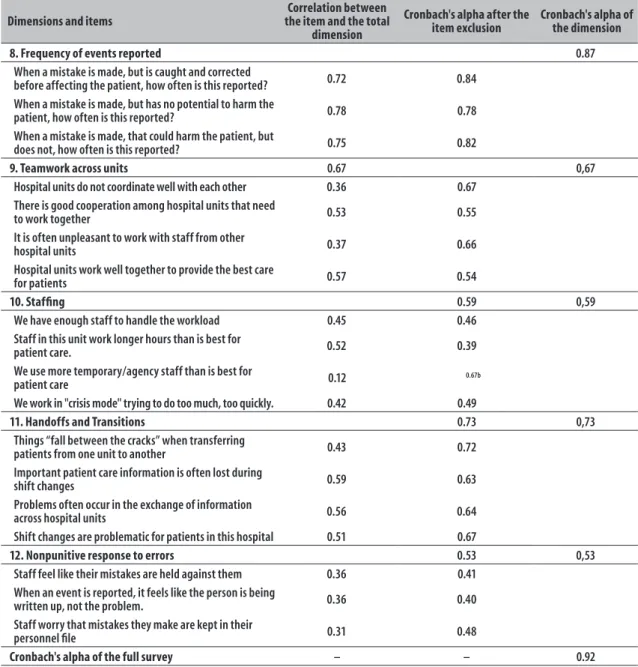
8. Frequency of events reported 0.87
When a mistake is made, but is caught and corrected
before affecting the patient, how often is this reported? 0.72 0.84
When a mistake is made, but has no potential to harm the
patient, how often is this reported? 0.78 0.78
When a mistake is made, that could harm the patient, but
does not, how often is this reported? 0.75 0.82
9. Teamwork across units 0.67 0,67
Hospital units do not coordinate well with each other 0.36 0.67
There is good cooperation among hospital units that need
to work together 0.53 0.55
It is often unpleasant to work with staff from other
hospital units 0.37 0.66
Hospital units work well together to provide the best care
for patients 0.57 0.54
10. Staffing 0.59 0,59
We have enough staff to handle the workload 0.45 0.46
Staff in this unit work longer hours than is best for
patient care. 0.52 0.39
We use more temporary/agency staff than is best for
patient care 0.12 0.67b
We work in "crisis mode" trying to do too much, too quickly. 0.42 0.49
11. Handoffs and Transitions 0.73 0,73
Things “fall between the cracks” when transferring
patients from one unit to another 0.43 0.72
Important patient care information is often lost during
shift changes 0.59 0.63
Problems often occur in the exchange of information
across hospital units 0.56 0.64
Shift changes are problematic for patients in this hospital 0.51 0.67
12. Nonpunitive response to errors 0.53 0,53
Staff feel like their mistakes are held against them 0.36 0.41
When an event is reported, it feels like the person is being
written up, not the problem. 0.36 0.40
Staff worry that mistakes they make are kept in their
personnel file 0.31 0.48
Cronbach's alpha of the full survey – – 0.92
a) Hospital Survey on Patient Safety Culture (HSOPSC): electronic tool to assess the patient safety culture, based on a previously adapted version.12 b) Values which the internal consistency would change with the item removal.
The tool presented better psychometric properties than the first Brazilian version.12,13 This may be, in part, due to the improvement opportunities from the initial stage of translation,14 which aimed to reduce ambiguities and improve terminology, resulting in a more clear text and similar with the original propose.15 As examples of such improvements, we can cite the expression ‘events report’, which was replaced by ‘events notification’, aligned with the jargon of adverse events used in Brazil.22 The
expression ‘report’ does not imply that the occurrence has been notified in data records, different from what is intended with organizational learning, through the investigation of causes and actions, with the objective of reducing health risk.
Table 3 – Standard factorial loads for items of the Hospital Survey on Patient Safety Culture (HSOPSC),a applied
in the municipality of Natal, Rio Grande do Norte, 2015
Dimensions and items Estimates Standard-error Standard-error estimates (two-tailed)P-value b
1. Teamwork within units
When a lot of work needs to be done quickly, we work
together as a team to get work done 0.75 0.02 26.9 <0.001
In this unit, people treat each other with respect 0.63 0.03 20.7 <0.001
When one area in this unit gets really busy, others help out 0.68 0.03 21.0 <0.001
2. Supervisor/Manager expectations and actions promoting patient safety My supervisor/manager says a good word when
he/she sees a job done according to established patient safety procedures
0.72 0.02 35.8 <0.001
My supervisor/manager seriously considers staff
suggestions for improving patient safety 0.79 0.01 42.5 <0.001
Whenever pressure builds up, my supervisor/ manager
wants us to work faster, even if it means taking shortcuts 0.64 0.02 23.4 <0.001
My supervisor/manager overlooks patient safety
problems that happens over and over 0.68 0.02 26.4 <0.001
3. Organizational learning-continuous improvement
We are actively doing things to improve patient safety 0.65 0.02 25.4 <0.001
Mistakes have led to positive changes here 0.58 0.03 18.0 <0.001
After we make changes to improve patient safety, we
evaluate their effectiveness 0.72 0.02 27.2 <0.001
People support one another in this unit 0.65 0.03 20.8 <0.001
4. Management support for patient safety
The hospital management provides a work climate that
promotes patient safety 0.82 0.01 52.7 <0.001
The actions of hospital management show that patient
safety is a top priority 0.80 0.01 51.3 <0.001
Hospital management provides a work climate that
promotes patient safety 0.60 0.02 24.6 <0.001
5. Overall perceptions of patient safety
It is just by chance that more serious mistakes do not
happen around here. 0.47 0.03 14.6 <0.001
Patient safety is never sacrificed to get more work done 0.42 0.03 13.7 <0.001
We have patient safety problems in this unit 0.71 0.02 33.8 <0.001
Our procedures and systems are good at preventing errors
from happening 0.77 0.01 42.8 <0.001
6. Feedback and communication about error We are given feedback about changes put into place
based on event reports 0.71 0.02 32.7 <0.001
We are informed about errors that happen in this unit 0.69 0.02 29.3 <0.001
In this unit, we discuss ways to prevent errors from
happening again 0.82 0.01 43.0 <0.001
7. Communication openness
Staff will freely speak up if they see something that may
negatively affect patient care 0.74 0.03 22.8 <0,001
Staff feel free to question the decisions or actions of those
with more authority 0.71 0.02 25.4 <0,001
Staff are afraid to ask questions when something does not
seem right 0.44 0.03 12.7 <0,001
Table 3 – Conclusion
Dimensions and items Estimates Standard-error Standard-error estimates (two-tailed)P-value b
8. Frequency of events reported
When a mistake is made, but is caught and corrected
before affecting the patient, how often is this reported? 0.87 0.01 67.7 <0.001
When a mistake is made, but has no potential to harm the
patient, how often is this reported? 0.88 0.01 76.7 <0.001
When a mistake is made, that could harm the patient, but
does not, how often is this reported? 0.86 0.01 68.7 <0.001
9. Teamwork across units
Hospital units do not coordinate well with each other 0.50 0.02 17.3 <0.001
There is good cooperation among the hospital units that
need to work together 0.73 0.01 42.0 <0.001
It is often unpleasant to work with staff from other
hospital units 0.57 0.02 22.3 <0.001
Hospital units work well together to provide the best care
for patients 0.79 0.01 50.3 <0.001
10. Staffing
We have enough staff to handle the workload 0.65 0.02 25.7 <0.001
Sometimes, the patient is not provided with the best care
because the workload is high 0.74 0.02 32.1 <0.001
We use more temporary/agency staff than is best for
patient care 0.12c 0.03 3.24 <0.001
We work under pressure, trying to do too much, too quickly 0.66 0.03 21.8 <0.001
11. Handoffs and transitions
Things “fall between the cracks” when transferring
patients from one unit to another 0.56 0.02 20.5 <0.001
Important patient care information is often lost during
shift changes 0.72 0.02 32.8 <0.001
Problems often occur in the exchange of information
across hospital units 0.73 0.02 33.4 <0.001
Shift changes are problematic for patients in this hospital 0.70 0.02 28.61 <0.001
12. Nonpunitive response to errors
Staff feel like their mistakes are held against them 0.42 0.04 8.84 <0.001
When an event is reported, it feels like the person is being
written up, not the problem 0.97 0.07 13.8 <0.001
Staff worry that mistakes they make are kept in their
personnel file 0.32
c 0.04 7.21 <0.001
a) Hospital Survey on Patient Safety Culture (HSOPSC): electronic tool to assess the patient safety culture, based on a previously adapted version.12 b) Z test for factorial loads with 5% significance level.
c) Factorial loads under 0.4.
usually high when there is a higher number of items. About the dimensions with lower values on reliability (Cronbach's alpha), ‘Nonpunitive response to error’, ‘Communication openness’, and ‘Staffing’, we should take other factors possibly related into consideration. The first dimension aforementioned – ‘Nonpunitive response to error’ – also presents issues related to low reliability in other studies.17,23
Concerning ‘Communication openness’, the value obtained may be related to the proposed translation or even to the culture variation, capable of interfering on
Regarding the dimension ‘Nonpunitive response to error’, there are some important aspects to consider. This dimension was also little consistent (Cronbach's alpha <0.60) in the other Brazilian adaptation,12 which may show little applicability of the items for the Brazilian context. A reason for this finding may be found in the Brazilian punitive culture, which induces respondents to omit non-consistent answers in all three items of this dimension.
The concept analysis and per items, the semantic analysis by the specialists group, the translations proofreading12,15,17 and the factor analysis conducted confirmed the multidimensional structure of the survey, leading to the consensus that if it was adapted to the national context, there would be impairments in the comparison with other studies. Other assessments conducted24,25 showed that the design composed by 12 dimensions of the original instrument were not applicable to other countries’ realities. In the validation of this instrument in Holland,25 for example, the best adjusted model presented 11 dimensions. Another validation, conducted in Germany,24 also obtained a dimension structure smaller than the original: the German tool presented eight dimensions after adjustment. Therefore, when compared to other studies,24,25 the
validation proposed in this research is closer to the original, conducted by AHRQ.9
The computer program developed for this study may help the collection and data analysis, reduce the application costs and enable the monitoring of patient safety culture in Brazilian hospitals. Notwithstanding, this study presented some limitations. One of them is a time limitation, given the dynamic characteristic of safety culture: it is possible that the items and questions considered valid now, may become obsolete with the development of safety culture in Brazilian hospitals. Another limitation is operational: some professionals who are not used to accessing their e-mails may not have answered the survey sent to them. The disadvantage of a low response rate of electronic surveys, compared to paper-based surveys, may be solved with data collection in person.26 This type of collection, by mobile electronic devices, increases the response rate and does not hamper the efficacy of electronic collection and analysis.
We recommend health managers interested in using this assessment tool to, initially, confirm with their staff their electronic addresses. They should also provide electronic devices (computers, tablets, or smartphones) so the staff can fill in the survey in their workplace, to stimulate responses and to obtain information on the
Table 4 – Reliability measured by Cronbach's alpha per dimension of the original survey, other Brazilian studies and the present study conducted in the municipality of Natal, Rio Grande do Norte, 2015
Dimension Number of items Original USAa,9 Brazilian
Adaptation
Brazilian reliability
studyb,23 Present study
Frequency of reported events 3 0.84 0.91 0.91 0.87
Overall perceptions of patient safety 4 0.74 0.52c 0.52c 0.63
Expectations and actions of the unit/service
direction/supervision that favor safety 4 0.75 0.76 0.76 0.73
Organizational learning/ continuous improvement 3 0.76 0.56c 0.56c 0.61
Team work at the unit/service 4 0.83 0.66c 0.66c 0.70
Communication openness 3 0.72 0.69 0.69 0.59
Feedback and communication about error 3 0.78 0.72c 0.72c 0.74
Nonpunitive response to errors 3 0.79 0.35c 0.35c 0.53
Staffing 4 0.63 0.20c 0.20c 0.59
Management support for patient safety 3 0.83 0.84 0.84 0.74
Teamwork across units 4 0.80 0.67 0.67 0.67
Handoffs and Transitions 4 0.80 0.70c 0.69c 0.73
Total 42 – 0.90c 0.91c 0.92
a) USA: United States
patient safety culture in the assessed hospital. The access to these data and the full diagnose about the safety culture of the assessed institution provide subsidies to intervention plans in the dimensions diagnosed with culture problems, improving the patient safety and the quality of the health care provided.
This study presents the Hospital Survey on Patient Safety Culture – HSOPSC – as a valid and reliable tool, with suitable psychometric properties for the assessment of patient safety culture in Brazilian hospitals. Regarding the feasibility of the survey, we recommend the data collection to be done by e-mail and, if necessary, in person too, to achieve a higher number of responses. It is important to highlight that the computer program developed by the proposed tool counts with an automatic analysis tool, which makes the data collection easier and helps hospital managers build reports, improving
feedback to the staff and directors about their actions related to hospital patient safety culture.
Authors’ contributions
Andrade LEL, Melo LOM, Silva IG, Souza RM, Freitas MR, Batista AM contributed to conception and design of the study and critical review of the manuscript’s intellectual content. Lima ALB contributed to the critical review if the intellectual content, analysis and interpretation of the results. Gama ZAS contributed to the conception and design of the study, critical review if the intellectual content, analysis and interpretation of the results. All the authors participated in the manuscript’s writing, approved its final version and declared to be responsible for all aspects of the study, ensuring its accuracy and integrity.
1. Mendes W, Martins M, Rozenfeld S, Travassos C. The assessment of adverse events in hospitals in Brazil. Int J Qual Health Care. 2009 Aug;21(4):279-84.
2. Institute of Medicine, Kohn LT, Corrigan JM, Donaldson MS.To err is human: building a safer health system. Washington: National Academies Press; 2000.
3. Reis CT, Martins M, Languardia J. A segurança do paciente como dimensão da qualidade do cuidado em saúde: um olhar sobre a literatura. Cienc Saude Coletiva. 2013 jul;8(7):2029-36.
4. Sammer CE, Lykens K, Singh KP, Mains DA, Lackan NA. What is patient safety culture? A review of the literature. J Nurs Scholarsh. 2010 Jun;42(2):156-65.
5. Health and Safety Commission Advisory Committee on the Safety of Nuclear Installations. Organizing for safety: third report of the ACSNI study group on human factors. Sudbury: HSE Books; 1993.
6. National Quality Forum. Safe practices for healthcare – 2010 update: a consensus report. Washington: The National Quality Forum; 2010.
7. Brasil. Ministério da Saúde. Portaria nº 529, de 1º de abril de 2013. Institui o Programa Nacional de Segurança do Paciente (PNSP). Diário Oficial da República Federativa do Brasil, Brasília (DF), 2013 abr 2; Seção 1:43.
8. Brasil. Ministério da Saúde. Resolução da Diretoria Colegiada nº 36 de 25 de julho de 2013. Institui ações para a segurança do paciente em serviços de
saúde e dá outras providências. Diário Oficial da República Federativa do Brasil, Brasília (DF), 2013 jul 26;Seção 1:32.
9. Agency for Healthcare Research and Quality. Hospital Survey on Patient Safety Culture. Rockville: Agency for Healthcare Research and Quality; 2004.
10. Occelli P, Quenon JL, Kret M, Domecq S, Delaperche F, Claverie, O, et al. Validation of the french version of the Hospital Survey on Patient Safety Culture questionnaire. Int J Qual Health Care. 2013 Jul;25(4):459-68.
11. Waterson P, Griffiths P, Stride C, Murphy J, Hignett S. Psychometric properties of the Hospital Survey on Patient Safety Culture: findings from the UK. Qual Saf Health Care. 2010 Oct;19(5):e2.
12. Reis CT, Laguardia J, Martins M. Adaptação transcultural da versão brasileira do Hospital Survey on Patient Safety Culture: etapa inicial. Cad Saude Publica. 2012 nov; 28(11):2199-210.
13. Reis CT, Laguardia J, Vasconcelos AGG , Martins M. Realiability validity of the Brazilian version of the Hospital Survey on Patient Safety Culture (HSOPSC): a pilot study. Cad Saude Publica, 2016 Nov;32(11):e00115614
Received on 09/09/2016
Approved on 09/12/2016
15. Gama ZAS, Batista AM, Silva IG, Souza RM, Freitas MR. Adaptação transcultural da versão brasileira do Hospital Survey on Patient Safety Culture: oportunidades de melhoria. Cad Saude Publica. 2013 jul;29(7):1473-7.
16. Saturno PJ. Formação a distância em gestão da qualidade nos serviços de saúde: módulo VI: participação do usuario nos programas de gestão da qualidade: exploração e medição de necesidades, expectativas e satisfação: unidade temática 4: estudo piloto: métodos de validação. 2. ed. Murcia: Universidad de Murcia; 2008.
17. Eiras M. Avaliação da cultura de segurança do doente em meio hospitalar: investigação ação numa unidade de radioterapia [tese]. Lisboa (Portugal): Universidade Nova de Lisboa; 2011.
18. Muthén LK, Muthén BO. How to use a Monte Carlo study to decide on sample size and determine power. Struct Equ Modeling. 2009 Nov;9(4):599-620.
19. Herdman M, Fox-Rushby J, Badia X. A model of equivalence in the cultural adaptation of HRQoL instruments: the universalist approach. Qual Life Res. 1998 May;7(4):323-35.
20. Kline RB. Principles and practice of structural equation modeling. 3. ed. New York: The Guilford Press, 2011. p. 3-427.
21. Hair JR, William B, Babin B, Anderson RE. Análise multivariada de dados. 6.ed. Porto Alegre: Bookman; 2009.
22. Agência Nacional de Vigilância Sanitária. NOTIVISA: Sistema de Notificações em Vigilância Sanitária [Internet]. Brasília: Agência Nacional de Vigilância Sanitária; 2016 [citado 2017 fev 02]. Disponível em: http://www.anvisa.gov.br/hotsite/notivisa/index.htm
23. Silva-Batalha EMS, Melleiro MM. Cultura de segurança do paciente em um hospital de ensino: diferenças de percepção existentes nos diferentes cenários dessa instituição. Texto Contexto Enferm. 2015 abr-jun;24(2):432-41.
24. Pfeiffer Y, Manser T. Development of the German version of the Hospital Survey on Patient Safety Culture: dimensionality and psychometric properties. Saf Sci. 2010 Dec;48(10):1452-62.
25. Smits M, Christiaans-Dingelhoff I, Wagner C, Wal GV, Groenewegen PP. The psychometric properties of the ‘Hospital Survey on Patient Safety Culture’ in Dutch hospitals. BMC Health Serv Res. 2008 Nov; 8:230.