www.clim-past.net/8/1527/2012/ doi:10.5194/cp-8-1527-2012
© Author(s) 2012. CC Attribution 3.0 License.
of the Past
Cascading climate effects and related ecological consequences
during past centuries
B. Naef-Daenzer1, J. Luterbacher2, M. Nuber1, T. Rutishauser3, and W. Winkel4
1Swiss Ornithological Institute, Seerose 1, 6204 Sempach, Switzerland
2Department of Geography, Climatology, Climate dynamics and Climate Change, Justus-Liebig University Giessen,
Senckenbergstrasse 1, 35390 Giessen, Germany
3Institute of Geography and Oeschger Centre for Climate Change Research (OCCR), University of Bern, Hallerstrasse 12,
3012 Bern, Switzerland
4Institute of Avian Research “Vogelwarte Helgoland”, An der Vogelwarte 21, 26386 Wilhelmshaven, Germany
Correspondence to:B. Naef-Daenzer ([email protected]) Received: 4 April 2012 – Published in Clim. Past Discuss.: 7 June 2012
Revised: 10 September 2012 – Accepted: 11 September 2012 – Published: 10 October 2012
Abstract. The interface between climate and ecosystem
structure and function is incompletely understood, partly be-cause few ecological records start before the recent warming phase. Here, we analyse an exceptional 100-yr long record of the great tit (Parus major) population in Switzerland in relation to climate and habitat phenology. Using structural equation analysis, we demonstrate an uninterrupted cascade of significant influences of the large-scale atmospheric cir-culation (North-Atlantic Oscillation, NAO, and North-sea – Caspian Pattern, NCP) on habitat and breeding phenol-ogy, and further on fitness-relevant life history traits within great tit populations. We then apply the relationships of this analysis to reconstruct the circulation-driven component of fluctuations in great tit breeding phenology and productivity on the basis of new seasonal NAO and NCP indices back to 1500 AD. According to the structural equation model, the multi-decadal oscillation of the atmospheric circulation likely led to substantial variation in habitat phenology, pro-ductivity and consequently, tit population fluctuations with minima during the “Maunder Minimum” (∼1650–1720) and the Little Ice Age Type Event I (1810–1850). The warming since 1975 was not only related with a quick shift towards earlier breeding, but also with the highest productivity since 1500, and thus, the impact of the NAO and NCP has con-tributed to an unprecedented increase of the population. A verification of the structural equation model against two in-dependent data series (1970–2000 and 1750–1900) corrobo-rates that the retrospective model reliably depicts the major long-term NAO/NCP impact on ecosystem parameters. The
results suggest a complex cascade of climate effects begin-ning at a global scale and ending at the level of individual life histories. This sheds light on how large-scale climate condi-tions substantially affect major life history parameters within a population, and thus influence key ecosystem parameters at the scale of centuries.
1 Introduction
development of long-term models (e.g. Willis et al., 2007). Recent advances in climate reconstructions into the past open a way to extending the time scale of investigations of climate – ecosystem interactions. Exploring the history of responses of ecological systems to past climate variation may there-fore contribute to understand and scale the actual changes (Willis and Bhagwat, 2010; Willis and MacDonald, 2011), and to assess reaction norms and system resilience (Summers et al., 2012).
The effects of large-scale, fundamental climatic forcing (through atmospheric circulation patterns) on local habitat and the phenology of species may vary over relatively small areas (Saether et al., 2003; Both et al., 2004), and the ef-fect size may vary substantially amongst populations of a species since both the underlying trophic interactions and the plasticity of systems may differ (Visser et al., 2002; Both et al., 2004; Gordo and Sanz, 2006, 2009; Martin, 2007; Char-mantier et al., 2008). Due to the scarceness of data, climate impacts have rarely been tracked down to key parameters of population dynamics such as reproductive (Saether et al., 2003) or survival rates (Catchpole et al., 2000; Grosbois et al., 2006). Consequently, both the history and future of cli-mate forcing on ecosystem function remain highly debated (Martin, 2007).
In birds, response to large-scale climate patterns has been reported for various species (Møller et al., 2010; Visser et al., 2002; Both et al., 2004). For tit species in particular, climate affects the phenology and reproductive traits (Sanz, 2002; Visser et al., 1998, 2002). This suggests that differential phe-nologies of components of the trophic web may lead to a loss of synchronization or even disruption of major trophic rela-tionships (van Dongen, 1997; Visser et al., 1998; Przbylo et al., 2000; Adahl et al., 2006; Drever and Clark, 2007).
Here, we analyse an exceptionally long population record of great tits (Parus major Linnaeus), collected in Switzer-land for the entire 20th century. Specifically, our analysis addresses three main issues: First, we aimed at tracking the effects of two large-scale atmospheric processes, the North Atlantic Oscillation (NAO, e.g. Hurrell, 1995; Wanner et al., 2001; Hurrell et al., 2003) and the North Sea – Caspian Pat-tern (NCP, Kutiel and Benaroch, 2002) on late winter/spring climate conditions, the effect of these envelope factors on the vegetation phenology and the tits’ timing of reproduc-tion, and ultimately, the impact on annual reproductive out-put. Second, we used independent phenological and repro-ductive data series of the habitat, the great tit and the blue tit (Cyanistes caeruleus) to validate the resulting hierarchical model quantitatively. Third, we reconstructed climate-related ecological responses back to 1500 AD by applying the struc-tural equation model from the 20th-century analysis to new reconstructions of monthly NAO and NCP indices. This model was verified using independent data on habitat phe-nology based on historical plant phenological observations for the period 1750–1900.
2 Materials and methods
2.1 Great tit breeding phenology and
population observations
The great tit is a small hole-nesting passerine of deciduous and mixed forests. In Switzerland, the largest proportion of the population (∼75 %) occupies altitudes below 800 m a.s.l. (Schmid et al., 1998). The species’ reproductive ecology is adapted to the quick seasonal changes in the vegetation and food resources in spring (the “caterpillar peak”, Naef-Daenzer and Keller, 1999; Naef-Naef-Daenzer et al., 2004; Char-mantier et al., 2008; Lyon et al., 2008), and the peak in pre-dation rates later in the season (Naef-Daenzer et al., 2001). The initiation of clutches is strongly related to ambient tem-peratures and the phenology of the lower levels of the trophic chain, i.e. the development of tree leaves and phyllophagous invertebrate larvae. These are the main protein supply for egg formation and nestling growth (e.g. Nager and Van Noord-wijk, 1992). Thus, climatic conditions in late winter/early spring play a key role in the cascade of mechanisms influ-encing the annual reproductive performance (Naef-Daenzer and Keller, 1999; Charmantier et al., 2008; Lyon et al., 2008). The nest record scheme of the Swiss Ornithological Insti-tute recorded breeding data of great tits from 1901 to 1999 on standardised nest record cards. No great tit data were available for 22 yr (during world wars and economic crisis), and an overwhelming part of the records was collected after 1945. The records were meticulously checked for inconsis-tencies in the data. We used only records with at least two visits at the nest. The date of first egg (laying date) was calcu-lated by backdating one egg per day from the date of record-ing clutch size. Records with implausible data were rejected, e.g. if the time between laying date and date of reporting brood size was less than a minimum incubation period of 13 days. Where only brood size or number of fledglings was reported, no estimate of the laying date was made. Out of 7429 records, 6276 originating from 348 sites were included in the analysis, 1153 (16 %) records were eliminated due to one or multiple questionable entries.
The analysis includes yearly averages for laying date, clutch size, brood size and number of fledglings over all nests available per year (average n=124 broods, range 1–365). Since the altitudinal distribution of nest sites was constant over the study period, we used uncorrected data on breed-ing phenology. Accordbreed-ing to Dunn and Winkler (1999) we analysed whether years with small annual brood samples (<5 broods,N=16 yr) may bias the statistical results. The respective tests are given in the results section.
2.2 Large-scale atmospheric circulation data
importantly, for winter and early spring climate in Europe (Hurrell, 1995; Wanner et al., 2001). For the analyses and the retrospective modelling back to 1500, we used the se-ries of NAO indices by Luterbacher et al. (2001, available at: http://www.cru.uea.ac.uk/cru/data/naojurg.htm). The data set is monthly resolved back to 1659 and seasonally from 1658 back to 1500. Accordingly, we included late winter/spring NAOI on the basis of December–February indices for 1500– 1658 and average January to April indices from 1659 on.
A second atmospheric teleconnection system between the North Sea and the Caspian Sea (the North Sea – Caspian Pattern NCP, Kutiel and Benaroch, 2002, available at: http: //www.cru.uea.ac.uk/cru/data/ncp/), which is similar to the EU Pattern (Barnston and Livezey, 1987) also affects the air-flow over continental Europe. As with NAOI reconstructions, we reconstructed seasonal NCPI estimates for the period be-fore 1948 on the basis of the pre-1948 station pressure series (Slonosky et al., 1999; Jones et al., 1999; Allan and Ansell, 2006) and other climate proxies back to 1500 (Luterbacher et al., 2000, 2001, 2002, 2004; Xoplaki et al., 2005). The re-construction method and details on underlying data are given in Luterbacher et al. (2001). In its negative stage (i.e. low pressure over the North Sea) the North Sea – Caspian pat-tern amplifies the NAO effects, allowing westerly streams to move farther into the continent, with the effect of above nor-mal precipitation in central Europe (Xoplaki et al., 2004). In the positive state (high pressure over the North Sea) this sys-tem counteracts the NAO effects by directing dry and cool continental air towards Central Europe.
2.3 Local temperature, precipitation and
habitat phenology
Meteorological data were obtained from the Swiss Fed-eral Office for Meteorology and Climatology MeteoSwiss. We included average January to April temperature and average January to April precipitation from the station Bern, Switzerland.
The date of beech (Fagus sylvatica) bud burst is an im-portant trigger for the appearance of invertebrate food for great tits (Naef-Daenzer et al., 2004; Charmantier et al., 2008; Lyon et al., 2008). Since the spring phenologies of the most common deciduous tree species and of their in-vertebrate fauna are strongly correlated (for details see Fis-chbacher et al., 1998), historical data on beech leafing phe-nology are an excellent proxy for the phephe-nology of great tit breeding habitats. The Swiss plant phenological observation network SPN (Defila, 1991; Defila and Clot, 2005) supplied data on plant phenology (www.meteoswiss.ch). We included the yearly average date of bud beech opening (n=39–109 observation sites/year) from the north of the Alps (1951– 1999). Additional phenological records for 1901–1950 were extracted from the Euroclimhist database (Pfister and Diet-rich, 2006). For years without records of beech phenology (n=16), the bud break date was estimated from historical
records of the date of cherry flowering in Liestal, Switzer-land (Defila and Clot, 2005; Rutishauser and Studer, 2007; beech bud break=40.6 + 0.691·date of cherry flowering, R2=0.77,n=49 yr).
2.4 Model validation data
We validated the final model against independent data at two levels. First, we compared structural equation model (SEM) predictions with data of great tit and blue tit lay-ing dates and reproductive output from Braunschweig, Ger-many, 1970–2000 (Winkel and Hudde, 1997). We used av-erage laying date and avav-erage number of fledglings per pair (N=31 yr). Due to the higher latitude the start of reproduc-tion of great tits is generally later in northern Germany com-pared to Switzerland. To correct for this difference, we tested the residual laying date (i.e. laying date minus 31-yr average laying date) and reproductive success against predicted val-ues as calculated from the NAOI and NCPI according to the equations in the final path model. Regression tests after Klei-jnen et al. (1998) were applied to test differences between ob-servations and predictions in respect to average or variance.
Second, we validated the retrospective model with an inde-pendent data series of the onset of spring in Switzerland for the period of 1750–1900 (Rutishauser et al., 2007; available at: http://www.ncdc.noaa.gov/paleo/phenology.html). This spring index was calculated on the basis of 23 overlapping phenological records (for methods and detailed results see Schaber and Badeck, 2002; Rutishauser et al., 2007). Unfor-tunately, results on the reproductive performance of the great tit cannot be verified against independent observations before 1900 due to lack of data.
A drawback in both validation exercises is that the time periods of analysis and validation overlap. Due to lack of perfectly independent data we used great tit breeding data from a distant population that was likely living under similar influence of the NAO/NCP system (Saether et al., 2003; Both et al., 2004). Thus, we cannot fully exclude collinearity with other factors, however, consider this very unlikely.
2.5 Statistical analyses
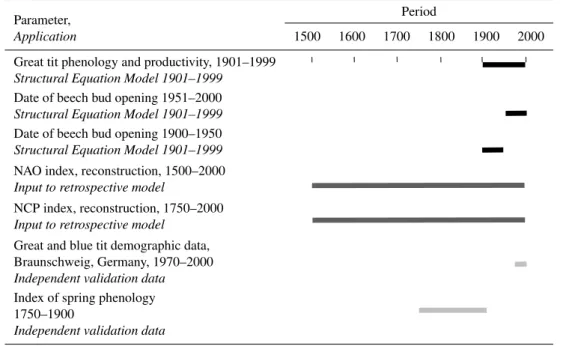
In summary, the data included biotic (plant phenology: beech bud burst; animal phenology: egg laying date; reproduc-tive performance: clutch size, brood size and number of fledglings) and abiotic variables (NAOI, NCPI, station tem-perature and precipitation). The final data set included 77 yr (1901–1999) in which all variables were recorded. We ex-cluded four outliers from the analysis (all outside±2.57 s.d. range,α=0.02; 1 extreme in spring precipitation; 1 extreme in clutch size; 2 extremes in number of nestlings). A system-atic overview of the data sets used in the analysis and models is given in Table 1.
Table 1.Overview of data series used in the analysis and models.
Parameter, Period
Application 1500 1600 1700 1800 1900 2000
Great tit phenology and productivity, 1901–1999
–
Structural Equation Model 1901–1999
Date of beech bud opening 1951–2000
Structural Equation Model 1901–1999
Date of beech bud opening 1900–1950
Structural Equation Model 1901–1999
NAO index, reconstruction, 1500–2000
Input to retrospective model
NCP index, reconstruction, 1750–2000
Input to retrospective model
Great and blue tit demographic data, Braunschweig, Germany, 1970–2000
Independent validation data
Index of spring phenology 1750–1900
Independent validation data
Black bars indicate time series that were used for structural equation model (SEM) analysis. Dark grey bars indicate the two time series that were used as input to the retrospective modelling. Light grey bars indicate the two time series used for model verification.
estimation for taking the hierarchical structure of the mech-anisms into account (StatSoft Inc., 2006). We pre-defined a series of models assuming that all influences act from higher to lower levels of the system (i.e. atmospheric circula-tion→weather→vegetation/birds), but excluded any feed-back upwards in this hierarchy. A set of pre-defined models was based (1) on the preliminary analysis of the effects of the NAOI and NCPI on precipitation and temperature con-ditions, and (2) on existing empirical and experimental ev-idence on the phenology of woodland habitats, and on the effects of the timing of breeding and food availability on clutch size and reproductive output (e.g. Naef-Daenzer et al., 2001; Both et al., 2004; Charmantier et al., 2008). All candidate models assumed that the atmospheric systems had no direct effect on the bird sub-system (e.g. NAOI→Clutch size), because empirical evidence for an underlying mecha-nism is lacking. We used the Bentler-Bonnett Non-normed index (BBnn-index, Bentler and Yuan, 1999) as measure of model fit. Like other information theoretic criteria (e.g. AIC, Anderson and Burnham, 1994), this index rewards model parsimony. We favoured the model with the highest index excluding non-significant partial relationships.
2.6 Retrospective model 1500–2000
The equations of the relationships in the favoured path model (as shown in Fig. 2) were implemented in the modelling package ModelMaker 2.0 (Cherwell Inc., 1995) to allow sim-ulation of the detected long-term effect of the NAO and NCP on variation of great tit breeding parameters over the entire
period for which seasonal estimates of the NAOI and NCPI are available (back to 1500 AD). The simulation did not in-clude any other causal factors as input except NAOI/NCPI. Furthermore, we made no further assumptions, such as on juvenile and adult survival, because these would be entirely speculative. Thus, the simulation addresses partially the forc-ing of the NAO/NCP system on breedforc-ing phenology and productivity. We expressed the expected changes in the pro-ductivity relative to the average annual fecundity of 5.553 chicks per pair (1500–2000). We modelled the cumulative effects of annual variation in productivity as an index set to 100 points in year 2000. Accordingly, this relative index quantifies the partial impact of NAOI and NCPI on a the-oretical population in which all other effects are kept con-stant. The model explicitly excludes habitat changes (such as availability of hospitable forest) and demographic mech-anisms (such as density dependence and survival) that may superimpose, but not conceal, the component effect of NAOI and NCPI because no reliable assumption on the variation of these secondary dynamics over past centuries can be made. We assume that the correlations found for the 1901–1999 pe-riod did not change over the 500-yr pepe-riod covered in the retrospective model. Although atmospheric teleconnections and their impact on surface climate (here late winter/spring temperature and precipitation) may vary over long periods, this likely occurs at a larger time scale than a few centuries (Hurrell and Trenberth, 2010).
moving averages (11-yr averages at ends of time series). Ad-ditionally, we applied 10×2 Fourier series polynomial re-gression to estimate 90 % confidence bands to annual val-ues (TableCurve 2D Ver. 4, AISN Software Inc., Lowell, Oregon, USA).
3 Results
3.1 Structural equation model 1901–1999
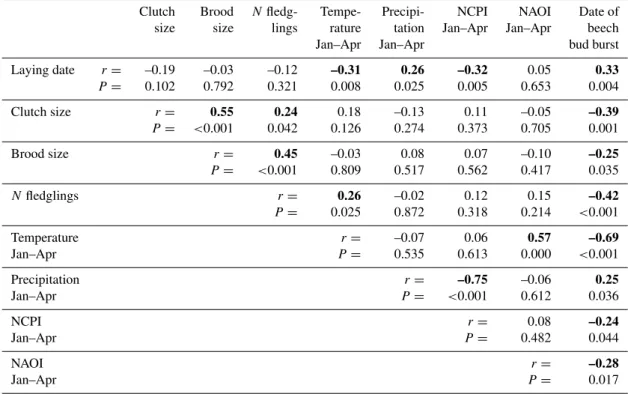
The correlation matrix of all variables that were included in structural equation model selection for the period 1901–1999 indicates strong relationships between the atmospheric oscil-lation indices and spring temperature and precipitation (Ta-ble 2,N=73 yr). Particularly strong were the correlation of the NAOI with spring temperatures (r=0.57, P <0.001), and that of the NCPI with spring precipitation (r= −0.75, P <0.001). Furthermore the habitat phenology was corre-lated with abiotic (temperature and precipitation) and with biotic variables (laying date, reproductive performance).
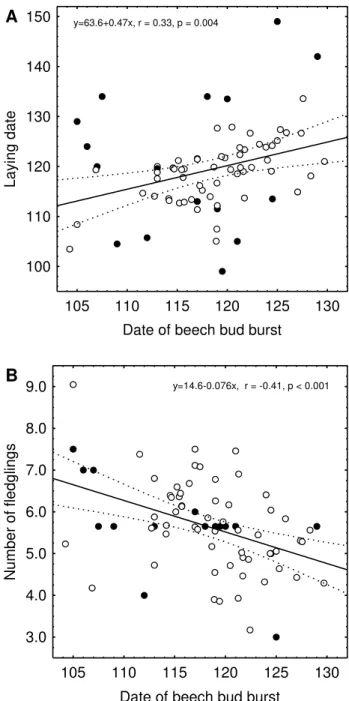
Variables of bird reproduction also showed significant re-lationships with weather and habitat phenology (Table 2). The average annual laying date was correlated with spring temperature (r= −0.31, P =0.008), spring precipitation (r=0.26,P=0.025) and habitat phenology (r=0.33,P= 0.004, Fig. 1a). The average clutch size varied in relation to habitat phenology (r= −0.39,P =0.001), and the average number of chicks fledged per brood was negatively related to habitat phenology (r= −0.42, P <0.001, Fig. 1b) and temperature (r=0.26,P =0.025). At the level of bivariate relationships, including the years with small brood samples increased the variance in most variables, however, caused in-significant changes in regression coefficients (Fig. 1, other correlations not shown). Furthermore, we did not find sig-nificant deviations from linear relationships in either of the pairwise correlations (not shown).
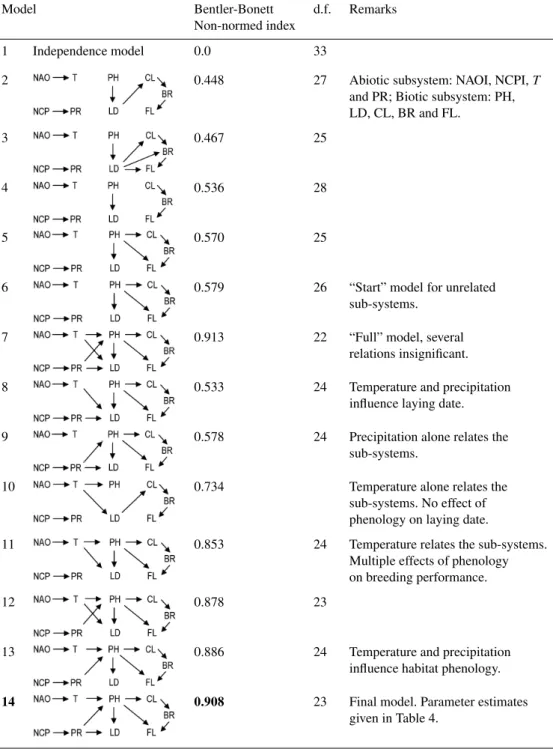
The model selection process started with interactions of the abiotic and biotic sub-systems (models 1–6, Table 3). The purpose of this first step was to clarify the relation-ships within the two sub-systems (first, abiotic factors: atmo-spheric circulation, temperature and precipitation; second, biotic factors: tit phenology and productivity). The results suggest relatively simple relationships between NAOI/NCPI and spring temperature and precipitation. Models assum-ing layassum-ing date as a main determinant of reproductive per-formance received little support (models 2–3, BBnn in-dex 0.448–0.467). The best-supported model in the first set (model 6, Table 3) indicates that habitat phenology is the cen-tral factor for both the timing and success of tit reproduction. This model was used as the “start” model for the second set of candidate models evaluating the relationships among the abiotic and the biotic subsystems (models 7–14, Table 3).
The main link between the abiotic and the biotic sub-systems in the favoured structural equation model (model
105 110 115 120 125 130
Date of beech bud burst 100
110 120 130 140 150
L
a
yin
g
d
ate
y=63.6+0.47x, r = 0.33, p = 0.004
A
105 110 115 120 125 130
Date of beech bud burst 3.0
4.0 5.0 6.0 7.0 8.0 9.0
N
um
ber
of
f
ledgli
n
gs
y=14.6-0.076x, r = -0.41, p < 0.001
B
–
Fig. 1. (a): average annual laying date;(b)average annual number of fledglings per great tit brood in relation to the date of beech bud burst 1901–1999. Circles: years with 5 and more broods included. Dots: years with brood sample size below 5.
Table 2.Matrix of bivariate correlations (Pearson’sr) of the variables included in the structural equation model (SEM).
Clutch Brood Nfledg- Tempe- Precipi- NCPI NAOI Date of
size size lings rature tation Jan–Apr Jan–Apr beech
Jan–Apr Jan–Apr bud burst
Laying date r= –0.19 –0.03 –0.12 –0.31 0.26 –0.32 0.05 0.33
P = 0.102 0.792 0.321 0.008 0.025 0.005 0.653 0.004
Clutch size r= 0.55 0.24 0.18 –0.13 0.11 –0.05 –0.39
P= <0.001 0.042 0.126 0.274 0.373 0.705 0.001
Brood size r= 0.45 –0.03 0.08 0.07 –0.10 –0.25
P= <0.001 0.809 0.517 0.562 0.417 0.035
Nfledglings r= 0.26 –0.02 0.12 0.15 –0.42
P= 0.025 0.872 0.318 0.214 <0.001
Temperature r= –0.07 0.06 0.57 –0.69
Jan–Apr P = 0.535 0.613 0.000 <0.001
Precipitation r= –0.75 –0.06 0.25
Jan–Apr P= <0.001 0.612 0.036
NCPI r= 0.08 –0.24
Jan–Apr P = 0.482 0.044
NAOI r= –0.28
Jan–Apr P= 0.017
N=73yr. Bold print indicates coefficients withP<0.05.
of the variance in late winter/spring temperature (R2=0.31, P <0.001), whereas the NCPI accounted for approximately half of the variance in late winter/spring precipitation (R2=
0.55,P <0.001). Second, late winter/spring temperature and precipitation influenced the date of beech bud burst. Third, the average laying date of great tits was related to habitat phenology, whereas spring temperature had no significant effect on laying dates. In years with warm late winter and spring, beech buds opened significantly earlier, and in turn the average laying date was advanced. The overall variation in average annual laying dates was large (Average Julian lay-ing date = 119.5±8.7 s.d., range 99–149,N=73 yr). Fourth, the analysis revealed a significant impact of the habitat phe-nology on the number of eggs laid and the number of ju-veniles that finally fledged. In years with early tree leafing, the reproductive output was significantly improved (num-ber of fledglings = 14.58–0.076·date of beech bud opening, R2=0.18,P <0.001).
The favoured model supports the hypothesis of a cascade of relationships from large-scale atmospheric circulation in-dices down to great tit breeding phenology and key param-eters of reproductive performance. The effect size for the NAO/NCP impact is strikingly strong. Extremes (±3 s.d.) in NAO and NCP indices result in a differential of 1.1 fledglings per pair or±8.5 % of the long-term average pro-ductivity, keeping all other effects constant. This indicates that the stages of the continental atmospheric circulations may severely shift crucial life history functions and thus,
have a decisive influence of the long-term dynamics and persistence of populations.
To test the robustness of the final model against potential bias from years with small samples of great tit broods, we re-calculated the SEM excluding years with less than 5 broods (N=16). The changes in parameter estimates for each rela-tionship were very small, however, the test statistics for four parameters were insignificant (results not shown). In combi-nation with the bivariate tests for potential biases, we con-clude from these tests that potential bias caused by small sample years was neglectable and that the benefit in statis-tical power from using the data from these years outweighed the increase in (unexplained) variance.
3.2 Independent validation of structural equation
model
Table 3.Model selection results for structural equation models (SEM, Generalized least squares maximum likelihood estimation). First, models 2–6 evaluate the structure within the biotic (habitat-bird) sub-system, excluding climate forcing. Second, the structure of the bi-otic sub-system of model 6 was kept constant to evaluate the effects of atmospheric circulation indices (NAOI/NCPI), climate (tempera-ture/precipitation) and habitat phenology on the breeding phenology and performance. The favoured model 14 is the most parsimonious model without statistically insignificant relations. It indicates that the interface between abiotic and biotic components is via ambient tem-perature and precipitation, both acting on habitat phenology. Factor loadings of model 14 are given in Table 4, the path diagram and
equa-tions in Fig. 2. NAOI=North Atlantic Oscillation index, NCPI=North Sea – Caspian Pattern index,T=temperature, PR=precipitations,
PH=habitat phenology (date of beech bud burst), LD=laying date, CL=clutch size, BR=brood size, FL=number of fledglings.
Model Bentler-Bonett d.f. Remarks
Non-normed index
1 Independence model 0.0 33
2
‘Null’ model for unrelated
‘Full’ model, several relations
0.448 27 Abiotic subsystem: NAOI, NCPI,T
and PR; Biotic subsystem: PH, LD, CL, BR and FL.
3
‘Null’ model for unrelated
‘Full’ model, several relations
0.467 25
4
‘Null’ model for unrelated
‘Full’ model, several relations
0.536 28
5
‘Null’ model for unrelated
‘Full’ model, several relations
0.570 25
6
‘Null’ model for unrelated
‘Full’ model, several relations
0.579 26 “Start” model for unrelated
sub-systems.
7
‘Null’ model for unrelated
‘Full’ model, several relations
0.913 22 “Full” model, several
relations insignificant.
8
‘Null’ model for unrelated
‘Full’ model, several relations
0.533 24 Temperature and precipitation
influence laying date.
9
‘Null’ model for unrelated
‘Full’ model, several relations
0.578 24 Precipitation alone relates the
sub-systems.
10
‘Null’ model for unrelated
‘Full’ model, several relations
0.734 Temperature alone relates the
sub-systems. No effect of phenology on laying date.
11
‘Null’ model for unrelated
‘Full’ model, several relations
0.853 24 Temperature relates the sub-systems.
Multiple effects of phenology on breeding performance.
12
‘Null’ model for unrelated
‘Full’ model, several relations
0.878 23
13
‘Null’ model for unrelated
‘Full’ model, several relations
0.886 24 Temperature and precipitation
influence habitat phenology.
14
‘Null’ model for unrelated
‘Full’ model, several relations
– –
–
Fig. 2.Path diagram and partial equations for the chain of rela-tionships from large-scale atmospheric circulation to great tit re-productive output. For each relationship the equation (in frames) and path coefficients (bold numbers) are given. NAOI indicates North Atlantic Oscillation index; NCPI, North Sea – Caspian
Pattern index; T, Average annual late winter/spring temperature
(January–April); PR, Average annual late winter/spring precipita-tion (January–April); PH, Habitat phenology, average date of beech bud burst; LD, Average annual laying date; CL, Average annual clutch size; BR, Average annual brood size. Arrow colour indicates positive (red) and negative (blue) relationships. For clarity, distur-bances to the variables are not shown. Background colours indicate different stages of the cascade (see also Figs. 3–6).
variation in breeding phenology and reproductive perfor-mance. The local annual variation in these variables is larger than predicted, likely due to variables not represented in the model.
3.3 Retrospective model 1500–2000
The substantial impact of the NAOI/NCPI on the annual vari-ation in fecundity may strongly contribute to long-term fluc-tuations of the great tit population since their stages prevail for decades (Fig. 4a, b). Thus a surplus or a deficit in pop-ulation growth rates of several percent, persisting for many tit generations, may result in marked population trends. To further explore these long-term effects, we used the seasonal indices of both oscillations back to 1500 AD to estimate the multidecadal effects on breeding phenology and fecundity. The retrospective model of the partial NAO/NCP signal in tit phenology and productivity is illustrated in Fig. 4.
–
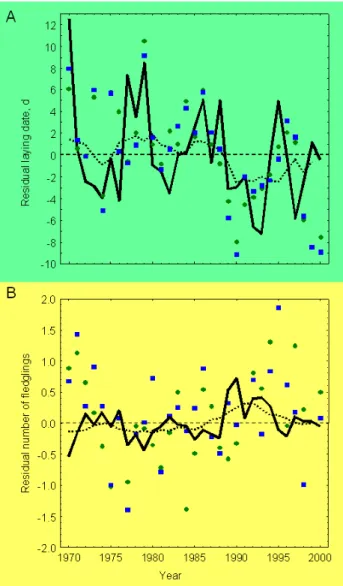
Fig. 3.Validation of structural equation model results against
inde-pendent observational data.(a)Breeding phenology and(b)
repro-ductive output in Braunschweig (Germany) 1970–2000, given as the residual from the overall average for the great tit (circles, 31 yr) and the blue tit (squares). Solid lines give predicted values as calculated from NAOI/NCPI data according to equations in Fig. 1. Dotted lines give 11-yr moving averages of predicted values (declining to 3-yr at end points).
–
Fig. 4.The decadal fluctuation in the North Atlantic Oscillation Index NAOI and the North Sea – Caspian Pattern Index NCPI and their effect on key parameters of the great tit population in Switzerland since 1500 AD. Bold lines give 25-yr moving averages (windows declining to 11 yr at end points). Fine solid lines and dotted lines give the fit and 90 % confidence bands to annual values by 10×2 Fourier series polynomial re-gression.(a)NAOI reconstruction (Luterbacher et al., 2001).(b)NCPI reconstruction (Kutiel and Benaroch, 2002, own data). Note the different scale in the y-axes in(a)and
(b).(c)Standardized residual laying date as modelled from NAOI/NCPI reconstruc-tions and the structural equation model given in Fig. 2. Grey dots give 25-yr moving averages of observed standardized residual laying dates 1901–1999 (intervals declining to 5-yr averages at end points, raw annual observations are given before 1930)(d) stan-dardized residual number of fledglings as modelled from NAOI/NCPI reconstructions and the structural equation model given in Fig. 2. Grey dots give 25-yr moving aver-ages of observed standardized residual number of fledglings 1901–1999 (intervals de-clining to 5-yr averages at end points, raw annual observations are given before 1930).
(e)Component effect of reconstructed NAOI and NCPI on the population fluctuations, expressed as an index set to 100 points in year 2000. The three minima in the popula-tion index coincide with periods in which climatic condipopula-tions in central Europe were harsh: the Maunder Minimum (1650–1720), the Little Ice Age Type Event I (1810– 1850; Wanner et al., 2001), and 1950–1975. Dotted lines give±2 s.e. bands of relative population index (double smoothing applied).
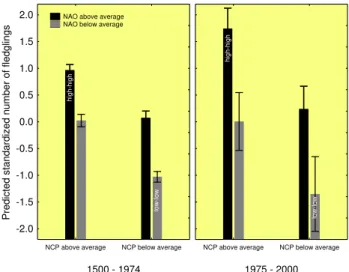
1500 - 1974
NCP above average NCP below average
-2.0 -1.5 -1.0 -0.5 0.0 0.5 1.0 1.5 2.0
P
re
d
icte
d
s
ta
n
d
a
rd
ize
d
n
u
mb
e
r o
f
fle
d
g
lin
g
s
1975 - 2000
NCP above average NCP below average NAO above average
NAO below average
h
ig
h
-h
ig
h
lo
w
-lo
w
lo
w
-lo
w
h
ig
h
-h
ig
h
– –
Fig. 5.Effects of high and low states of the NAOI and NCPI on the predicted annual fecundity of great tits 1500–1974 and 1975–2000, respectively (retrospective model). Coinciding high states (indices
>0) of both oscillations favoured markedly increased predicted an-nual fecundity. When both states were low (indices<0) predicted fecundity was particularly low. After 1975, the effect was reinforced compared to the period 1500–1974. Coinciding high/high states in-dicate relatively warm and dry springs (see also Fig. 2 and Ta-ble 4). No significance tests were performed on predicted values. Bars give annual averages, whiskers denote 95 % confidence inter-vals for means.
one with the Little Ice Age Type Event I (1810–1850, Wan-ner et al., 2001). After 1850, the modelled reproductive per-formance and the relative NAO/NCP population impact in-crease strongly and more or less steadily, except a third min-imum during 1950–1975. In parallel with the strong positive trend of the NAOI from the mid-1970s to the mid-1990s, the model suggests a quick trend towards very early laying dates and a dramatic increase in reproductive output, which both exceed the range of variation over the past centuries (Fig. 4a, c and d).
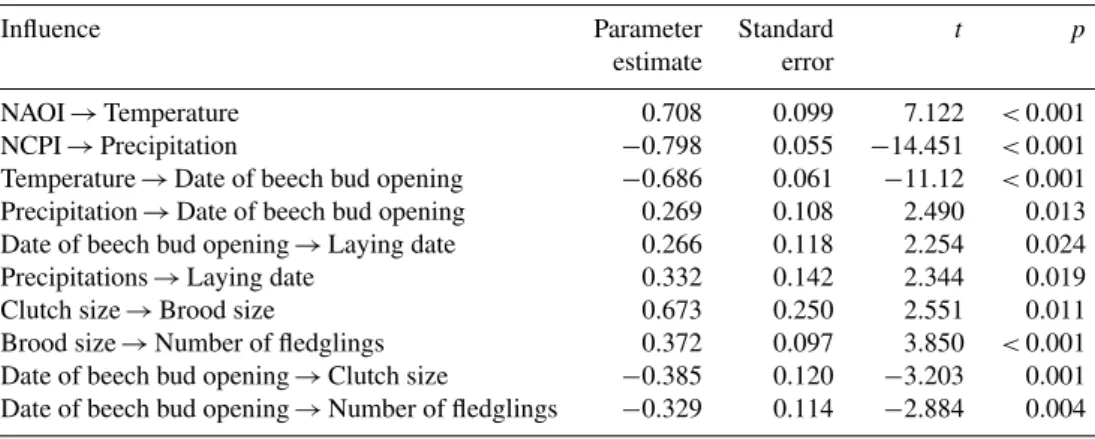
Table 4.Parameter estimates for the favoured model 14 as in Table 3.N=73 yr.
Influence Parameter Standard t p
estimate error
NAOI→Temperature 0.708 0.099 7.122 <0.001
NCPI→Precipitation −0.798 0.055 −14.451 <0.001
Temperature→Date of beech bud opening −0.686 0.061 −11.12 <0.001
Precipitation→Date of beech bud opening 0.269 0.108 2.490 0.013
Date of beech bud opening→Laying date 0.266 0.118 2.254 0.024
Precipitations→Laying date 0.332 0.142 2.344 0.019
Clutch size→Brood size 0.673 0.250 2.551 0.011
Brood size→Number of fledglings 0.372 0.097 3.850 <0.001
Date of beech bud opening→Clutch size −0.385 0.120 −3.203 0.001
Date of beech bud opening→Number of fledglings −0.329 0.114 −2.884 0.004
–
–
Fig. 6. Verification of the habitat phenology in the retrospective model against independent data on spring phenology 1750–1900. Blue line: modelled average laying date of great tits. Black line: index of spring phenology according to Rutishauser et al. (2007). Both indices are given as the standardized residual deviation from the long-term (1750–1900) average laying date and spring index, respectively.
3.4 Verification of the retrospective model against independent data
No validation data of bird phenology and productivity are available prior to 1900. However, the estimates of habi-tat phenology from the retrospective model were validated against an independent data series of spring phenology 1750– 1900. This period includes the Little Ice Age Event I cool-ing. At the interannual level, the modelling results are sig-nificantly correlated with the Rutishauser et al. (2007) spring index (R2=0.11,n=151 yr,P <0.001), however, the
re-lationship is weak. At a multidecadal level (25-yr moving averages), model estimations and validation data agree well (R2=0.32,n=141 yr (no moving averages were calculated at series edges),P <0.001, Fig. 6). This suggests that the retrospective model appropriately assessed the variation in
bird breeding phenology, including warming and cooling episodes.
Qualitative evidence supports the model results of great tit production for the 19th century where no quantitative data are available. The British and European great tit populations likely decreased markedly in the first half of the 19th cen-tury, whereas after 1850 populations increased and expanded continually (Alexander and Lack, 1944; Kalela, 1950). This agrees with our reconstruction of the NAOI/NCPI-related variation of population dynamics from 1800 to present (Fig. 4d), and with the verification series of spring phenol-ogy by Rutishauser et al. (2007). We are not aware of any evidence for bird population trends before 1800.
4 Discussion and conclusions
4.1 Structural equation model 1901–1999
atmospheric oscillations may act similarly on many species in that they determine fundamental conditions at the scale of decades and operate at the top of cascades that include large-scale weather conditions, local trophic webs and in turn, en-ergetic conditions for reproduction. Huntley et al. (2008) cal-culated predictions for changing species distribution ranges on the basis of climatic envelopes for a large proportion of European breeding birds.
The data of habitat and bird phenological data available in Switzerland during the 20th century allowed structural modelling of past climate – ecosystem relationships over an exceptionally long period, including decades before the onset of the recent warming phase. Our results provide in-sight into the network of causal mechanisms that links at-mospheric circulation patterns and bird population dynam-ics. They indicate that the habitat phenology plays a key role in the phenology of the entire trophic chain, and ultimately influences the final reproductive output of great tits. Further-more, our results suggest a large plasticity of the great tit breeding system. For example, the average laying date var-ied by 19.5 days (10 %–90 % range). The relationship be-tween beech bud burst and great tit start of laying was linear over this entire range, indicating no apparent limitation of the plasticity of the system within the range of variation of climate factors included in the analysis.
The structural equation model, including variables rang-ing from large-scale atmospheric circulation patterns to individual-scale life history processes, can neither proof the causal mechanisms linking the parts of the path model, nor can it include all steps of the trophic cascade. However, in the case of the great tit, a large record of experimental and observational evidence supports the findings at different lev-els of this system. Laying dates and reproductive success of the birds are particularly strongly related to the lower levels of the trophic chain (Nilsson and K¨allander, 2006). Experi-mental manipulation of ambient temperatures did not affect laying dates, but influenced the egg formation process and clutch sizes (Nager and Van Noordwijk, 1992). This supports the notion that habitat phenology and the related phenol-ogy of protein food resources (the “caterpillar peak”, Naef-Daenzer and Keller, 1999; Charmantier et al., 2008; Lyon et al., 2008) rather than temperature alone are the key ecolog-ical factors linking climate and great tit life histories. The validation of the structural model with independent data also corroborates the results of our analysis.
4.2 Retrospective model 1500–2000
Given the significant effect on average annual habitat phenol-ogy and tit reproductive performance, the NAOI and NCPI likely drive substantial long-term ecological fluctuations, since their stages prevail for long periods (Fig. 4). The retro-spective model further extends the view by including multi-ple cycles of positive and negative stages of both atmospheric oscillations. Thus, reconstructions of past climate conditions,
here monthly data for NAOI and NCPI, allowed to estimate ecological climate effects for the past half millennium. This emphasizes that the marked changes from 1975 on exceed the range of variation under past climate conditions.
In particular, the minima in tit productivity (and nega-tive population growth rates) were correlated with periods with a late average begin of laying, and coincided with well-documented episodes of harsh weather conditions in Europe, such as the Maunder Minimum (1650–1720) and the Little Ice Age Type Event I (1810–1850). The model indicates mul-tiple periods during which the annual breeding performance deviated by up to 0.5 standard deviations from the long-term average (note that Fig. 3 gives 25-yr moving averages). A striking result is that the model, using seasonal NAOI and NCPI indices as the only input, also appropriately returned the shift towards an early onset of breeding and high produc-tivity from 1975 on. For the post-1975 period, the NAO/NCP indices predict that laying dates have advanced by 0.6 dard deviations, and reproductive rates increased by 1.2 stan-dard deviations compared to the 500-yr average. As illus-trated in Fig. 5, the reinforcing effect of the stages of the two oscillations was markedly increased for the post-1975 period. The causes of this are unclear. We conclude that over the past half millennium, the NAOI and the NCPI accounted for substantial variation in ecosystem structure and function, in particular the phenology of the habitat and important life history traits of its inhabitants.
mitigate climate forcing on reproductive performance and thus, population persistence in various species (see also Nott et al., 2002; Both et al., 2004). The analysis of climate – ecol-ogy relationships over the past half millennium suggests that the recent changes in European woodland habitats and re-lated trends in bird populations exceed the range of variation in the past. Future increase in anthropogenic greenhouse gas concentrations is likely to induce a positive trend in the win-ter NAOI (Meehl et al., 2007), and thus, amplification of the trend in great tit productivity and phenology since 1975.
Acknowledgements. We thank Christian Pfister and Claudio Defila for providing habitat phenological data from the Euroclimhist database and the Swiss Plant Phenological Network. We are grate-ful to R. Fuller, M. Grosjean, J. Kaplan, Ch. K¨orner, T. F. Stocker, A. J. van Noordwiik and D. Winkler for helpful discussions on an earlier version of the manuscript. J. Guiot and two reviewers suggested valuable improvements of the paper. J. L. acknowledges support from the EU/FP7 project ACQWA (NO212250). J. L. also acknowledges support from the DFG Projects PRIME 1 and 2 (“Precipitation in the past millennium in Europe” and “Precipitation In past Millennia in Europe- extension back to Roman times”, LU1608/1-1, AOBJ: 568460) within the Priority Programme “INTERDYNAMIK” and “Historical climatology of the Middle East based on Arabic sources back to ad 800” (LU 1608/2-1 AOBJ 575150). J. L. also acknowledges support from the Hessian Centre on Climate Change and Geology through the project “Climate Change and Extreme Weather in Hesse – Analysis of observation data and ensemble projections for the 21st century”.
Edited by: J. Guiot
References
Adahl, E., Lundberg, P., and Jonz´en, N.: From climate change to population change: the need to consider annual life cycles, Glob. Change Biol., 9, 1627–1633, 2006.
Alexander, W. B. and Lack, D.: Changes in status among British breeding birds, Brit. Birds, 38, 62–69, 1944.
Allan, R. and Ansell, T.: A new globally complete monthly histor-ical gridded mean sea level pressure dataset (HadSLP2): 1855– 2004, J. Climate, 19, 5816–5842, 2006.
Anderson, D. R. and Burnham, K. P.: AIC model selection in overdispersed capture-recapture data, Ecology, 75, 1780–1793, 1994.
Barnston, A. G. and Livezey, R. E.: Classification, seasonality and persistence of low frequency atmospheric circulation patterns, Mon. Weather Rev., 115, 1825–1850, 1987.
Bentler, P. M. and Yuan, K.-H.: Structural Equation Modelling with Small Samples: Test Statistics, Multivar. Behav. Res., 34, 181– 197, 1999.
Both, C., Artemyev, A. V., Blaauw, B., Cowie, R. J., Dekhuijzen, A. J., Eeva, T., Enemar, A., Gustafsson, L., Ivankina, E. V., J¨arvinen, A., Metcalfe, N. B., Nyholm, N. E. I., Potti, J., Ravussin, P.-A., Sanz, J. J., Silverin, B., Slater, F. M., Sokolov, L. V., T¨or¨ok, J., Winkel, W., Wright, J., Zang, H., and Visser, M. E.: Large-scale
geographical variation confirms that climate change causes birds to lay earlier, P. Roy. Soc. B, 271, 1657–1662, 2004.
Catchpole, E. A., Morgan, B. J. T, and Coulson, T. N.: Factors in-fluencing soay sheep survival, Appl. Statist., 49, 453–472, 2000. Charmantier, A., McCleery, R. H., Cole, L. R., Perrins, C., Kruuk, L. E. B., and Sheldon, B. C.: Adaptive phenotypic plasticity in response to climate change in a wild bird population, Science, 320, 800–803, 2008.
Cherwell Inc.: SB ModelMaker Ver. 2.0. Cherwell Scientific Pub-lishing Ltd, Oxford, 1995.
Crick, H. Q. P., Dudley, C., Glue, D. E., and Thomson, D. L.: UK birds are laying eggs earlier, Nature, 388, 526–526, 1997. Defila, C.: Pflanzenph¨anologie der Schweiz, Ver¨off. Schweiz.
Me-teorol. Ans., 50, 235 pp., 1991.
Defila, C. and Clot, B.: Phytophenological trends in the Swiss Alps, 1951–2002, Meteorol. Z., 14, 191–196 2005.
Drever, M. C. and Clark, R. G.: Spring temperature, clutch initiation date and duck nest success: a test of the mismatch hypothesis, Ecology, 76, 139–148, 2007.
Dunn, P. O. and Winkler, D. W.: Climate change has affected the breeding date of tree swallows throughout North America, P. Roy. Soc. B, 266, 24887–2490, 1999.
Fischbacher, M., Naef-Daenzer, B., and Naef-Daenzer, L.: Estimat-ing caterpillar density on trees by collection of frass droppEstimat-ings, Ardea, 86, 121–129, 1998.
Githaiga-Mwicigi, J. M. W., Fairbanks, D. H. K., and Midgley, G.: Hierarchical processes define spatial pattern of avian assem-blages restricted and endemic to the arid Karoo, South Africa, J. Biogeogr., 29, 1067–1087, 2002.
Gordo, O. and Sanz, J. J.: Climate change and bird phenology: a long-term study in the Iberian Peninsula, Glob. Change Biol., 12, 1993–2004, 2006.
Gordo, O. and Sanz, J. J.: Long-term temporal changes of plant phe-nology in the western Mediterranean, Glob. Change Biol., 15, 1930–1948, 2009.
Grosbois, V., Henry, P. Y., Blondel, J., Perret, P., Lebreton, J.-D., Thomas, D. W., and Lambrechts, M.: Climate impacts on Mediterranean blue tit survival: an investigation across seasons and spatial scales, Glob. Change Biol., 12, 2235–2249, 2006. Huntley, B., Green, R. E., Collingham, Y., and Willis, S. G.: A
climatic Atlas of European breeding birds, Lynx Editions, Bel-laterra, 2008.
Hurrell, J. W.: Decadal trends in the North Atlantic Oscillation and relationships to regional temperature and precipitation, Science, 269, 676–679, 1995.
Hurrell, J. W. and Trenberth, K. E.: Climate change, in: Effects of climate change on birds, edited by: Møller, A. P., Fiedler, W., and Berthold, P., Oxford University Press, 2010.
Hurrell, J. W., Kushnir, Y., Ottersen, G., and Visbeck, M.: The North Atlantic Oscillation. Climatic Significance and Environmental Impact, Am. Geophys. Union, Washington DC, 2003.
E., Kaas, E., Schmith, T., Jacobeit, J., and Beck, C.: Monthly mean pressure reconstruction for Europe 1780–1995, Int. J. Cli-matol., 19, 347–364, 1999.
Kalela, O.: Zur s¨akularen Rhythmik der Arealver¨anderungen eu-rop¨aischer V¨ogel und S¨augetiere, Orn. Fenn., 27, 1–30, 1950. Kleijnen, J. P. C., Bettonvil, B., and Van Groenendal, W.:
Valida-tion of trace-driven simulaValida-tion models: A novel regression test, Manage. Sci., 44, 812–819, 1998.
Kutiel, H. and Benaroch, Y.: North Sea Caspian Pattern (NCP) – an upper level atmospheric teleconnection affecting the eastern Mediterranean: Identification and definition, Theor. Appl. Clima-tol., 71, 17–28, 2002.
Luterbacher, J., Rickli, R., Tinguely, C., Xoplaki, E., Sch¨upbach, E., Dietrich, D., H¨usler, J., Amb¨uhl, M., Pfister, C., Beeli, P., Di-etrich, U., Dannecker, A., Davies, T. D., Jones, P. D., Slonosky, V., Ogilvie, A. E. J., Maheras, P., Kolyva-Machera, F., Martin-Vide, J., Barriendos, M., Alcoforado, M. J., Nunez, F., J´onsson, T., Glaser, R., Jacobeit, J., Beck, C., Philipp, A., Beyer, U., Kaas, E., Schmith, T., B¨arring, L., J¨onsson, P., R´acz, L., and Wanner, H.: Reconstruction of monthly mean sea level pressure over Eu-rope for the Late Maunder Minimum period (1675–1715), Int. J. Climatol., 20, 1049–1066, 2000.
Luterbacher, J., Xoplaki, E., Dietrich, D., Jones, P. D., Davies, T. D., Portis, D., Gonzalez-Rouco, J. F., von Storch, H., Gyalistras, D., Casty, C., and Wanner, H.: Extending North Atlantic Oscillation Reconstructions Back to 1500, Atmos. Sci. Lett., 2, 114–124, doi:10.1006/asle.2002.0047, 2001.
Luterbacher, J., Xoplaki, E., Dietrich, D., Rickli, R., Jacobeit, J., Beck, C., Gyalistras, D., Schmutz, C., and Wanner, H.: Recon-struction of Sea Level Pressure fields over the Eastern North At-lantic and Europe back to 1500, Clim. Dynam., 18, 545–561, 2002.
Luterbacher, J., Dietrich, D., Xoplaki, E., Grosjean, M., and Wan-ner, H.: European seasonal and annual temperature variability, trends, and extremes since 1500, Science, 303, 1499–1503, 2004 Lyon, B. E., Chaine, A. S., and Winkler, D. W.: A matter of timing,
Science, 321, 1051–1052, 2008.
Martin, T. E.: Climate correlates of 20 yr of trophic changes in a high-elevation riparian system, Ecology, 88, 367–380, 2007. Menzel, A., Sparks, T. H., Estrella, N., Koch, E., Aasa, A., Ahas,
R., Alm-K¨ubler, K., Bissolli, P., Braslavsk´a, O., Briede, A., Chmielewski, F. M., Crepinsek, Z., Curnel, Y., Dahl, ˚A., Defila, C., Donnelly, A., Filella, Y., Jatczak, K., M˚age, F., Mestre, A., Nordli, Ø., Pe˜nuelas, J., Pirinen, P., Remiˇsov´a, V., Scheifinger, H., Striz, M., Susnik, A., van Vliet, A. J. H., Wielgolaski, F. E., Zach, S., and Zust, A.: European phenological response to cli-mate change matches the warming pattern, Glob. Change Biol., 2, 1969–1976, 2006.
Meehl, G. A., Stocker, T. F., Collins, W. D., Friedlingstein, P., Gaye, A. T., Gregory, J. M., Kitoh, A., Knutti, R., Murphy, J. M., Noda, A., Raper, S. C. B., Watterson, I. G., Weaver A. J., and Zhao, Z.-C.: Global Climate Projections, in: Climate Change 2007: The Physical Science Basis, Contribution of Working Group I to the Fourth Assessment Report of the Intergovernmental Panel on Climate Change, edited by: Solomon, S., Qin, D., Manning, M., Chen, Z., Marquis, M., Averyt, K. B., Tignor, M., and Miller, H. L., Cambridge University Press, Cambridge, United Kingdom and New York, NY, USA, 2007.
Møller, A. P., Fiedler, W., and Berthold, P. (Eds.): Effects of climate change on birds, Oxford University Press, 2010.
Naef-Daenzer, B. and Keller, L. F.: The foraging performance of great and blue tits (Parus major and P. caeruleus) in relation to caterpillar development, and its consequences for nestling growth and fledging weight, J. Anim. Ecol., 68, 708–718, 1999. Naef-Daenzer, B., Widmer, F., and Nuber, M.: Differential
post-fledging survival of great and coal tits in relation to their con-dition and fledging date, J. Anim. Ecol., 70, 730–738, 2001. Naef-Daenzer, L., Nager, R. G., Keller, L. F., and Naef-Daenzer, B.:
Are hatching delays a cost or a benefit for great tit Parus major parents?, Ardea, 92, 229–238, 2004.
Nager, R. G. and Van Noordwijk, A. J.: Energetic limitations in the egg laying period of the great tit, P. Roy. Soc. Lond. B, 249, 259– 263, 1992.
Nilsson, J. A. and K¨allander, H.: Leafing phenology and timing of egg laying in great tits (Parus major) and blue tits (Parus caeruleus), J. Avian Biol., 37, 357–363, 2006.
Nott, M. P., Desante, D. F., Siegel, R. B., and Pyle, P.: Influences of the El Ni˜no Southern oscillation and the North Atlantic oscil-lation on avian productivity in forests of the pacific northwest of North America, Global Ecol. Biogeogr., 11, 333–342, 2002. Parmesan, C.: Ecological and evolutionary responses to recent
cli-mate change, Annu. Rev. Ecol. Evol. S., 37, 637–669, 2006. Pfister, C. and Dietrich, U. (Eds.): Euro-Climhist: A database on
past weather and climate in Europe and its human dimension, University of Bern, available at: www.euroclimhist.ch (last ac-cess: 9 October 2012), 2006.
Przybylo, R., Sheldon, B. C., and Meril¨a, J.: Climatic effects on breeding and morphology: evidence for phenotypic plasticity, J. Anim. Ecol., 69, 395–403, 2000.
Rutishauser, T. and Studer, S.: Klimawandel und der Einfluss auf die Fr¨uhlingsph¨anologie, Schw. Z. Forstw., 158, 105–111, 2007. Rutishauser, T., Luterbacher, J., Jeanneret, F., Pfister, C., and Wanner, H.: A phenology-based reconstruction of inter-annual changes in past spring seasons, J. Geophys. Res., 112, G04016, doi:10.1029/2006JG000382, 2007.
Saether, B. E., Engen, S., Møller, A. P., Matthysen, E., Adriaensen, F., Fiedler, W., Leivits, A., Lambrechts, M. M., Visser, M. E., Anker-Nilssen, T., Both, C., Dhondt, A. A. , McCleery, R. H., McMeeking, J., Potti, J., Røstad, O. W., and Thomson, D.: Cli-mate variation and regional gradients in population dynamics of two hole-nesting passerines, P. R. Soc. London, 270, 2397–2404, 2003.
Saether, B. E., Engen, S., Grøtan, V., Fiedler, W., Matthysen, E., Visser, M. E., Wright, J., Møller, A. P., Adriaensen, F., van Balen, H., Balmer, D., Mainwaring, M. C., McCleery, R. H., Pampus, M., and Winkel, W.: The extended Moran effect and large-scale synchronous fluctuations in the size of great tit and blue tit pop-ulations, J. Anim. Ecol., 76, 315–325, 2007.
Sanz, J. J.: Climate change and breeding parameters of great and blue tits throughout the western Palaearctic, Glob. Change Biol., 8, 409–422, 2002.
Schaber, J. and Badeck, F.: Evaluation of methods for the combina-tion of phenological time series and outlier deteccombina-tion, Tree Phys-iol., 22, 973–982, 2002.
Sillett, T. S., Holmes, R. T., and Sherry, T. W.: Impacts of a global climate cycle on population dynamics of a migratory songbird, Science, 288, 2040–2042, 2000.
Slonosky, V. C., Jones, P. D., and Davies, T. D.: Homogenization techniques for European monthly mean surface pressure series, J. Climate, 12, 2658–2672, 1999.
Sokolov, L. V.: Spring ambient temperature as an important fac-tor controlling timing of arrival, breeding, post-fledging disper-sal and breeding success of Pied Flycatchers Ficedula hypoleuca in Eastern Baltic, Avian Ecol. Behav., 5, 79–104, 2001. StatSoft Inc.: STATISTICA, version 7.1., available at: www.statsoft.
com (last access: 9 October 2012), 2006.
Summers, D. M., Bryan, B. A., Crossman, N. D., and Meyer, W. S.: Species vulnerability to climate change: impacts on spatial conservation priorities and species representation, Glob. Change Biol., 18, 2335–2348, doi:10.1111/j.1365-2486.2012.02700.x, 2012.
Van Dongen, S., Backeljau, T., Matthysen, E., and Dhondt, A.: Syn-chronization of hatching date with budburst of individual host trees (Quercus robur) in the winter moth and its fitness conse-quences, J. Anim. Ecol., 66, 113–121, 1997.
Visser, M. E., Van Noordwijk, A. J., Tinbergen, J. M., and Lessells, C. M.: Warmer springs lead to mistimed reproduction in great tits (Parus major), P. Roy. Soc. Lond. B., 265, 1867–1870, 1998. Visser, M. E., Adriaensen, F., Van Balen, J. H., Blondel, J., Dhondt,
A. A., Van Dongen, S., Du Feu, C., Ivankina, E. V., Kerimov, A. B., De Laet, J., Matthysen, E., McCleery, R., Orell, M., and Thomson, D. L.: Variable responses to large-scale climate change in European Parus populations, P. Roy. Soc. Lond. B., 270, 367– 372, 2002.
Walther, G. R., Post, E., Convey, P., Menzel, A., Parmesan, C., Bee-bee, T. J. C., Fromentin, J.-M., Hoegh-Guldberg, O., and Bair-lein, F.: Ecological responses to recent climate change, Nature, 416, 389–395, 2002.
Wanner, H., Br¨onnimann, S., Casty, C., Gyalistras, D., Luterbacher, J., Schmutz, C., Stephenson, D. B., and Xoplaki, E.: North At-lantic Oscillation – Concepts and Studies, Surv. Geophys., 22, 321–381, 2001.
Willis, K. J. and Bhagwat, S. A.: Questions of importance to the conservation of biological diversity: answers from the past, Clim. Past, 6, 759–769, doi:10.5194/cp-6-759-2010, 2010.
Willis, K. J. and MacDonald, G. M.: Long-Term Ecological Records and Their Relevance to Climate Change Predictions for a Warmer World, Annu. Rev. Ecol. Evol. S., 42, 267–287, 2011. Willis, K. J., Ara´ujo, M. B., Bennett, K. D., Figueroa-Rangel, B., Froyd, C. A., and Myers, N.: How can a knowledge of the past help to conserve the future? Biodiversity conservation and the relevance of long-term ecological studies, Philos. T. Roy. Soc. B., 362, 175–186, 2007.
Winkel, W. and Hudde, H.: Long-term trends in reproductive traits of tits (Parus major, P. caeruleus) and pied flycatchers (Ficedula hypoleuca), J. Avian Biol., 28, 187–190, 1997.
Xoplaki, E., Gonzalez-Rouco, J. F., Luterbacher, J., and Wanner, H.: Wet season Mediterranean precipitation variability: influence of large-scale dynamics and trends, Clim. Dynam., 23, 63–78, 2004.