Association of socioeconomic factors with body
mass index, obesity, physical activity, and dietary
factors in Belo Horizonte, Minas Gerais State,
Brazil:
The BH Health Study
Associação de fatores socioeconômicos com o
índice de massa corporal, obesidade, atividade
física e dieta em Belo Horizonte, Minas Gerais,
Brasil:
Estudo Saúde em Beagá
Asociación de factores socioeconómicos con el
índice de masa corporal, obesidad, actividad física,
y dieta en Belo Horizonte, Minas Gerais, Brasil:
Estudio Salud en Beagá
1 School of Public Health, University of Michigan, Ann Harbor, U.S.A.
2 University of North Carolina, Gillings School of Global Public Health, Chapel Hill, U.S.A.
3 Observatório de Saúde Urbana de Belo Horizonte, Universidade Federal de Minas Gerais, Belo Horizonte, Brasil.
4 Faculdade de Medicina, Universidade Federal de Minas Gerais, Belo Horizonte, Brasil.
5 Centro de Pesquisas René Rachou, Fundação Oswaldo Cruz, Belo Horizonte, Brasil. 6 Faculdade de Saúde e Ecologia Humana, Vespasiano, Brasil. 7 School of Public Health, Drexel University Philadelphia, U.S.A.
Correspondence J. Ward
Gillings School of Global Public Health, University of North Carolina.
135 Dauer Drive, Chapel Hill, NC 27599, USA.
Julia Ward 1,2
Amélia Augusta de Lima Friche 3,4 Waleska Teixeira Caiaffa 3,4 Fernando Augusto Proietti 5,6 César Coelho Xavier 3,6 Ana V. Diez Roux 7
Abstract
Obesity prevalence is rapidly increasing in devel-oping countries. Existing research investigating social patterning of obesity and its risk factors in Latin American urban contexts has inconsis-tent findings. This study analyzed a multistage household survey in adults in Belo Horizonte, Minas Gerais State, Brazil. Marginal models were used to examine the association of educa-tion and household and neighborhood income with body mass index (BMI), obesity, physical in-activity, and low fruit and vegetable intake after adjusting for age and ethnicity and stratifying by sex. BMI and obesity were inversely associated with education in women. BMI was positively associated with household and neighborhood income in men. Additionally, physical inactivity and low fruit and vegetable intake were inverse-ly associated with education and household income in both men and women, and physical inactivity was inversely associated with neigh-borhood income in men. Understanding the drivers of these patterns will allow for develop-ment of appropriate policy and interventions to reduce cardiovascular disease risk in large cities in Latin America.
Socioeconomic Factors; Body Mass Index; Obesity; Urban Health
Resumo
A prevalência da obesidade está aumentando nos países em desenvolvimento. Estudos investigando os padrões sociais da obesidade e seus fatores de risco em áreas urbanas da América Latina têm re-sultados inconsistentes. Neste estudo foram ana-lisadas as informações provenientes de inquérito populacional sobre a saúde de adultos residentes em Belo Horizonte, Minas Gerais, Brasil. Foram utilizados modelos marginais para examinar a associação entre a escolaridade, a renda familiar e da vizinhança com o IMC (índice de massa corpo-ral), a obesidade, a atividade física e o consumo de frutas e verduras. O IMC e a obesidade se associa-ram inversamente à escolaridade entre as mulhe-res e o IMC positivamente à renda do domicilio e da vizinhança entre os homens. O baixo consumo de frutas e verduras e a inatividade física foram inversamente associados à escolaridade e à renda familiar em ambos os sexos. A inatividade física se associou inversamente à renda da vizinhança entre os homens. Compreender as causas da distri-buição social da obesidade é importante para re-duzir o risco de doença cardiovascular nos centros urbanos da América Latina.
Introduction
In many countries a nutrition and physical activi-ty transition has accompanied the epidemiologic shift from infectious to chronic disease 1,2. Rec-ognition of the influence of obesity on non-com-municable disease rates has led to an increasing focus on prevalence of obesity and its risk factors worldwide. Obesity, defined as a body mass index (BMI) ≥ 30kg/m2, is a physical activity and nutri-tion-related risk factor for many chronic diseases including hypertension, diabetes, cardiovascular disease, and several types of cancer 3.
The association of obesity with socioeco-nomic factors has been well documented in de-veloped countries 4 where cardiovascular disease risk factors such as obesity are inversely associ-ated with socioeconomic position 4,5,6. Health behaviors such as diet and physical activity may represent possible mediators in the association of socioeconomic position with obesity and have shown inverse trends with socioeconomic posi-tion similar to those with obesity in developed nations 4. Additionally, studies in industrialized nations have demonstrated that neighborhood factors, such as availability of healthy foods and recreational resources, influence diet and physical activity over and above individual-level characteristics 7.
Research demonstrates that rates of chronic diseases and associated risk factors are increas-ing faster in developincreas-ing regions than in devel-oped regions and that cardiovascular disease is the greatest cause of mortality in developing na-tions 8. The largest increase in BMI between 1980 and 2008 occurred in areas of Oceania and Latin America 8. In Brazil, for example, between 1975 and 2008 the percentage of the population that classified as obese increased from 2.7 to 16.0 in men and from 7.4 to 21.4 in women 9,10.
Historically in developing nations, low socio-economic position was protective against cardio-vascular disease risk factors 9,11. However, a grow-ing body of research in Latin America indicates a shift in the burden of these risk factors to impov-erished populations 12,13,14. Additionally, urban populations have been shown to have a higher prevalence of obesity, low levels of physical activ-ity, and poor diet 14,15. Given the already high and growing levels of urbanization in many low- and middle-income countries, describing the asso-ciation of these risk factors with socioeconomic position in urban settings is of special signifi-cance. Describing and understanding the associ-ation of obesity and associated behavioural risk factors with socioeconomic position in countries such as Brazil, a nation with large urban centers that suffers from great inequity, is fundamental
to developing appropriate policies and interven-tions to stymie the obesity epidemic.
In Brazil in 1989, obesity in adults was posi-tively associated with socioeconomic position 16. In 2003, obesity prevalence remained higher in high-income groups than in low-income groups, but the rate of increase was higher in low-in-come communities 9. It is important to continue to characterize the magnitude and direction of the association of obesity, and the associated be-haviors of physical inactivity and poor diet, with socioeconomic position as it shifts over time to burden impoverished populations. Utilizing both individual- and contextual-level measures of so-cioeconomic position can provide greater insight into the specific aspects of socioeconomic posi-tion that influence health. The purpose of this study is to investigate the association of both individual-level and neighborhood-level mea-sures of socioeconomic position on risk factors for cardiovascular disease in an urban Brazilian population. Using a unique household survey, we examine the influence of education, household income, and neighborhood income on BMI, obe-sity, physical activity, and dietary factors in the city of Belo Horizonte, Minas Gerais State, Brazil. Given the shifting trends observed in Brazil over the last several decades, we expect that the pres-ent pattern of these outcomes in Belo Horizonte will mirror that of developed nations.
Methods
Study population
From August 2008 to February 2009 the Belo Horizonte Observatory for Urban Health con-ducted a cross-sectional survey in Belo Hori-zonte. The survey was conducted in the Bar-reiro and West districts, two of the city’s nine districts. Each district has approximately 250,000 inhabitants, and the two districts have a total geographical area of 33.16km2. The West and Barreiro districts were chosen due to their geographical proximity and their sig-nificant internal heterogeneity of various demo-graphic, socioeconomic, and health indicators. These characteristics were similar to those of other city districts.
social, demographic, economic and health in-dicators from the census for each census tract. Census tracts, defined by the Brazilian Census Bureau, include an average of 1,000 residents. In the first stage of sampling, 149 census tracts were randomly selected from a total of 588 tracts in the sampling frame. A total of 6,493 households made up the 149 tracts. In the second stage of sampling, vacant lots, institutional and com-mercial buildings, and households that could not be reached after three attempts were deleted. In the final sampling stage, one adult from each household was selected to participate; interview-ers randomly selected this participant from a list of resident adults for each selected household. Approximately 75% of the households agreed to participate leaving a total study sample of 4,048 households. The main causes of refusal were in-ability to contact the selected participant after three consecutive attempts and participants refusing to answer the questionnaire due to its length. Those who refused to participate did not differ from participants who completed the questionnaire by sex or age.
Before the survey was conducted, the instru-ments were pilot tested, and the 23 interviewers completed centralized training. Interviewers vis-ited each sample household, and if the selected resident was present at the time, the interviewer explained the study aims and procedures and answered participant questions. Participants agreeing to take part in the study signed In-formed Consent Forms. The interviewer then ad-ministered the face-to-face questionnaire, which lasted approximately 45 minutes, and performed anthropometric measurements.
We originally intended to interview all adults in the household to increase sample size after estimating a total sample size of approximately 3,000 persons over the age of 18 from 1,750 house-holds. These calculations were based on the 2000 Brazilian Census and an 80% response rate 19. As-suming three persons per household and an av-erage within household correlation in outcomes of 0.5, we would have had 80% power to detect differences as small as 0.2 standard deviations in the outcome when comparing two groups of 208 persons. However, we underestimated the number of eligible households; we ended up with a study sample of 4,048 households and on-ly needed to sample one adult from each. Thus, power was even greater than expected due to the larger sample size and lack of clustering with-in household.
Funding for the study came from the Na-tional Institutes of Health (NIH) Fogarty Interna-tional Center (grant n. D43 TW009315 and 5R03 TW008105), CNPq-409688/2006-1,
FAPEMIG-CDS APQ 00677-08, and the National Health Fund (FNS)-25000.102984/2006-97/Brazil. The project was approved by the Ethics Research Committee of Federal University of Minas Gerais (protocol n. ETIC 253/06) and the Ethics Research Com-mittee of the Department of Municipal Health (073.2008).
Data sources
Participants responded to a questionnaire made up of six modules: household information, so-ciodemographic data, health, habits and behav-iors, anthropometric evaluation, and social de-terminants of health. Participants who did not report education (n = 4) or household income (n = 98), had no information on neighborhood income (n = 17), or who had missing BMI (n = 11) were excluded, leaving a total study sample of 3,918 participants. An additional 226 partici-pants did not report physical activity and were excluded from the physical activity analyses.
The main outcomes of interest were BMI, obesity, low physical activity, and low fruit and vegetable intake. BMI was calculated as weight in kg/(height in m2). Interviewers used a standard scale (brand TANITA BF 542, Tanita Corp., USA) and stadiometer to measure height and weight. Interviewers were trained to correctly perform measurements following standard protocols. Obesity was defined as BMI ≥ 30kg/m2 based on WHO recommendations.
Participants responded to questions regard-ing the frequency and duration of physical activ-ity from the Portuguese version of the Interna-tional Physical Activity Questionnaire (IPAQ), ver-sion 8. This instrument is recommended for na-tional prevalence studies 20. The physical activity score utilized for analysis was calculated as the sum of minutes of moderate activity, plus twice the minutes of vigorous activity. Noncompliance with physical activity guidelines was defined as a score below 150 minutes/week as currently rec-ommended by the U.S. Surgeon General’s Report, American College of Sports Medicine, and Cen-ters for Disease Control and Prevention 21,22,23.
been shown to be a useful marker of dietary qual-ity and related to social and economic factors in prior work 26.
The exposures of interest were years of edu-cation, household income, and neighborhood income. Education is a consistent predictor of population health, especially in developing con-texts 27. Household income reflects material con-ditions that impact health 27, and neighborhood income was utilized because contextual socio-economic position measures have been shown to influence health after accounting for individ-ual factors 7. Education was classified into three categories: 0-8 years, 9-11 years, and 12+ years. Gross monthly household income was classified into three categories in terms of the minimum Brazilian wage (about US$ 290.00): < 2 minimum wages (< US$580), 2-5 minimum wages (US$580-1,450), and >5 minimum wages (> US$1,450). This categorization was based on the income dis-tribution of participants in this study, previous studies, and the Brazilian Institute of Geography and Statistics (IBGE) 2010 census report 28,29. The neighborhood indicator examined was monthly income per capita obtained from the 2000 and 2010 Brazilian census 19,29. We categorized this variable into tertiles. Census tracts were used as proxies for neighborhoods.
Data analysis
The distribution of BMI, obesity, physical activ-ity, and dietary intake by income and educa-tion level was first summarized with descriptive and graphical analyses. Spearman correlations between income and education level were cal-culated. Multivariable linear and logistic regres-sion models were run to examine the association between the outcomes of BMI, obesity, physical activity, and diet with education level, household income, and neighborhood income. We tested for effect modification by sex through stratified analyses and by including interaction terms in the regression models. The associations of BMI with education, household income, and neigh-borhood income differed significantly by sex (P for interaction terms introduced separately: < 0.0001 for sex and education, < 0.0001 for sex and income, and < 0.0001 for sex and neighborhood), thus, results are stratified by sex. The interac-tion terms between sex and educainterac-tion, house-hold income, and neighborhood income for the physical activity and diet outcomes were not sta-tistically significant; however, results are shown stratified by sex to facilitate comparison with BMI analyses.
All models were adjusted for age and ethnic-ity because we conceptualized these variables as
possible confounders in the association between socioeconomic position and the outcomes of interest. In order to observe the associations of each socioeconomic position measure with the outcomes independent of the other two socio-economic position measures, the final models were mutually adjusted for education, household income, and neighborhood income by adding these variables to the unadjusted model. Addi-tionally, we ran intermediate models including only education and household income, but these results were very similar to the final models and were therefore not reported in the tables. Mar-ginal models were used to account for clustering within census tracts 30. We hypothesized that the socioeconomic position measures would be in-versely associated with BMI, obesity, lack of com-pliance with physical activity guidelines, and low fruit and vegetable consumption.
Results
After excluding participants who were missing covariate data, the total sample size was 2,317 women and 1,601 men. The 130 excluded par-ticipants were similar in socioeconomic position and risk factor characteristics to those included in the analyses. Table 1 displays selected indi-vidual characteristics of the sample, stratified by sex. Men made up 40.8% of the sample and had an average age of 43.5 years, younger than women whose average age was 44.9 years. The ethnic composition of the sample was similar for men and women with the majority identify-ing as mixed ethnicity or white. Men reported more years of education than women with 18.4% of men reporting 12+ years of education com-pared to 16.4% of women. Women reported lower household income than men with 31.6% of wom-en in the lowest income category compared to 19.5% of men. However, men and women had similar average neighborhood income. The av-erage BMI of women was 26.5kg/m2 compared to 25.5kg/m2 in men, and 22.8% of women were classified as obese compared to 14.9% of men. Men were more likely to eat fruits or vegetables less than 3 days/week than women (40.5% vs. 31.2%, respectively), however, women were more likely to complete fewer than 150 minutes of physical activity per week than men (77.8% vs. 67.4%, respectively).
Table 1
Selected characteristics of a sample from the Barreiro and West Districts of Belo Horizonte, Minas Gerais State, Brazil, 2008-2009.
Variable Total (N = 3,918) Men (n = 1,601) Women (n = 2,317) p-value *
Male (%) 40.8
Married (%) 42.9 48.5 39.1 < 0.0001
Age in years, Mean ± SD [range] 44.3±16.9 (18.0-95.0) 43.5±17.1 (18.0-91.0) 44.9±16.8 (18.0-95.0) 0.0088
Ethnicity (%)
White 38.2 36.0 39.7
Black 12.9 14.5 11.7
Mixed (“parda”) 47.7 48.7 47.0
Other 1.3 0.9 1.6 0.0047
Education (%) [years]
0-8 47.7 45.4 49.3
9-11 35.1 36.2 34.3
12+ years 17.2 18.4 16.4 0.0421
Household monthly income, in minimum wages (%)
Low (< 2) 26.7 19.5 31.6
Medium (2-5) 45.8 47.9 44.4
High (> 5) 27.5 32.6 24.0 < 0.0001
Nominal monthly income per person (BRL), [Mean ± SD (Range)]
870.1±771.7
(181.8-4847.8)
863±781.0
(181.8-4847.8)
874.4±765.3
(181.8-4847.8) 0.6761
BMI (kg/m2), Mean ± SD [range] 26.1±5.1 (13.9-53.0) 25.5±4.5 (14.0-46.7) 26.5±5.5 (13.9-53.0) < 0.0001
Obesity (%) [BMI ≥ 30] 19.6 14.9 22.8 < 0.0001
Eat fruits or vegetables < 3 days/week (%) 35.0 40.5 31.2 < 0.0001
Physical inactivity, < 150min/week (%) 73.57 67.4 77.8 < 0.0001
BMI: body mass index; SD: standard deviation.
* Chi-square tests for categorical variables and t-tests for continuous variables were performed to determine differences between men and women.
Table 2
Crude and adjusted mean differences (95%CI) in BMI according to socioeconomic characteristics stratified by sex of a sample from the Barreiro and West Districts of Belo Horizonte, Minas Gerais State, Brazil, 2008-2009.
Individual socioeconomic variables Men (n = 1,601) Women (n = 2,317) Model 1 Model 2 Model 1 Model 2
Education
Low -0.94 (-1.53; -0.35) -0.03 (-0.71; 0.65) 1.59 (0.93; 2.25) 1.79 (1.03; 2.55)
Medium -0.32 (-0.93; 0.30) 0.17 (-0.48; 0.85) 0.92 (0.30; 1.54) 1.03 (0.37; 1.70)
High 0.00 0.00 0.00 0.00
p-value for trend 0.0025 0.6653 < 0.0001 < 0.0001
Monthly income (minimum salary)
Low -1.63 (-2.25; -1.01) -1.26 (-1.93; -0.58) 0.23 (-0.38; 0.85) -0.61 (-1.29; 0.07)
Medium -0.69 (-1.22; -0.17) -0.46 (-1.05; 0.14) 0.39 (-0.09; 0.87) -0.19 (-0.71; 0.32)
High 0.00 0.00 0.00 0.00
p-value for trend < 0.0001 0.0013 0.2865 0.1992
Neighborhood measure (percentile of nominal monthly income per person)
1st tertile (low) -1.18 (-1.68; -0.67) -0.76 (-1.28; -0.23) 0.57 (-0.04; 1.17) 0.22 (-0.40; 0.84)
2nd tertile -0.34 (-0.81; 0.13) -0.15 (-0.63; 0.34) 0.07 (-0.44; 0.59) -0.13 (-0.66; 0.41)
3rd tertile (high) 0.00 0.00 0.00 0.00
p-value for trend < 0.0001 0.0145 0.1606 0.5345
95%CI: 95% confidence interval; BMI: body mass index.
Thus, results are stratified by sex. In the crude analysis for women, average BMI had an inverse association with education, a positive asso-ciation with household income, and showed no clear trend with neighborhood income. After ad-justing for age, ethnicity, education, and neigh-borhood, only the BMI and education associa-tion remained significant. After adjustment, the mean BMI of women with 0-8 years of education was 1.79 (95% confidence interval – 95%CI: 1.03-2.55) kg/m2 higher than that of women with 12+ years of education. For men, average BMI had significant positive associations with income and neighborhood and showed no clear trend with education. After adjustment for all covariates, the mean BMI of low-income men was 1.26 (95%CI: 0.58-1.93) kg/m2 lower than that of high-income men, and the mean BMI of men in the poor-est neighborhoods was 0.76 (95% CI: 0.23-1.28) kg/m2 lower than that of men in the wealthiest neighborhoods.
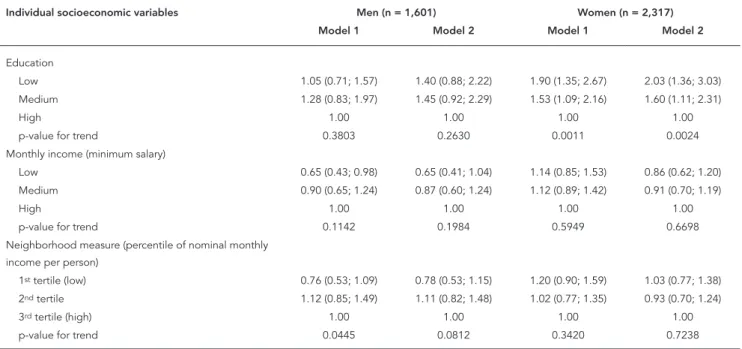
The social patterning of the odds of obesity showed similar trends to those shown with BMI in women only (Table 3). After adjusting for house-hold and neighborhood income, the odds of obe-sity in women with 0-8 years of education were 2.03 (95% CI: 1.36-3.03) times the odds in women with 12+ years of education. In men, however,
when BMI was dichotomized into obese and not obese, we no longer observed trends with any socioeconomic position measure after adjusting for all covariates. Low income did appear to have a slight protective effect for men, but this trend was non-significant. No significant associations were found between obesity and neighborhood income for either men or women.
Table 4 displays the odds ratios (OR) of less than 150 minutes/week of physical activity by education, household income, and neighbor-hood income, stratified by sex. Results are shown stratified by sex to facilitate comparison with BMI analyses. For women, less than 150 min-utes/week of physical activity had a significant inverse association with income and education levels. After adjusting for covariates, the odds of less than 150 minutes/week of physical activity in women with 0-8 years of education were 2.12 (95%CI: 1.49-3.02) times the odds in women with 12+ years of education, and the odds of less than 150 minutes/week of physical activity in low-in-come women were 2.08 (95%CI: 1.47-2.96) times the odds in high-income women. A similar, albeit weaker, pattern was seen in men with regards to education. However, the income trend was not significant in men. Additionally, for men, less than 150 minutes/week of physical activity had
Table 3
Crude and adjusted OR (95%CI) of obesity according to socioeconomic characteristics stratified by sex of a sample from the Barreiro and West Districts of Belo Horizonte, Minas Gerais State, Brazil, 2008-2009.
Individual socioeconomic variables Men (n = 1,601) Women (n = 2,317) Model 1 Model 2 Model 1 Model 2
Education
Low 1.05 (0.71; 1.57) 1.40 (0.88; 2.22) 1.90 (1.35; 2.67) 2.03 (1.36; 3.03)
Medium 1.28 (0.83; 1.97) 1.45 (0.92; 2.29) 1.53 (1.09; 2.16) 1.60 (1.11; 2.31)
High 1.00 1.00 1.00 1.00
p-value for trend 0.3803 0.2630 0.0011 0.0024
Monthly income (minimum salary)
Low 0.65 (0.43; 0.98) 0.65 (0.41; 1.04) 1.14 (0.85; 1.53) 0.86 (0.62; 1.20)
Medium 0.90 (0.65; 1.24) 0.87 (0.60; 1.24) 1.12 (0.89; 1.42) 0.91 (0.70; 1.19)
High 1.00 1.00 1.00 1.00
p-value for trend 0.1142 0.1984 0.5949 0.6698
Neighborhood measure (percentile of nominal monthly income per person)
1st tertile (low) 0.76 (0.53; 1.09) 0.78 (0.53; 1.15) 1.20 (0.90; 1.59) 1.03 (0.77; 1.38)
2nd tertile 1.12 (0.85; 1.49) 1.11 (0.82; 1.48) 1.02 (0.77; 1.35) 0.93 (0.70; 1.24)
3rd tertile (high) 1.00 1.00 1.00 1.00
p-value for trend 0.0445 0.0812 0.3420 0.7238
95%CI: 95% confidence interval; OR: odds ratio.
a significant inverse association with neighbor-hood income. After adjusting for other covari-ates, the odds of less than 150 minutes/week of physical activity in men in the poorest neighbor-hoods were 2.04 (95%CI: 1.41-2.96) times the odds in men in the wealthiest neighborhoods. Less consistent neighborhood patterns were ob-served in women.
Table 5 displays the crude and covariate ad-justed OR of consuming fruits or vegetables less than three days/week by education, household income, and neighborhood income, stratified by sex. For women, low consumption of fruits and vegetables had significant inverse associa-tions with education and household income. After adjusting for covariates, the odds of con-suming fruits or vegetables less than three days/ week in women with 0-8 years of education were 1.61 (95%CI: 1.15-2.26) times the odds in women with 12+ years of education, and the odds of consuming fruits or vegetables less than three days/week in low-income women were 2.21 (95%CI: 1.65-2.96) times the odds in high-income women. Similar but weaker trends were found in men for both education and household income. However, the overall trend in fruit and vegetable consumption across categories of ed-ucation in men was not significant (p-value =
0.0777). No association was found between fruit and vegetable consumption and neighborhood income in either men or women after adjusting for covariates.
Discussion
In developed countries, chronic disease risk fac-tors such as obesity, physical inactivity, and inad-equate fruit and vegetable intake have long been associated with low socioeconomic position 4,5,6. The social gradient in developing countries has been less consistent, and most studies in these contexts have investigated BMI and obesity ex-clusively 9,11,12,13,14. Studies in Brazil over the past several decades suggest a shifting social gradi-ent as the country progresses through the nu-trition transition. In 1989, a positive association between income and obesity was found in both Brazilian men and women 16. 14 years later, a na-tionally representative sample of Brazilian adults showed that high-income groups still had higher obesity prevalence than low-income groups, but low-income groups had a higher rate of in-crease 9. This shifting pattern is not unique to Brazil. A review of low-income countries found a higher prevalence of overweight in
high-ed-Table 4
Crude and adjusted OR (95%CI) of less than 150 minutes/week of physical activity according to socioeconomic characteristics stratified by sex of a sample from the Barreiro and West Districts of Belo Horizonte, Minas Gerais State, Brazil, 2008-2009.
Individual socioeconomic variables Men (n = 1,505) Women (n = 2,188) Model 1 Model 2 Model 1 Model 2
Education
Low 2.47 (1.73; 3.53) 1.55 (1.07; 2.26) 3.38 (2.48; 4.60) 2.12 (1.49; 3.02)
Medium 1.69 (1.24; 2.31) 1.24 (0.89; 1.73) 2.09 (1.56; 2.81) 1.61 (1.19; 2.18)
High 1.00 1.00 1.00 1.00
p-value for trend < 0.0001 0.0683 < 0.0001 0.0002
Monthly income (minimum salary)
Low 1.97 (1.41; 2.76) 1.33 (0.93; 1.90) 3.15 (2.32; 4.28) 2.08 (1.47; 2.96)
Medium 1.94 (1.45; 2.61) 1.46 (1.08; 1.99) 2.14 (1.64; 2.80) 1.63 (1.23; 2.18)
High 1.00 1.00 1.00 1.00
p-value for trend < 0.0001 0.0529 < 0.0001 0.0001
Neighborhood measure (percentile of nominal monthly income per person)
1st tertile (Low) 2.80 (1.95; 4.03) 2.04 (1.41; 2.96) 2.23 (1.66; 3.01) 1.31 (0.96; 1.80)
2nd tertile 1.92 (1.40; 2.63) 1.56 (1.15; 2.13) 1.31 (0.99; 1.73) 0.97 (0.74; 1.28)
3rd tertile (High) 1.00 1.00 1.00 1.00
p-value for trend < 0.0001 0.0006 < 0.0001 0.1200
95%CI: 95% confidence interval; OR: odds ratio.
Table 5
Crude and adjusted OR (95%CI) of consuming fruits or vegetables less than three days per week according to socioeconomic characteristics stratified by sex of a sample from the Barreiro and West Districts of Belo Horizonte, Minas Gerais State, Brazil, 2008-2009.
Individual socioeconomic variables Men (n = 1,601) Women (n = 2,317) Model 1 Model 2 Model 1 Model 2
Education
Low 1.99 (1.46; 2.71) 1.47 (1.02; 2.13) 2.47 (1.85; 3.30) 1.61 (1.15; 2.26)
Medium 1.35 (1.00; 1.83) 1.15 (0.82; 1.60) 1.43 (1.04; 1.97) 1.09 (0.79; 1.51)
High 1.00 1.00 1.00 1.00
p-value for trend < 0.0001 0.0777 < 0.0001 0.0021
Monthly income (minimum salary)
Low 2.23 (1.68; 2.94) 1.76 (1.26; 2.44) 2.85 (2.19; 3.70) 2.21 (1.65; 2.96)
Medium 1.37 (1.07; 1.74) 1.16 (0.89; 1.51) 1.65 (1.27; 2.14) 1.39 (1.05; 1.85)
High 1.00 1.00 1.00 1.00
p-value for trend < 0.0001 0.0021 < 0.0001 < 0.0001
Neighborhood measure (percentile of nominal monthly income per person)
1st tertile (low) 1.62 (1.23; 2.14) 1.20 (0.87; 1.64) 1.65 (1.29; 2.10) 1.08 (0.84; 1.40)
2nd tertile 1.30 (0.96; 1.76) 1.11 (0.81; 1.52) 1.51 (1.20; 1.91) 1.24 (0.99; 1.54)
3rd tertile (high) 1.00 1.00 1.00 1.00
p-value for trend 0.0026 0.5229 0.0002 0.1442
95%CI: 95% confidence interval; OR: odds ratio.
Model 1: adjusted for age and ethnicity; Model 2: adjusted for age, ethnicity, education, income, and neighborhood.
ucation groups in 35 of 39 countries; however, the rate of increase in overweight prevalence was higher in the low-education groups in 21 coun-tries 31. Our study demonstrates a next step in the shift reported by previous studies in Brazil.
The social patterning of obesity greatly de-pends on the region of Brazil examined. In 1996 in the less developed northeastern region of Bra-zil, obesity in men was positively associated with income but not with education, and obesity in women was positively associated with income and inversely with education 31. In the more developed southeastern region, the same study found a positive association between obesity and income in men and a clear inverse relationship between obesity and education in women 32. Our study was carried out in a developed Brazilian city and was consistent with the findings in the more developed southeastern region; the women with the lowest education in our sample had the highest average BMI and obesity prevalence.
Obesity was once a disease of the elite, but as a country’s GNP (Gross National Products) in-creases, the social gradient reverses. For women, the crossover takes place earlier than for men, when a country reaches a GNP per capita of ap-proximately US$2,500 33. Our findings of an in-verse association of female BMI and obesity with
education and a positive association between male BMI and income areconsistent with other studies in Latin America that report similar gen-der differences in social patterning 14,34 .Through-out Latin America, low socioeconomic position continues to protect against obesity in men while increasing the risk of obesity in women.
level made less money than men. Consequently, income may not accurately capture a woman’s social position.
In developed countries, prevalence of physi-cal inactivity is higher in low socioeconomic posi-tion groups 21,23, and a similar pattern has begun to emerge in developing countries 37. Neverthe-less, our study is the first in Brazil to find a social gradient of physical inactivity similar to that of developed countries. Studies in other regions of Brazil and Latin America found either a positive association 22,38 or no association 14,22 between socioeconomic position and physical inactivity. Our findings of strong income and education patterning of physical activity, especially in wom-en, demonstrate the shifting patterns in physical activity practices in urban regions of Brazil where the elite may have resources permitting higher levels of activity, especially for leisure 39.
Education and income had independent ef-fects on physical activity in women and to an ex-tent in men in Belo Horizonte. Those with less education may lack the health-knowledge and social capital to sustain healthy physical activity levels, and those with lower income tend to have less leisure time and opportunity for recreational activities 11,40. Additionally, low-education and low-income populations have less financial and social resources to avoid the environments that promote physical inactivity 41.
In developed countries, fruit and vegetable consumption is associated with higher levels of education 42, and similar patterns are beginning to appear in developing nations 43,44,45. Our re-sults of low fruit and vegetable consumption in low-income and low-education groups of men and women were consistent with other findings in Brazil 46,47. In recent years, sugary and pro-cessed foods have become more available in Bra-zil 48, and healthy foods, such as fruits and veg-etables, are more costly than low-quality calorie dense foods 49. High-income populations have greater purchasing power formore expensive healthy foods, while low-income populations are more constrained in their choices 41. The addi-tional independent inverse effect of education on fruit and vegetable consumption indicates that education captures aspects of socioeconomic position that affect access to fruits and vegeta-bles that income alone does not.
In men we found an inverse association be-tween physical inactivity and poor diet and so-cioeconomic position, a seemingly contradictory positive association between BMI and socio-economic position, and no association between obesity and socioeconomic position. Although the behavioral risk factors for obesity have begun to change in both men and women in Brazil, it is
possible that the effects on social patterning of BMI have not yet become apparent in men. Ad-ditionally, the significant positive association in men of income with BMI but not with obesity is plausible because BMI as a continuous measure is more sensitive to differences that the dichoto-mized obesity variable could not detect. While our study suggests that men with higher incomes may have higher BMI, our findings also indicate that higher income men have the resources to consume healthy diets and participate in physi-cal activity to prevent obesity. If the pattern of physical inactivity and poor diet in men of low socioeconomic position persists, we may ob-serve an eventual shift in the BMI and obesity trends in men in Brazil.
Area-level income was not a consistent pre-dictor of health outcomes in this study. Neighbor-hood income was not associated with any of the three outcomes in women; however, there was evidence of a positive association with BMI and an inverse association with physical activity in men. Studies of neighborhood effects on health are almost exclusively limited to developed countries where residential environments with higher socioeconomic position are associated with better health, after adjusting for individual socioeconomic position 7. Less deprived neigh-borhoods may have better access to health pro-moting resources such as recreational facilities and infrastructure, transportation, and healthy food stores. Few studies have examined this as-sociation in developing countries. In Argentina, lower area-level education was associated with higher BMI after adjusting for individual income and education in men and women, even though the association with individual-level socioeco-nomic position was not significant in men 14. This same study found no area-level association with physical activity or diet in Argentina 14. The neighborhood socioeconomic position indicator we used may not appropriately capture the en-vironmental variation relevant to the risk factors we studied. It is also possible that there is less environmental heterogeneity in our sample than in other contexts or studies.
poor and wealthy in Brazil and decrease the social mobility of those with the lowest socioeconomic position 50. Without policies and interventions to address the cycle of poverty and poor health, this ever-increasing inequality could have substantial future economic and social costs for Brazil.
Our study had a number of strengths includ-ing a large sample size that was representative of an urban center in Brazil, the use of a validated survey to measure both leisure and occupational physical activity, the measurement of height and weight by a trained interviewer, and the inclu-sion of both individual and contextual measures of socioeconomic position. Our study also had limitations. The cross-sectional design precludes us from studying the possible causal interrela-tions between education, household income, and neighborhood income. These three variables are undeniably linked, and cross-sectional data prohibits the investigation of their sequencing. Furthermore, education, household income, and neighborhood income are limited measures of socioeconomic position, and future analysis could include additional variables such as occu-pation, wealth, and more specific and targetable neighborhood measures. In addition, we restrict-ed our analysis to the Barreiro and West districts of Belo Horizonte, which may affect the exter-nal validity of our findings. We also used census tracts, which are variable in size, as a proxy for
neighborhoods. However, this has been done in previous studies, and we were still able to detect associations at the neighborhood level. Addition-ally, the scope of the survey allowed us to gather only limited data on diet. Furthermore, due to missing data, we excluded 130 participants from our final sample; this exclusion has the potential to introduce bias if the examined associations in the excluded participants differ from the associa-tions in the included participants. It is also worth noting that the survey was carried out in 2009, and the magnitude of the associated variables, or even the definition of variables themselves, may have undergone changes from 2009 to the present.
Our study identified the social patterning of various cardiovascular disease risk factors and behaviors in a large Brazilian city. BMI and obe-sity were inversely associated with education in women, and BMI was positively associated with income in men. In addition, physical inactiv-ity and poor diet were associated with lower in-comes and less education independentlyin both genders. In contrast, neighborhood income was not consistently related to health. Longitudinal analysis of this patterning is necessary to under-stand the causes of non-communicable diseases in the Latin American context. Understanding the drivers of these patterns will allow for the de-velopment of appropriate policy and interven-tions that address these health disparities.
Resumen
La prevalencia de la obesidad está aumentando en los países en desarrollo. Estudios sobre la distribu-ción social de la obesidad y sus factores de riesgo en ciudades de América Latina cuentan con resultados inconsistentes. En este estudio se analizó una encuesta de adultos de Belo Horizonte, Minas Gerais, Brasil. Se utilizaron modelos marginales para examinar la aso-ciación entre educación, ingresos del hogar y barrio sí como el índice de masa corporal (IMC), la obesidad, la inactividad física, y el consumo de frutas y verduras. Se observaron relaciones inversas entre el IMC, obesidad y la educación en las mujeres, así como una relación
positiva entre el IMC y los ingresos del hogar y barrio en el caso de los hombres. Además, el consumo bajo de frutas y verduras y la inactividad física se asocia-ron inversamente con la educación y los ingresos del hogar en ambos sexos. La inactividad física se asoció inversamente con los ingresos del barrio en los hom-bres. Comprender las causas de esta distribución social es importante para reducir el riesgo de enfermedades cardiovasculares en las ciudades de América Latina.
References
1. Popkin BM, Gordon-Larsen P. The nutrition transi-tion: worldwide obesity dynamics and their deter-minants. Int J Obes Relat Metab Disord 2004; 28 Suppl 3:S2-9.
2. Church TS, Thomas DM, Tudor-Locke C, Katzmar-zyk PT, Earnest CP, Rodarte RQ, et al. Trends over 5 decades in U.S. occupation-related physical activ-ity and their associations with obesactiv-ity. PLoS One 2011; 6:e19657.
3. Finucane MM, Stevens GA, Cowan MJ, Danaei G, Lin JK, Paciorek CJ, et al. National, regional, and global trends in body-mass index since 1980: sys-tematic analysis of health examination surveys and epidemiological studies with 960 country-years and 9·1 million participants. Lancet 2011; 377:557-67.
4. Kaplan GA, Keil JE. Socioeconomic factors and cardiovascular disease: a review of the literature. Circulation 1993; 88(4 Pt 1):1973-98.
5. McLaren L. Socioeconomic status and obesity. Ep-idemiol Rev 2007; 29:29-48.
6. Dinsa GD, Goryakin Y, Fumagalli E, Suhrcke M. Obesity and socioeconomic status in developing countries: a systematic review. Obes Rev 2012; 13:1067-79.
7. Diez Roux AV. Residential environments and car-diovascular risk. J Urban Health 2003; 80:569-89.
8. Magnusson RS. Rethinking global health chal-lenges: towards a “global compact” for reducing the burden of chronic disease. Public Health 2009; 123:265-74.
9. Monteiro CA, Conde WL, Popkin BM. Income-spe-cific trends in obesity in Brazil: 1975-2003. Am J Public Health 2007; 97:1808-12.
10. World Health Organization. NCD country profiles: Brazil. Geneva: World Health Organization; 2011. 11. Sobal J, Stunkard AJ. Socioeconomic status and
obesity: a review of the literature. Psychol Bull 1989; 105:260-75.
12. Marins VM, Almeida RM, Pereira RA, Sichieri R. The association between socioeconomic indica-tors and cardiovascular disease risk facindica-tors in Rio de Janeiro, Brazil. J Biosoc Sci 2007; 39:221-9. 13. Boissonnet C, Schargrodsky H, Pellegrini F,
Mac-chia A, Marcet Champagne B, Wilson E, et al. Edu-cational inequalities in obesity, abdominal obesity, and metabolic syndrome in seven Latin American cities: the CARMELA Study. Eur J Cardiovasc Prev Rehabil 2011; 18:550-6.
14. Fleischer NL, Diez Roux AV, Alazraqui M, Spinelli H. Social patterning of chronic disease risk fac-tors in a Latin American city. J Urban Health 2008; 85:923-37.
Contibutors
J. Ward analyzed the data and wrote the manuscript. A. A. L. Friche contributed to the design and acquisition of the data, assisted with data analysis and translation of the abstract to Portuguese, and reviewed the final ma-nuscript. W. T. Caiaffa contributed to the design and ac-quisition of the data, assisted with data interpretation, and reviewed the final manuscript. F. A. Proietti and C. C. Xavier contributed to the design and acquisition of the data and reviewed the final manuscript. A. V. Diez Roux contributed to the design and acquisition of the data, assisted with data analysis and interpretation and translation of the abstract to Spanish, and reviewed the final manuscript.
Acknowledgments
15. Machado-Rodrigues AM, Coelho-e-Silva MJ, Mota J, Cumming SP, Riddoch C, Malina RM. Correlates of aerobic fitness in urban and rural Portuguese adolescents. Ann Hum Biol 2011; 38:479-84. 16. Monteiro CA, Benicio MH, Conde WL, Popkin BM.
Shifting obesity trends in Brazil. Eur J Clin Nutr 2000; 54:342-6.
17. Friche AA, Diez-Roux AV, César CC, Xavier CC, Proietti FA, Caiaffa WT. Assessing the psychomet-ric and ecometpsychomet-ric properties of neighborhood scales in developing countries: Saúde em Beagá Study, Belo Horizonte, Brazil, 2008-2009. J Urban Health 2013; 90:246-61.
18. Turci MA, Lima-Costa MF, Proietti FA, Cesar CC, Macinko J. Intraurban differences in the use of ambulatory health services in a large brazilian city. J Urban Health 2010; 87:994-1006.
19. Instituto Brasileiro de Geografia e Estatística. Cen-so demográfico 2000. Rio de Janeiro: Instituto Bra-sileiro de Geografia e Estatística; 2003.
20. Hallal PC, Victora CG. Reliability and validity of the International Physical Activity Questionnaire (IPAQ). Med Sci Sports Exerc 2004; 36:556. 21. U.S. Department of Health and Human Services.
Physical activity and health: a report from the Sur-geon General. Atlanta: U.S. Department of Health and Human Services; 1996.
22. Hallal PC, Victora CG, Wells JC, Lima RC. Physi-cal inactivity: prevalence and associated variables in Brazilian adults. Med Sci Sports Exerc 2003; 35:1894-900.
23. Pate RR, Pratt M, Blair SN, Haskell WL, Macera CA, Bouchard C, et al. Physical activity and public health. A recommendation from the Centers for Disease Control and Prevention and the American College of Sports Medicine. JAMA 1995; 273:402-7. 24. Secretaria de Vigilância em Saúde, Ministério de
Saúde. Vigitel Brasil 2011: Vigilância de fatores de risco e proteção para doenças crônicas por inqué-rito telefônico. Brasília: Ministério de Saúde; 2012. (Série G. Estatística e Informação em Saúde). 25. He FJ, Nowson CA, Lucas M, MacGregor GA.
In-creased consumption of fruit and vegetables is re-lated to a reduced risk of coronary heart disease: meta-analysis of cohort studies. J Hum Hypertens 2007; 21:717-28.
26. Morland K, Wing S, Diez Roux A. The contextual ef-fect of the local food environment on residents’ di-ets: the atherosclerosis risk in communities study. Am J Public Health 2002; 92:1761-7.
27. Lynch J, Kaplan G. Socioeconomic position. In: Berkman L, Kawachi I, editors. Social epidemiol-ogy. New York: Oxford University Press; 2000. p. 13-35.
28. Camargos VP, César CC, Caiaffa WT, Xavier CC, Proietti FA. Imputação múltipla e análise de ca-sos completos em modelos de regressão logística: uma avaliação prática do impacto das perdas em covariáveis. Cad Saúde Pública 2011; 27:2299-313. 29. Instituto Brasileiro de Geografia e Estatística.
Cen-so demográfico 2010. Rio de Janeiro: Instituto Bra-sileiro de Geografia e Estatística; 2012.
30. Liang KY, Zeger SL. Longitudinal data analysis us-ing generalized linear models. Biometrika 1986; 73:13-22.
31. Jones-Smith JC, Gordon-Larsen P, Siddiqi A, Pop-kin BM. Is the burden of overweight shifting to the poor across the globe? Time trends among women in 39 low- and middle-income countries (1991-2008). Int J Obes (Lond) 2012; 36:1114-20. 32. Monteiro CA, Conde WL, Popkin BM. Independent
effects of income and education on the risk of obe-sity in the Brazilian adult population. J Nutr 2001; 131:S881-6.
33. Monteiro CA, Moura EC, Conde WL, Popkin BM. Socioeconomic status and obesity in adult popula-tions of developing countries: a review. Bull World Health Organ 2004; 82:940-6.
34. Fleischer NL, Diez Roux AV, Hubbard AE. Inequali-ties in body mass index and smoking behavior in 70 countries: evidence for a social transition in chronic disease risk. Am J Epidemiol 2012; 175: 167-76.
35. Feingold A, Mazzella R. Gender differences in body image are increasing. Psychol Sci 1998; 9:190-5. 36. McLaren L, Kuh D. Women’s body dissatisfaction,
social class, and social mobility. Soc Sci Med 2004; 58:1575-84.
37. Bauman A, Ma G, Cuevas F, Omar Z, Waganivalu T, Phongsavan P, et al. Cross-national comparisons of socioeconomic differences in the prevalence of leisure-time and occupational physical activity, and active commuting in six Asia-Pacific coun-tries. J Epidemiol Community Health 2011; 65: 35-43.
38. Alves JG, Figueiroa JN, Alves LV. Prevalence and predictors of physical inactivity in a slum in Brazil. J Urban Health 2011; 88:168-75.
39. Barros MV, Nahas MV. Comportamentos de risco, auto-avaliação do nível de saúde e percepção de estresse entre trabalhadores da indústria. Rev Saú-de Pública 2001; 35:554-63.
40. Obesity: preventing and managing the global epidemic. Report of a WHO consultation. World Health Organ Tech Rep Ser 2000; 894:i-xii, 1-253. 41. World Health Organization. Diet, nutrition and
the prevention of chronic diseases. Geneva: World Health Organization; 2003. (WHO Technical Re-port Series, 916).
42. Dehghan M, Akhtar-Danesh N, Merchant AT. Factors associated with fruit and vegetable con-sumption among adults. J Hum Nutr Diet 2011; 24: 128-34.
43. Hosseinpoor AR, Bergen N, Kunst A, Harper S, Guthold R, Rekve D, et al. Socioeconomic inequali-ties in risk factors for non communicable diseases in low-income and middle-income countries: re-sults from the World Health Survey. BMC Public Health 2012; 12:912.
44. Colón-López V, Banerjee G, Gertz AM, Ortiz AP, Ca-lo W, Finney-Rutten LJ, et al. Behavioral correlates of fruit and vegetable intake in Puerto Rico: results from the Health Information National Trends Sur-vey. P R Health Sci J 2013; 32:194-9.
46. Mondini L, Moraes SA de, Freitas IC, Gimeno SG. Fruit and vegetable intake by adults in Ribeirão Preto, Southeastern Brazil. Rev Saúde Pública 2010; 44:686-94.
47. Jaime PC, Monteiro CA. Fruit and vegetable intake by Brazilian adults, 2003. Cad Saúde Pública 2005; 21:S19-24.
48. Levy-Costa RB, Sichieri R, Pontes NS, Monteiro CA. Household food availability in Brazil: distribution and trends (1974-2003). Rev Saúde Pública 2005; 39:530-40.
49. Drewnowski A, Darmon N. The economics of obe-sity: dietary energy density and energy cost. Am J Clin Nutr 2005; 8 Suppl 1:S265-73.
50. World Bank. Inequality and economic develop-ment in Brazil. Washington DC: World Bank; 2004. 51. World Health Organization. Global health risks:
mortality and burden of disease attributable to se-lected major risks. Geneva: World Health Organi-zation; 2009.
Submitted on 20/Aug/2014