EDUCAÇÃO SUPERIOR E A EFICÁCIA DOS MECANISMOS DE
FINANCIAMENTO DAS POLÍTICAS PÚBLICAS NO CANADÁ
EDUCACIÓN SUPERIOR Y LA EFICACIA DE LOS
MECANISMOS DE FINANCIACIÓN DE LAS POLÍTICAS
PÚBLICAS EN CANADÁ
Danilo de Melo Costa
Doutor em Administração pela Universidade Federal de Minas Gerais (UFMG), Brasil, com doutorado sanduíche pela York University (YorkU), Canadá / Coordenador e professor do Mestrado Profissional em Administração pelo Centro Universitário UNA, Brasil danilomct@gmail.com
Contextus
ISSNe 2178-9258 Organização: Comitê Científico Interinstitucional Editor Científico: Diego de Queiroz Machado Avaliação: double blind review pelo SEER/OJS Edição de texto e de layout: Carlos Daniel Andrade Recebido em 18/01/2018 Aceito em 06/03/2018 2ª versão aceita em 29/04/2018
ABSTRACT
This research analyzes the effectiveness of public policy funding mechanisms for higher education in Canada in the period from 2003 to 2012, assuming a gap to be explored concerning the proposition of new public policies that contribute to financing higher education worldwide. When it comes to the methodological procedures, this study was designed as exploratory and quantitative. A group of public policies were statistically analyzed, using as a reference the compound annual growth rate (CAGR), which was in turn based on the investments made and the number of students attended in the period. The results showed that Canada has proven to be a country of solid and well-defined public policies, which had an impact on its good performance, with an emphasis on: the CESG policy, which presents the proactive way to ensure access to, and presence of, young people in higher education; CSGP/CSLP, which was statistically significant in relation to the percentage of students attended; and OSAP / Reaching Higher policy, which was more sensitive to the needs of the context in which it is inserted (Ontario province).
Keywords: Evaluation. Efficiency. Public policy. Higher education. Canada.
RESUMO
garantir o acesso e permanência de jovens na educação superior; o CSGP/CSLP, que foi estatisticamente significativo em relação à porcentagem de estudantes atendidos; e o OSAP / Reaching Higher, que foi mais sensível em relação às necessidades do contexto em que está inserido (província de Ontário).
Palavras-chave: Avaliação. Eficiência. Políticas públicas. Ensino superior. Canadá.
RESUMEN
Esta investigación analiza la eficacia de los mecanismos de financiamiento de las principales políticas públicas para la educación superior en Canadá en el período comprendido entre 2003 y 2012, suponiendo una brecha en torno a propuestas de nuevas políticas públicas para ayudar a financiar la educación superior en todo el mundo. En lo que se refiere a los procedimientos metodológicos, el estudio fue concebido como exploratorio y cuantitativo. Analizó estadísticamente un conjunto de políticas públicas usando como referencia la tasa de crecimiento anual compuesta (CAGR), que se basó, por su turno, en la inversión realizada y en el número de estudiantes atendidos durante el período analizado. Los resultados mostraron que Canadá es un país de políticas públicas sólidas y bien definidas que tuvieron un impacto en su buen desempeño, con destaque para: la CESG, que presenta una manera proactiva de garantizar el acceso y permanencia de jóvenes en la educación superior; el CSGP/CSLP, que fue estadísticamente significativo en relación al porcentaje de estudiantes atendidos; y el OSAP / Reaching Higher, que fue más sensible a las necesidades del contexto en que se inserta (provincia de Ontario).
Palabras clave: Evaluación. Eficiencia. Políticas públicas. Educación superior. Canadá.
1 INTRODUCTION
In Canada, a totally free public education is available to the entire population until the end of high school, respecting a maximum age limit that is set by the province or territory. Thus, funding from the government covers most of the costs related to primary and secondary education, however families must assume the expenses related to such school activities as procurement of children’s supplies among others. The moment students reach higher education (treated in the country as “post-secondary”), the costs increase considerably. Although higher education institutions receive a satisfactory
government funding, the tuition fees are one of the main sources considered “private financing.” In addition to those, college students face additional costs for day-to-day activities (STATISTICS CANADA, 2011). To Sguissardi (2003), the Canadian government spending on education can be divided generally in: higher education (20%), basic education (62%), technical education (10%) and community colleges (8%).
Development Index (HDI), which got the 1st place in 1998. The country’s educational model is supported by excellent indicators that ensured this position at the time:
a) 62% of people in the appropriate age group are enrolled in higher education; b) 53% of its economically active
population have a university degree (SGUISSARDI, 2003).
As already described, the higher education system is essentially public, but is decentralized with respect to its maintenance. The responsibility for that is divided among provinces (TRILOKEKAR; GLEN, 2007). As a general average, it is
possible to estimate the federal government transfers around 60% of the amount, those of the municipalities of the respective institutions around 15%, and the enrollment and other private sources about 25%. However, the federal body ultimately influences all actors from the point of view of legislation and control (SGUISSARDI, 2003). Albuquerque, Melo and Saurin (2007) presented the resource division in higher education institutions in Canada. In addition to the amount received by the government and the school fees, there are other sources such as research contracts, according to Table 1:
Table 1 – Sources of income in average percentages: 2001 to 2003
Sources Ratio
Government revenues 60.87 Private/Student fees 22.51 Covenants/Other 16.61
TOTAL 100.00
Source: Albuquerque, Melo and Saurin (2007), adapted by the author.
Note: Sample of data regarding the financial reporting of Canadian institutions: University of British Columbia (UBC), University of Toronto (Toronto) and University of Alberta (Alberta).
The Canadian government invests in higher education something close to 11 billion (US) annually, a resource for the maintenance of students, staff and higher education institutions (SGUISSARDI, 2003).
To better understand the application of financial resources in Canadian higher education, this article aims to analyze the
2 EVOLUTION OF PUBLIC POLICIES FOR THE FINANCING OF CANADIAN HIGHER EDUCATION
The Constitution of Canada has assigned the responsibility of higher education to the provinces, an initiative that came to be seen as a complex for this level of education due to the lack of unity (FISHER et al., 2006). According to
Cameron (2004), the resources are now allocated directly to the provincial treasuries, leaving the universities vulnerable to priority changes on the part of provinces. During Brian Mulroney’s government, from the Conservative Party of Canada (1984-1993), the transfers received several cuts due to the crisis of the time and fell below the levels needed to cover the increased costs related to inflation and growth in demand from the third degree. It was from this moment that the provincial governments had to seek new ways to finance higher education, promoting a reordering.
With the new budget constraints, the universities had to reduce technical and administrative staff, increasing the number of classes, increasing the number of lessons per professor (Which has had a negative impact on the time available for research and guidance), among other actions. The main one was looking for alternative sources of financing, which
resulted in a substantial increase in academic fees paid by students and a greater intensification of university-business partnership.
Both actions have brought concerns that didn’t exist in this system, such as a risk to return an elitist model, since not everyone would be able to afford the third degree, and academic research spending to be buoyed only by the market demands, making purely technocrats universities (JACEK, 2003; SGUISSARDI, 2003; WISEMAN, 2003). In anyway, Sguissardi (2003) reports that, even in times of crisis, Canada is one of the only countries (besides Cuba) that has never ceased to apply public resources in higher education institutions, citing as a opposite situation Brazil, Argentina and Chile, which face these moments promoted a direct privatization, through incentives for the creation of fully private universities.
In the early 1990s, student assistance became a major concern of the Canadian university system, as rising rates above inflation led to increased student debt. By the end of the decade, the reduction of federal transfers was increased by public policies aimed at increasing this assistance.
Contingent Repayment (ICR) being presented in a document entitled Bovey Commission, which reported on the Ontario’s university system. However, it was in 1993, in the government of Jean Chrétien, of the Liberal Party of Canada (1993-2003) that this policy was implemented. Knowing that rates would be increased because of the moments faced by the country, the ICR was to guarantee access and permanence to all candidates to the third degree that had not able to afford the rates, offering it loans (CHAPMAN, 2005).
As resources increased beyond government scope, it was also increased the concern of universities, until the Association of Universities and Colleges of Canada (AUCC) pointed out that the government financial transfers should not be reduced by taking into account the increase in “external” gains of universities, which turned out to represent an academic unit of the Federal Government actions (ARMSTRONG et al., 1992).
In anyway, the cuts as regards the transfer of funds continued to occur in the following years (without direct influence with universities gains, as highlighted by AUCC). It is claimed that between 1995 and 2005, financing related to Canada Health and Social Transfer (CHST), which is the rubric responsible for tertiary
education, decreased by about 50% per student. With reference to the year 2009, it is estimated that the Canadian federal government was providing only 55% of the operating revenue of colleges and universities, 15% lower than it was passed in the 90’s (ROBERTSON. 2003; JONES
et al, 2007).
Unable to envision a more peaceful horizon when it comes to funding, most of the provinces were forced to allow higher education institutions to increase the tuition fees, to offset the payment deficits of operational revenue. Between 1990 and 2003, the average tuition of undergraduate courses in Canada more than doubled, far outpacing the increases caused by the consumer price index (CPI), which is the index used to measure inflation. The growth rate was an annual average of 8.1%, while inflation of 1.9% (STATISTICS CANADA, 2011).
institutions as service providers depending on the perceived needs. The primary objective of the fund was to increase the international competitiveness of Canada, facing the changes brought by globalization and also promote economic restructuring, adapting the higher education market demands (SGUISSARDI, 2003).
Starting in 1997, a new scenario began to emerge in the country due to a previously unexpected surplus. Fisher et al.
(2006) states that, instead of restoring financial transfers to its previous levels, the government has decided to invest in other instruments supporting the HEIs, based on a document called the Canadian Opportunities Strategy (COS), which was launched in 1998. This document had policies that addressed all of the priority areas identified in the Renewing Student Assistance in Canada report launched by the AUCC in 1997:
a) improved financial assistance and student loans;
b) registration tax offset credits for current students;
c) helps in saving for the families of prospective students;
d) strategic funding to support the activities of researchers and research infrastructure.
The results of these actions were satisfactory, according as 54% of students received some form of scholarship or loan from the government between the years 1993 and 2003, with a 20% increase in the number of covered (ANDRES; ADAMUTI-TRACHE, 2008). Another action was the tax deductibility of interest paid on student loans, seeking to equalize the payment obligations of students with their repayment capabilities.
With regard to future student savings, the government has created the Canada Education Savings Grant (CESG), which provides an incentive for families to save money for their children to attend higher education. The Canadian government complements the savings of the contemplated according to the annual income of the family:
a) up to 20% additional supplement, if the net family income is C$ 42,707.00 or less;
b) up to 10% additional supplement, if the net family income is between C$ 42,707.00 and C$ 85,414.00 (CANLEARN, 2013).
In addition to the above actions, the Canadian government also created the Canada Millennium Scholarship Foundation (CMSF), in order to help the country overcome its indicators in the new millennium. In its implementation were allocated C$ 2,5 billion, with the assumptions of:
a) improve access to higher education for all Canadians, especially economically disadvantaged;
b) encourage a high performance rate of students;
c) build a national alliance of organizations and individuals around an agenda for actions focusing on higher education.
Between its 10 years of existence (1998 to 2009), the foundation allocated more than 500 thousand scholarships, applying a value higher than US $ 1.5 billion. The grants were intended in two different ways:
a) Millennium Bursary Program for students with the greatest financial need;
b) Millennium Excellence Award Program, providing scholarships based on student’s merit (CFS, 2013).
With the end of the government of Paul Martin (2003-2006), Jean’s Chrétien successor (both from the Liberal Party of
Canada) and the beginning of the government of Stephen Harper, from the Conservative Party of Canada (2006-2015), the SPS Committee has been discontinued. The foundation was then replaced by the new Canada Student Grants Program (CSGP), with the goal of distributing 350 million dollars per year for students of higher education. With the program’s change, the Millennium Excellence Award Program was discontinued (HRSDC, 2013).
In addition to the actions described above, it can be observed other phenomenon that influences in some way the results of Canadian higher education, beginning by encouraging the pursuit of colleges, which have more specific training focused to market demands. What has been observed is a migration of many of the students seeking a higher education with these characteristics (FEDALTO, 2001).
(VENTURA, 2006). Ventura (2006) further reports that there are around eight to twelve thousand distance learning courses in Canada, citing as example the University of Athabasca, which has all its courses (about 600) in the distance. In addition there is the Canadian Virtual University (CVU), which has thirteen universities and vocational schools, and OntarioLearn.com, an association of twenty-two vocational schools, offers about four hundred online courses .
Finally, Albuquerque, Melo and Saurin (2007) observe that the financing strategy is essential for the effective autonomy of an institution of higher education. However, even public institutions should diversify their sources of resources. For Albuquerque, Melo and Saurin (2007, p. 12) “universities may be public, but not necessarily state organizations.”
3 METHODOLOGY
Due to the purposes, this research was developed as exploratory. According to Gil (1995), exploratory studies are developed with the intention to offer an overview of a subject.
An exploratory research is conceived in an area in which there is little
accumulated and systematic knowledge, seeking to provide more information about the subject being investigated (ANDRADE, 2001; VERGARA, 2004). For Gil (1995) and Collins and Hussey (2005), the exploratory research should evaluate which theories or concepts can be applied to a relevant problem, or if new concepts and theories can be developed. From then on, such study is characterized as exploratory for seeking to deepen the articulation of public policies for the financing of higher education in Canada.
The research was elaborated to support the design provided for a quantitative study. The quantitative approach is confirmed as numeric values were used regarding variables that shape the system of higher education in Canada, as well as the public policies for the financing of higher education of the country studied.
databases and government documents to gather the necessary information. From then on, Canadian databases on public policies analyzed were consulted. More specifically:
a) For the Canada Education Savings Grant (CESG) public policy, the document entitled “Canada Education Savings Program: Annual Statistical Review 2013” was analyzed in the Employment and Social Development Canada (ESDC) database;
b) For the Canada Student Grants Program (CSGP) and Canada Student Loans Program, the Canadian Student Loans Program: Annual Report 2012-2013, also included in the ESDC database, was consulted;
c) For the Reaching Higher policy, which is specific to the province of Ontario, data were collected from the Ontario Ministry of Finance, specifically a document entitled “Reaching Higher: the McGuinty government plan for postsecondary education,” as well as data from the Ministry of Training, Colleges and Universities (MTCU), from a document called “Published Result-based Plan Briefing Book 2009-10.”;
d) For Ontario policy called the Ontario Student Assistance Program (OSAP),
documentary data from the Ontario Ministry of Finance were used on a database that displays “Public Accounts of Ontario” data from 2002/03 to 2012/2014.
Choosing this method of data collection has become appropriate, given the Canadian government freely provides data from all its policies in government databases. All these data were inserted in spreadsheets and categorized either as number of students attended or investment made in the period, so that the compound annual growth rate (CAGR) could be calculated later.
From then on, data were collected regarding the amount of investment and the number of students attended (when available), the following policies:
Chart 1 – Data Collection of public policies analyzed
Collection Period Name
2003-2012 Canada Education Savings Grant (CESG) 2009-2012 Canada Student Grants Program (CSGP) 2003-2012 Canada Student Loans Program (CSLP)
2005-2010 Reaching Higher
2003-2012 Ontario Student Assistance Program (OSAP) 2012 30% Off Ontario Tuition Grant
Source: Elaborated by the author.
The analysis and quantitative treatment were performed together with the numeric findings of the respective public policies, originating from documentary and bibliographic data collection, following the assertion of Barbetta (2008, p. 65), who argues that this procedure allows “to introduce techniques which allow to organize, summarize and present such data, so that it is possible to interpret them in the light of the research objectives.”
After collection and filing the results from 6 public policies selected, the data systematization and standardization was performed. The policies that didn’t exhibit the annual data evolution couldn’t be analyzed through historical timeline.
The indicators of public policies were presented throughout the period of its existence in tables and charts. To check the growth or decline in each indicator over the period, the compound annual growth
rate (CAGR) was used. The choice of this equation is given as an alternative to verify the efficacy of the public policies studied, taking as a reference the financial contributions invested (initial and final) as well as the number of students attended (initial and final) over the years analyzed.
The compound rate of annual growth is given by:
𝐶𝐴𝐺𝑅 = (𝐼𝑛𝑖𝑡𝑖𝑎𝑙 𝑉𝑎𝑙𝑢𝑒)𝐹𝑖𝑛𝑎𝑙𝑙 𝑉𝑎𝑙𝑢𝑒 1/𝑛
− 1
policies was presented to facilitate interpretation and dissemination of data.
The software used for all quantitative analysis was R version 3.0.3.
4 RESULTS
In order to understand more deeply the public policies for higher education in Canada and Ontario, investments were evaluated in the period 2003-2012 and so were the numbers of students attended by the public policies Canada Education Savings Grant (CESG), Canada Student Grants Program (CSGP), Canada Student Loans Program (CSLP), Reaching Higher and Ontario Student Assistance Program (OSAP). The last two refer specifically to the province of Ontario.
The total values and the average annual growth rates were calculated, both for investment and for the number of students attended. It also estimated the still average investment per student and its average annual growth rate in order to identify the efficiency of their policies in the period.
4.1 Canada Education Savings Grant (CESG)
The Canada Education Savings Grant (CESG) is a sum of money offered by the Government of Canada to help families save for their children’s education after high school. The CESG is calculated based on contributions to a Registered Education Savings Plan (RESP) for an eligible beneficiary and consists of two components: a) Basic CESG; b) Additional CESG.
The basic CESG provides 20 cents for every dollar that is saved, up to a maximum of 500 Canadian dollars on an annual contribution of 2,500 Canadian dollars. If you cannot make any contribution in a given year, the participant can catch up in the coming years. Contributions should be saved in an RESP, made on behalf of an eligible beneficiary until the end of the calendar year in which the beneficiary turns 17 years old.
calendar year in which the beneficiary turns 17 years old (ESDC, 2014a).
The most interesting in this policy is that already creates a culture of savings for future investment, since Canada public education charges tuition fees for one-third of the student’s formation process.
The Table 2 shows the amount of investments intended for CESG public policy, as well as students who were attended during the study period:
Table 2 – CESG, total investments, and students attended from 2003 to 2012 CESG
Year Investment ($ dollars) Students Attended (cumulative) 2003 389,000,000.00 1,550,000 2004 426,000,000.00 1,650,000 2005 470,000,000.00 1,750,000 2006 514,000,000.00 1,880,000 2007 579,000,000.00 2,010,000 2008 604,000,000.00 2,070,000 2009 627,000,000.00 2,130,000 2010 680,000,000.00 2,210,000 2011 716,000,000.00 2,310,000 2012 753,000,000.00 2,420,000
Source: Prepared by the author with data from ESDC (2014a).
Graph 1 illustrates the development of investment by the number
Graph 11– Development of investment by the number of students attended in CESG
Source: Prepared by the author with data from Table 2.
The CESG has been analyzed since 2003 and in the 10 years of evaluation showed a total investment of U$ 5,758 billion, with an average annual growth rate of 7.6%. Over the period 2,420,000 students were attended, and it was seen an average growth of 5.1% of students attended per year. The average investment per student was U$ 285,41, and this value increased on average by 2.4% per year.
4.2 Canada Student Grants Program (CSGP)
The Canada Student Grants Program (CSGP) is a program created in 2009 that aims to provide study grants and scholarships to help students finance
higher education, passing a benefit with no need to be paid back. These grants or scholarships can be offered by governments, schools or private organizations.
Thus, it is then provided money to pay for the college or university tuition fees without the need to pay at the end of the undergraduate process, unlike a loan. The scholarships and grants are offered to students at the beginning and middle of the school year and are available for students from most of the provinces and territories, except some Northwest Territories, as Nunavut and Quebec, since these governments have their own programs.
for most concessions available is automatically evaluated. As grants and scholarships are classified into subgroups, a student may be able to get more than one benefit at a time. Grants and scholarships are available for the following groups:
a) students from low-income families; b) students from middle-income families
(middle class);
c) full-time students with dependents; d) part-time students with dependents;
e) students with permanent disabilities; f) services and equipment for students
with permanent disabilities (CANLEARN, 2014).
Table 3 shows the amount of investment intended to the CSGP public policy, as well as students who were attended during the period of 2009 (program’s creation) to 2012:
Table 3 – CSGP, total investments and students attended from 2009 to 2012
CSGP
Year Investment ($
dollars) Students Attended
2003 N/D N/D
2004 N/D N/D
2005 N/D N/D
2006 N/D N/D
2007 N/D N/D
2008 N/D N/D
2009 593,400,000.00 367,309
2010 630,000,000.00 380,221
2011 646,700,000.00 389,395
2012 695,000,000.00 411,821
Source: Prepared by the author with data from ESDC (2014b).
Graph 2 illustrates the development of investment by the number
Graph 2– Development of investment by the number of students attended in CSGP
Source: Prepared by the author with data from Table 3.
The CSGP was analyzed since 2009 and in 4 years evaluated it was presented a total investment of U$ 2,56 billion, with an average annual growth rate of 5.4%. Over the period 1,548,746 students were attended, and it was seen an average growth of 3.9% of students attended per year. The average investment per student was U$ 1,655.22, and this value increased on average by 1.5% per year.
4.3 Canada Student Loans Program (CSLP)
The Canada Student Loans Program (CSLP) helps students of higher education paid for their studies through student loans. The federal government
finances the CSLP and the provinces can finance their own programs.
They are eligible for the CSLP, as loans from the home province, Canadian citizens and permanent residents of Canada who live in any province for over a year. Loans issued to full-time students are interest free while the student is in a full period regime.
The CSLP is administered by the National Service Center Student Loan under contract with the Human Resources and Skills Development Canada (HRSDC). Students have the option to opt for a fixed interest rate or a floating interest rate.
a) fixed rate: is a stable interest rate. The student who chooses this fee will be charged the same interest rate throughout the repayment period;
b) variable rate: is an interest rate that varies over time with the prime rate. If the student chooses this model, the interest that are charged for the repayment of the loan will increase or decrease according to the benchmark interest rate.
The CSLP offers a series of actions to help students facing financial difficulties at the time of effecting the refund to the government:
1. Interest rate: Aims to help students to meet the repayment obligations if they are temporarily unable to make payments on their student loans to the government because of unemployment or low income. The interest subsidy is granted for periods of six months to a maximum of 30 months;
2. Debt reduction in repayment: Designed to assist students with long-term
financial difficulties. In this case, it reduces the loan amount, thus reducing the monthly loan payment to an affordable level based on family income. A student may receive up to three reductions (in an amount of up to $ 26,000 dollars) on his/her loan during lifetime, depending on the financial circumstances;
3. Review of terms: It is a resource that provides students the flexibility to manage the loan repayment in a way that is sensitive to individual situations. This action can be used to reduce monthly payments or increase the repayment period (between 10 years and 15 years). It can also be used to increase the value of the loan payments, reducing the repayment period;
4. Benefits for permanent disability: Allows the reduction of loans for students who are facing exceptional financial difficulties due to a permanent disability (ESDC, 2014b).
Table 4– CSLP, total investments, and students attended from 2003 to 2012 CSLP
Year Investment ($ dollars) Students Attended 2003 1,544,700,000.00 328,991 2004 1,643,000,000.00 340,203 2005 1,628,800,000.00 337,256 2006 1,935,000,000.00 343,638 2007 1,927,100,000.00 343,261 2008 2,012,500,000.00 352,708 2009 2,077,800,000.00 365,363 2010 2,083,200,000.00 401,734 2011 2,218,900,000.00 424,575 2012 2,400,700,000.00 446,582 Source: Prepared by the author with data from ESDC (2014b).
Graph 3 illustrates the development of investment by the number
of students attended during the reporting period:
Graph 3 – Development of investment by the number of students attended in CSLP
The CSLP has been analyzed since 2003 and in the 10 years of evaluation showed a total investment of U$ 19,47 billion, with an average annual growth rate of 5.0%. Over the period 3,684,311 students were attended, and it was seen an average growth of 3.5% students attended per year. The average investment per student was U$ 5,277.95, and this value increased on average by 1.5% per year.
4.4 Reaching Higher
Reaching Higher is a plan of the Ontario government’s actions in order to ensure a greater amount of public funding for the higher education system in their jurisdiction.
In 2005, during the Liberal government of Dalton McGuinty (elected in 2003), there was a review of higher education, by a former prime minister named Bob Rae. On this occasion, he was asked to conduct a thorough review and make recommendations to the government. This report was popularly known as RAE Report.
The Rae Report document, officially called “Ontario: A Leader in Learning” was quite influential, and provided guidance for the future
development of the province. In this opportunity, it was suggested the government initiative called Reaching Higher, which was presented as a huge amount of new investment in Ontario’s higher education: 6,178 billion dollars to be transferred over a period of 5 years (2005-2010).
The expansion of undergraduate education was recommended in this plan and how the government should spent part of the funding for this action. There was a significant growth in undergraduate enrollment in a short period of time.
Table 5 – Reaching Higher: Total investments
Reaching Higher: New operating investments (millions of dollars)
Year 04-05 05-06 06-07 07-08 08-09 09-10 Cumulative total - Student financial assistance 150 192 241 282 314 358 1,537 - Grants for the functioning of
colleges and universities 50 447 732 932 958 1,156 4,275 - Training, learning, and other
initiatives - 44 62 86 87 87 366
New investments total 200 683 1,035 1,300 1,359 1,601 6,178 Source: Ontario Ministry of Finance (2005).
Table 6 lists the amount of investments intended for the Reaching Higher plan, as well as students who were
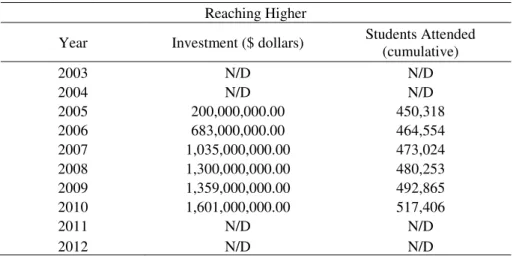
attended during the plan period (2005-2010):
Table 6– Reaching Higher, total investments, and students attended from 2005 to 2010 Reaching Higher
Year Investment ($ dollars) Students Attended (cumulative)
2003 N/D N/D
2004 N/D N/D
2005 200,000,000.00 450,318
2006 683,000,000.00 464,554
2007 1,035,000,000.00 473,024
2008 1,300,000,000.00 480,253
2009 1,359,000,000.00 492,865
2010 1,601,000,000.00 517,406
2011 N/D N/D
2012 N/D N/D
Source: Prepared by the author with data from Ontario Ministry of Finance (2005) and MTCU (2010).
Graph 4– Development of investment by the number of students attended in the Reaching Higher plan
Source: Prepared by the author with data from Table 6.
The Reaching Higher was analyzed since 2005 and in six years had assessed a total investment of U$ 6,178 billion, with an average annual growth rate of 51.6%. Over the period 517,406 students were attended, and it was seen an average growth of 2.8% of students attended per year. The average investment per student was U$ 2,110.16 and this value increased on average by 47.4% per year.
4.5 Ontario Student Assistance Program (OSAP)
The Ontario Student Assistance Program (OSAP) is a financial assistance program provided by the governments of Ontario and Canada for students of higher education. The OSAP provides eligible students from Ontario financial assistance
to help pay their tuition, books, obligatory fees, day-to-day costs and transport.
The program is administered by the Ontario Ministry of Training, Colleges and Universities (MTCU) and includes repayable loans, non-repayable grants and scholarships, depending on the financial situation of each student. After an analysis, the government defines how resources will be via loan (refundable), when it will be through grant or scholarship (non-refundable) and when the student should contribute. To qualify for this assistance, the student must:
a) be a Canadian citizen or permanent resident;
c) be participating in a program at a higher education institution that has been approved for OSAP’s purposes;
d) be enrolled in a program that lasts 12 weeks or more;
e) be enrolled full-time at a higher level course (although part-time students also are able to apply, but receive a smaller amount than the full-time students); f) have not had any restrictions or previous
loans through OSAP.
When students are qualifying for OSAP, the amount that students are eligible to receive during the school year is calculated based on educational and
financial circumstances specific to each one. The needs assessment is made based on the costs that the student will have and the resources that he/she expects to receive. Costs include tuition and fees charged by the educational institution, a grant for books, equipment and computer, an allowance for personal day-to-day costs, local transportation costs and costs associated with child care if the same is dependent (MTCU, 2014a). The way to calculate the benefits to be passed on by OSAP are shown in Figure 1:
Figure 1 – Scheme for calculating the OSAP
Source: Carleton (2014)
Educational Associated
Costs
Financial Contribution
Expected
Calculated financial
need
- Tuition
- Books, materials - Equipment - Computer costs - Local transport costs
- Personal life cost
- Professional compensation - Savings - Family - RESP’s Withdrawals (resource from CESG)
- It will be attended by:
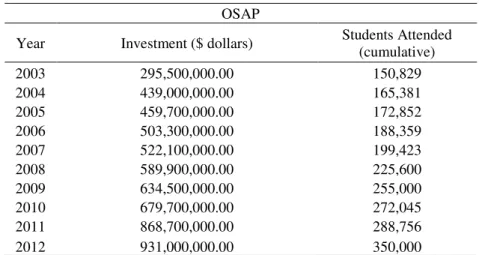
Table 7 lists the amount of investments intended for OSAP and the
students who were attended during the study period:
Table 7 – OSAP, total investments, and students attended from 2003 to 2012 OSAP
Year Investment ($ dollars) Students Attended (cumulative)
2003 295,500,000.00 150,829
2004 439,000,000.00 165,381
2005 459,700,000.00 172,852
2006 503,300,000.00 188,359
2007 522,100,000.00 199,423
2008 589,900,000.00 225,600
2009 634,500,000.00 255,000
2010 679,700,000.00 272,045
2011 868,700,000.00 288,756
2012 931,000,000.00 350,000
Source: Prepared by the author with data from Ontario Ministry of Finance (2014).
Graph 5 illustrates the development of investment by the number of students attended during the reporting period:
Graph 5 – Development of investment by the number of students attended in OSAP
The OSAP was analyzed since 2003 and in the 10 years of evaluation showed a total investment of U$ 5,92 billion, with an average annual growth rate of 13.6%. Over the period 350,000 students were attended, and it was seen an average growth of 9.8% of students attended per year. The average investment per student was U$ 2,583.32 and this value increased on average by 3.5% per year.
4.5.1 30% Off Ontario Tuition Grant
As a complement to the OSAP policies, the Ontario government launched in the end of 2011 the policy 30% Off Ontario Tuition Grant, in order to assist needy students but especially middle-class students.
The 30% Off Ontario Tuition Grant policy provides a maximum discount of $ 1,780 per year for undergraduate programs and $ 820 for university programs that provide degrees or certificates. To be eligible the student must have completed high school for at least four years before the college (or at least six years for students with a permanent disability), and total family income of up to $ 160,000 or less (MTCU , 2014b).
Since the policy was launched in 2011 and the first results published in 2012, it cannot carry out a historical analysis as in previous policies, however, it is worth reinforcing the first year of this policy, as shown in Table 8:
Table 8 – 30% Off OTG, total investments, and students attended in 2012 30% Off Ontario Tuition Grant
Year Investment ($ dollars) Students Attended
2012 291,200,000.00 310,000
Source: For the total investment, Martin (2012) and the students attended, MCYS (2012).
Finally, the next section presents in a comparative way the result of all the policies analyzed in historical series in Canada and Ontario.
4.6 Comparative performance: Canada and Ontario public policies
policies in order to facilitate the interpretation and the spread data.
Table 9 presents the evaluation of investment and students attended in the public policies analyzed in Canada:
Table 9– Comparative performance of public policies of Canada and Ontario
OSAP* R. Higher* CESG CSGP CSLP
Period Number of years 10 6 10 4 10
Initial year 2003 2005 2003 2009 2003
Investment ($ dollar)
Total in period (millions) 5,923,4 6,178 5,758 2,565,1 19,471,7 Annual average growth rate 13.6% 51.6% 7.6% 5.4% 5.0% Students
attended
Total in period 350,000 517,406 2,420,000 1,548,746 3,684,311 Annual average growth rate 9.8% 2.8% 5.1% 3.9% 3.5% Investment
per student
Average in period 2,583.32 2,110.16 285,41 1,655.22 5,277.95 Annual average growth rate 3.5% 47.4% 2.4% 1.5% 1.5% Source: Prepared by the author.
Note: * Information relating to the Ontario province
However, it is worth noting that it is policies with different focuses, both in composition and in goals. Also they are addressed as national policies and provincial level policies, which suggest some caution when comparing the results. In anyway, it is possible to draw conclusions based on the data shown in Table 9, such as:
a) the OSAP was the highest annual growth rate policy in terms of students attended in the period, which proves the concern of the province of Ontario with the system of higher education in their jurisdiction;
b) Reaching Higher plan represented, in fact, a difference in public funding for higher education in the province of Ontario, once had an average annual growth rate (investment) 51.6%,
something extremely significant compared with other policies;
c) the CESG policy demonstrates the strengthening of the Canadian culture to save for their children’s education, as contemplated 2,42 million students throughout the period, with an average growth rate of 5.1%, which proves the success of the policy;
d) the results of CSGP policy demonstrated that the Canadian government has been more concerned to distribute scholarships (non-refundable) than student loans (repayable), because even getting behind the CSLP policy in absolute numbers, the average annual growth rate (served investments and students) of CSGP policy was more representative than the CSLP policy; e) the average investment per student in
all analyzed policies, demonstrating that students seeking student loans finance relatively high amounts, if compared student/cost that the government has in other policies.
5 FINAL THOUGHTS
The analysis of public policies for higher education in Canada demonstrated a direct relationship between the results of the country and the actions taken by them during the period evaluated.
Canada has proven to be a country of solid and well-defined public policies, which had an impact on its good performance. The CESG presented a proactive way to ensure access to, and presence of, young people in higher education, encouraging families to save resources since the children’s birth. In this way, instead of drawing initiatives to remedy problems present in the system, such as the exclusion of under-represented groups due to financial unavailability, the government foregoes this situation by reducing the need to invest in student’s assistance, among other actions.
Anyhow, the welfare policies CSGP and CSLP were statistically significant in relation to the percentage of students attended. What is the most
interesting concerning these policies is the combination of benefits, so that the least favored student receives a greater share of grants (which don’t need to be paid back) and a smaller portion of financial loan (which needs to be paid at the end of the course). The evaluation and calculation of benefits granted by socio-economic status of the student is presented as a fair, democratic and inclusive criterion.
Since the management of higher education is totally decentralized, it was decided to select a province and study the main policies in that region. In the opportunity, it was chosen to study the province of Ontario due to its being the most developed province and which has the largest percentage of students enrolled in higher education in the country. The results of the policies of Ontario showed that, even in a developed country and region, there is still a major concern with the expansion and quality of the higher education provided.
in a regional environment. The same was observed by the Reaching Higher policy,
which before a significant financial grant, aimed at restructuring the educational system of the Province of Ontario.
The decentralized management has taught the following lesson: when a province, state or region is responsible for the distribution of financing and investments, there is a tendency of this transfer to be more generous in order to get the best results for that region, since it will bring direct impacts on the local economy. Thus, a healthy competition between the jurisdictions that will work toward improving their indicators is created, which in the end will be beneficial for the whole country.
When studying a correlation of public policies, it could be observed that Canada offers the possibility of families already acting proactively in the higher education of their children, from the
CESG. However, if the family did not use this policy and the young person reaches the age of higher education, he or she can apply for some kind of Canadian government funding through CSGP/CSLP policies. It is important to note that CSGP/CSLP policies are national, so the Canadian student still has the possibility to apply for provincial-level policies: OSAP policies and 30% Off OTG, which expands the possibilities of the students of the province of Ontario (it should be noted that all provinces have specific policies, and this research was delimited by studying Ontario since it is the largest province of Canada in economic terms and in number of inhabitants). In addition, it was clear that in addition to the nation, the provinces also have a strong influence on the development of higher education, as was the case with the Reaching Higher policy, which invested a great resource in Ontario higher education.
Table 10– Summary of the main reflections observed in the quantitative analysis of public policies
Country Policies Main reflexes
Canada
CESG It presents a proactive way to ensure access to and presence of young people in higher education, by means of resources savings since the children’s birth.
CSGP/CSLP They were statistically significant in relation to the percentage of students met and the combination performed by the two policies. OSAP/Reaching Higher
(Ontario province)
Actions on the provincial level were more sensitive in relation to the needs of the context in which it is inserted.
From this analysis, it is possible to promote new reflections and possibilities regarding the creation of similar policies in other countries, something that couldn’t be done in this research, being considered a limitation. For this reason, as a suggestion of future research, it is recommended to analyze public policies with the same objectives in other countries, to verify if
their effectiveness is similar to that
observed in Canada.
REFERENCES
ALBUQUERQUE, C. R. M. R.; MELO, P. A.; SAURIN, V. Instituições de ensino superior – estudo financeiro comparativo de universidades públicas: Brasil, Canadá e Estados Unidos. In: IV SIMPÓSIO DE EXCELÊNCIA EM GESTÃO E TECNOLOGIA, SEGET, 2007, Resende-RJ. Anais... Resende, SEGET, 2007.
ANDRADE, M. M. Como Preparar Trabalhos para Cursos de Pós Graduação. 4th. ed. São Paulo: Atlas, 2001.
ANDRES, L.; ADAMUTI-TRACHE, M. University attainment, student loans and adult life course activities. In: FINNIE, R.; MUELLER, A.; SWEETMAN, A.; e USHER, A. (Orgs.) Who goes? Who stays? What matters: Accessing and persisting in post-secondary
education. Queen’s School of Policy Studies. Kingston, 2008. p. 239-277.
ARMSTRONG, R.; BAZERGUI, A.; BEACHAMP-FORTIN, M.; DAVENPORT, P.; ELIOT, C. W. J.; HANEN, M.; e SEGAL, B. Report of the AUCC task force on the Report of the Commission of Inquiry on Canadian University Education. Association of Universities and Colleges of Canada, Ottawa, 1992.
BARBETTA, Pedro Alberto. Estatística aplicada às ciências sociais. 7th. ed. Rev. Florianópolis, SC: Editora da UFSC, 2008.
CAMERON, D. M. Collaborative federalism and postsecondary education: Be careful what you wish for. In: BEACH, C. M.; BROADWAY, R. W.; e McINNIS, R. M. (Orgs.). Higher education in Canada. John Deutsch Institute for the Study of Public Policy. Kingston, 2004. p. 205-228.
CANLEARN. Education Savings for your Child: Canada Education Savings Grant. Disponível em <http://www.canlearn.ca/eng/saving/cesg/index.shtml>. Acesso em 29 de Março de 2013.
CANLEARN. Canada Student Grants. Ottawa, Canadá. Disponível em:
CARLETON. Ontario Student Assistance Program (OSAP). Carleton University. Ottawa, Canada. Disponível em: <http://carleton.ca/awards/osap/>. Acesso em 29 de Outubro de 2014.
CFS. Canadian Federation of Students– Millennium Scholarship Foundation Background. Disponível em: <http://www.cfs-fcee.ca/html/english/campaigns/millennium.php>. Acesso em 29 de Março de 2013.
CHAPMAN, B. Income contingent loans for higher education: International reforms. Australian National University Centre for Economic Policy Research, Canberra. 2005.
COLLIS, Jill; HUSSEY, Roger. Pesquisa em Administração. 2nd. ed. Porto Alegre: Bookman, 2005.
ESDC. Canada Education Savings Program: Annual Statistical Review 2013. Employment and Social Development Canada (ESDC). Ottawa, Canadá, 2014a.
ESDC. Canada Student Loans Program: Annual Report 2012-2013. Employment and Social Development Canada (ESDC). Ottawa, Canadá, 2014b.
FEDALTO, J. A. Financiamento do sistema educacional canadense: os desafios de uma difícil conciliação econômica. Revista Interfaces Brasil/Canadá, Porto Alegre, v.1, n.1, 2001.
FISHER, D.; RUBENSON, K.; BERNATCHEZ, J.; CLIFT, R.; JONES, G.; LEE, J.; TROTTIER, C. Federal policy and postsecondary education in Canada. BC: Centre for Policy Studies in higher education and Training. Vancouver, 2006.
GIL. Métodos e Técnicas de Pesquisa Social. São Paulo: Atlas, 1995.
HRSDC. Human Resources and Skills Development Canada– Canada Student Grants Program. Disponível em:
JACEK, H. The universities are not ready. Ontario Confederation of University Faculty Associations Forum, Toronto, p. 4-6, 2003.
JONES, G.; SHANAHAN, T.; PADURE, L.; LAMOUREUX, S.; GREGOR, E. Marshalling resources for change: system level initiatives to increase accessibility to postsecondary education. Canadian Milllenium Scholarship Foundation, Ottawa. 2007.
MARCONI, M. A.; LAKATOS, E.M. Técnicas de Pesquisa. 2nd. ed. São Paulo: Editora Atlas, 1990.
MARTIN, C. Ontario’s Next Tuition Framework: reclaiming cost sustainability for
students, families & government. Ontario Undergraduate Student Alliance (OUSA). Toronto, Canadá. 2012.
MCYS. Breaking the cycle the fourth progress report: Ontario’s poverty reduction strategy 2012 annual report. Minister of Children and Youth Services (MCYS). Toronto, Canada. 2012.
MTCU. Published Result-based Plan Briefing Book 2009-10. Ministry of Training, Colleges and Universities (MTCU). Toronto, Canadá. 2010.
MTCU. OSAP: Ontario Student Assistance Program. Minister of Training, Colleges and Universities. Toronto, Canadá, 2014a. Disponível em: <http://www.ontario.ca/education-and-training/osap-ontario-student-assistance-program>. Acesso em 29 de Outubro de 2014.
MTCU. 30% Off Ontario Tuition. Minister of Training, Colleges and Universities. Toronto, Canadá, 2014b. Disponível em:
<http://www.ontario.ca/education-and-training/30-off-ontario-tuition>. Acesso em: 30 out. 2014.
ONTARIO MINISTRY OF FINANCE. Reaching Higher: the McGuinty government plan for postsecondary education. Toronto: Ministry of Finance, 2005.
ROBERTSON, T. Changing patterns of university finance. Education Quarterly Review, Ottawa. v.9, n.2, p. 9-18, 2003.
STATISTICS CANADA. Education Indicators in Canada: Spending on Postsecondary Education. Ottawa: Tourism and the Centre for Education Statistics Division. 2011.
SGUISSARDI, Valdemar. Educação Superior no Limiar do Novo Século Traços
internacionais e marcas domésticas. In: ZAINKO, Maria S.; GISI, Maria de Lourdes. (Org.). Políticas e Gestão da Educação Superior. Curitiba: Champagnat; Florianópolis: Insular, p. 195-222, 2003.
TRILOKEKAR, Roopa Desai; GLEN, A. Jones. Internationalizing Canada’s Universities: A Matter of Policy Coordination? International higher education, Toronto, 46, p. 12-14. 2007.
VENTURA, G. C. Educação à distância no Brasil e no Canadá: visões, paisagens e perspectivas. Revista Interfaces Brasil/Canadá, Porto Alegre, v.6, n.6, p. 165-174. 2006.
VERGARA, S. C. Projetos e relatórios de pesquisa em Administração. São Paulo: Atlas, 2004.