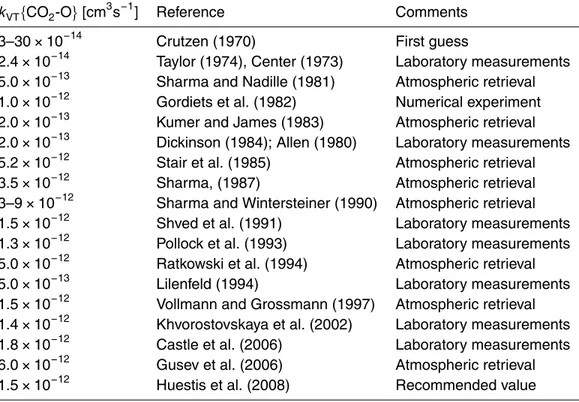
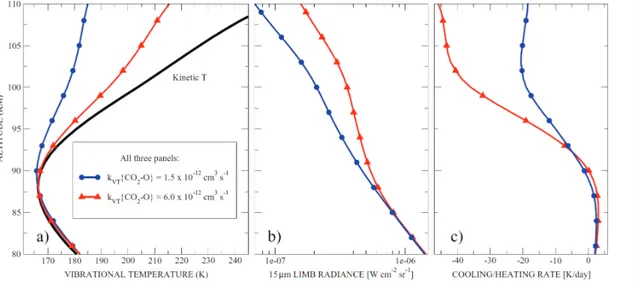
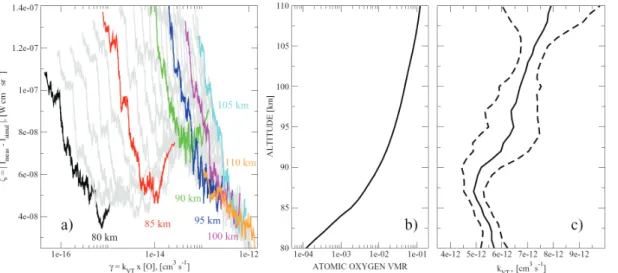
CO<sub>2</sub>(<i>ν</i><sub>2</sub>)-O quenching rate coefficient derived from coincidental SABER/TIMED and Fort Collins lidar observations of the mesosphere and lower thermosphere
Texto
Imagem


Documentos relacionados
Weekly aggregated values of environmental parameters (upper panel: precipitation (black bars), temperature (red line: soil temperature, red dashed line: air temperature), soil
We have used the GEOS-Chem CO 2 simulation with CO 2 emissions from global monthly-varying fossil fuel use, shipping, aviation and the chemical production of CO 2 from the oxidation
Model estimated CO 2 time series at two surface stations in the southern extra-tropics, compared to CO 2 measurements taken at those stations.. The “GOSAT” line is from an
To investigate whether changing the gas transfer rate can improve regional model prediction, we compared the results from the model runs with the climatology of Taka- hashi et al.
The maximum order of perturbation amplitudes in the up- per mesosphere and lower thermosphere is found to be 15 K for the ultra-fast Kelvin wave (UFKW) of the 3.5-day period, 8 K
The framework is based on a mass balance ap- proach and given that for Europe most of the components have been independently estimated, di ff erent accounting schemes may be used
fluxes associated with these upwelling events provide readily interpretable signals of carbon dynamics in the coastal margin (Pennington and Chavez, 2000; Friederich et al., 2002;
However, in previous field measurements that used a zenith viewing DOAS instrument on a mobile platform, emissions were estimated by first taking a “clean- air” spectrum at some