BGD
1, 335–365, 2004Coastal upwelling fluxes
T. J. Lueker
Title Page Abstract Introduction Conclusions References
Tables Figures
◭ ◮
◭ ◮
Back Close
Full Screen / Esc
Print Version
Interactive Discussion
©EGU 2004
Biogeosciences Discussions, 1, 335–365, 2004 www.biogeosciences.net/bgd/1/335/
SRef-ID: 1810-6285/bgd/2004-1-335 © European Geosciences Union 2004
Biogeosciences Discussions
Biogeosciences Discussionsis the access reviewed discussion forum ofBiogeosciences
Coastal upwelling fluxes of O
2
, N
2
O, and
CO
2
assessed from continuous
atmospheric observations at Trinidad,
California
T. J. Lueker
BGD
1, 335–365, 2004Coastal upwelling fluxes
T. J. Lueker
Title Page Abstract Introduction Conclusions References
Tables Figures
◭ ◮
◭ ◮
Back Close
Full Screen / Esc
Print Version
Interactive Discussion
©EGU 2004
Abstract
Continuous atmospheric records of O2/N2, CO2 and N2O obtained at Trinidad,
Cali-fornia document the effects of air-sea exchange during coastal upwelling and plankton bloom events. The atmospheric records provide continuous observations of air-sea fluxes related to synoptic scale upwelling events over several upwelling seasons.
Com-5
bined with satellite, buoy and local meteorology data, calculated anomalies in O2/N2
and N2O were utilized in a simple atmospheric transport model to compute air-sea fluxes during coastal upwelling. CO2 fluxes were linked to the oceanic component
of the O2 fluxes through local hydrographic data and estimated as a function of
up-welling intensity (surface ocean temperature and wind speed). Regional air-sea fluxes
10
of O2/N2, N2O, and CO2during coastal upwelling were estimated with the aid of satellite wind and SST data. Upwelling CO2fluxes were found to represent∼10% of export
pro-duction along the northwest coast of North America. Synoptic scale upwelling events impact the net exchange of atmospheric CO2along the coastal margin, and will vary in response to the frequency and duration of alongshore winds that are subject to climate
15
change.
1. Introduction
The fate of carbon transported to coastal margins is a subject of increasing interest to biogeoscience and climate researchers. Coastal margins have the potential to absorb and transport atmospheric CO2to the interior of the ocean in the forms of organic and
20
inorganic carbon (Walsh, 1991), a process referred to as the “continental shelf pump” (Tsunogai et al., 1999; Frankignoulle and Borges, 2001; Liu et al., 2003; Otsuki et al., 2003; Thomas et al., 2004). Uptake and transport of CO2 in coastal margins consti-tutes a potentially large ocean sink currently underrepresented by ocean carbon cycle
models and global pCO2 surveys (Doney, 1999; Yool and Fasham, 2001; Sarmiento
25
BGD
1, 335–365, 2004Coastal upwelling fluxes
T. J. Lueker
Title Page Abstract Introduction Conclusions References
Tables Figures
◭ ◮
◭ ◮
Back Close
Full Screen / Esc
Print Version
Interactive Discussion
©EGU 2004
dominated by wind forcing, and susceptible to interannual variability as well as global change (Hayward et al., 1999; Chavez et al., 2002; Schwing et al., 2002a, b; Chavez et al., 2003; Murphree et al., 2003a, b). The forces driving the continental shelf pump also have the potential to impact the mechanisms of carbon sequestration and intro-duce rapid changes in both CO2flux and in the ecosystems involved in the transport
5
of carbon to and from the ocean surface (Mangelsdorf et al., 2000; Alvarez-Salgado et al., 2001; Pacala et al., 2001; Barth et al., 2002; Borges et al., 2003; Miller et al., 2003).
Determining the fate of carbon entering the coastal margin along the west coast of North America is a particularly interesting and challenging topic, currently the subject
10
of intensive observation and modelling efforts (Barth et al., 2002; Friederich et al., 2002; Hales et al., 2003; Ianson et al., 2003; Plattner et al., 2003). Multiple pathways for carbon transport, including upwelling through the release of CO2 via sub-surface
ventilation as well as uptake of CO2 through photosynthesis, ocean currents through the transport of sinking biomass and organic matter, and rivers through the supply of
15
continental biomass and soil carbon, contribute to the uptake and removal of inorganic
and organic carbon compounds and CO2 (Ludwig et al., 1996; Opsahl and Benner,
1997; Aumont et al., 2001; Hill and Wheeler, 2002; Dickens et al., 2004). Limited observations of the processes involved in carbon transport at ocean margins cannot yet provide quantification of carbon fluxes on a seasonal or synoptic event level. The
20
expense of ship time and permanent moored instruments combined with the hetero-geneity of ocean margins, particularly the region of the California Current, limits the applicability of oceanographic measurements to the spatial and/or temporal extrap-olations necessary for detecting net air-sea exchange of CO2. And yet a complete
accounting of the exchange of carbon at coastal margins is necessary to begin to
iden-25
tify regional sources and sinks, to properly balance global carbon inventories, and to predict future scenarios of the carbon cycle influenced by global change, the goals of national and international programs (Caldeira, 2001; Wofsy and Harriss, 2002).
BGD
1, 335–365, 2004Coastal upwelling fluxes
T. J. Lueker
Title Page Abstract Introduction Conclusions References
Tables Figures
◭ ◮
◭ ◮
Back Close
Full Screen / Esc
Print Version
Interactive Discussion
©EGU 2004
respiration both on land and in the oceans, provides valuable constraints on several components of the carbon cycle (Keeling and Shertz, 1992; Bender et al., 1998; Bat-tle et al., 2000). The separation of marine and terrestrial oxygen signals can provide further details on the sources of other trace gases, of interest in global change stud-ies, particularly CO2 and N2O (Lueker et al., 2003; Nevison et al., 2004). At Trinidad
5
Head, on the coast in northern California, continuous atmospheric records of O2/N2,
CO2, and N2O provide a direct estimate of air-sea fluxes related to coastal upwelling.
In particular, monitoring of both O2/N2 and CO2 at a coastal site where strong sea-sonal upwelling, high marine primary production, and rich forest ecosystems converge (Fig. 1), provides the means to detect air-sea interactions of the ocean margin
sep-10
arately from land ecosystems. Although the air-sea CO2 fluxes are difficult to detect directly due to the large terrestrial signals, the air-sea O2 fluxes are easily detected,
and the associated carbon fluxes can be inferred with the aid of satellite, ocean buoy, and regional hydrographic data.
2. The Trinidad Head Station 15
Trinidad California is a coastal community located 470 km north of San Francisco and 500 km south of Portland Oregon (41.05◦N, 124.15◦W) in a region where strong
coastal upwelling occurs from March to October (Fig. 1) (Huyer, 1983; Strub et al., 1987a, b; Summerhayes et al., 1994; Pennington and Chavez, 2000). Trinidad Head, a prominent rock outcrop (120 m elevation) on the coast at Trinidad, was selected as
20
a background air observatory in 1995 to monitor trace gases including N2O, CH4, and
CFCs as part of the Advanced Global Atmospheric Gases Experiment (AGAGE) (Prinn et al., 2000) (http://agage.eas.gatech.edu/home.htm). The O2/N2observatory was lo-cated adjacent to the Trinidad Head AGAGE site to take advantage of simultaneous observations of atmospheric trace gases. Trinidad Head has also served as the site of
25
BGD
1, 335–365, 2004Coastal upwelling fluxes
T. J. Lueker
Title Page Abstract Introduction Conclusions References
Tables Figures
◭ ◮
◭ ◮
Back Close
Full Screen / Esc
Print Version
Interactive Discussion
©EGU 2004
Air is sampled from near the top of the 19 m tall USCG radio antenna tower at the peak of Trinidad Head. The atmosphere is analyzed for CO2concentration with a
mod-ified LICOR model 6251 CO2 analyzer. The O2 concentration is determined using a
Servomex paramagnetic oxygen transducer cell (PM1155B) housed in a temperature and motion stabilized environment. Details of the experimental procedure are
pub-5
lished elsewhere (Manning et al., 1999; Lueker et al., 2001). Weather instruments located on the antenna tower provide data on wind direction and velocity, tempera-ture, relative humidity, and photosynthetically active radiation (PAR) averaged over one minute intervals.
Trinidad Head has proven to be an ideal site for atmospheric background
observa-10
tions of many anthropogenic trace gases (Prinn et al., 2000). The CO2record displays variations resulting from local meteorology and fluxes from extensive conifer forests to the east as well as local air-sea fluxes (Fig. 2). A diurnal land-breeze sea-breeze pattern dominates the record with winds in the evening to late morning from the east to south-east carrying elevated CO2 and reduced O2/N2, the result of terrestrial res-15
piration (Lueker et al., 2001). In the early afternoon the winds shift to the west to north-west, bringing baseline marine air to the station until late evening, when the winds again reverse.
Superimposed over and sometimes overwhelming this diurnal cycle are synoptic weather events that vary by season, often influencing coastal ocean circulation, and
20
sometimes result in coastal upwelling. In spring the northward migration of the Aleutian low and the north Pacific high resulting in general strengthening of southerly winds (Strub et al., 1987a, b; Strub and James, 1988; Summerhayes et al., 1994). Southerly winds along the coast combine with the Coriolis force to move surface waters offshore, resulting in the upwelling of deeper waters near shore (Huyer, 1983; Summerhayes et
25
BGD
1, 335–365, 2004Coastal upwelling fluxes
T. J. Lueker
Title Page Abstract Introduction Conclusions References
Tables Figures
◭ ◮
◭ ◮
Back Close
Full Screen / Esc
Print Version
Interactive Discussion
©EGU 2004
fluxes associated with these upwelling events provide readily interpretable signals of carbon dynamics in the coastal margin (Pennington and Chavez, 2000; Friederich et al., 2002; Hales et al., 2003).
3. Description of the data
Atmospheric O2is reported as the difference in the ratio of O2/N2measured against an 5
arbitrary reference, and expressed in per meg units(Keeling et al., 1998).
δ(O2/N2) (per meg)=[(O2/N2)sample/(O2/N2)reference−1]×106. (1)
Note that in per meg units addition of 1µmol of O2to 1 mole of dry air (a change of 1 ppm) will result in an increase of 4.8 per meg.
TheδO2/N2 measurements reported here are 4 min averages of analyzer data col-10
lected every 3 s. CO2 measurements are the 4 min averages corresponding to the
δO2/N2data. Data are calibrated against compressed gases prepared and measured
at the Scripps Institution of Oceanography, traceable to global O2/N2 and CO2
mea-surement programs (Keeling et al., 1998) (Lueker et al., manuscript in preparation).
3.1. Oceanic variations inδ(O2/N2): APO 15
Simultaneous records of O2/N2 and CO2 allow separation of marine and terrestrial
signals in theδ(O2/N2) record. Terrestrial photosynthesis and respiration result in
con-temporaneous gain and release of CO2 and O2 to the atmosphere in a consistent
exchange ratio. Marine photosynthesis and respiration produce similar variations in dissolved gases, however the CO2 air-sea exchange is reduced to∼10% of the cor-20
responding O2flux due to buffering by the ocean carbonate chemistry. Thus, to a first order, atmospheric CO2 variations and the corresponding fraction of the O2/N2
BGD
1, 335–365, 2004Coastal upwelling fluxes
T. J. Lueker
Title Page Abstract Introduction Conclusions References
Tables Figures
◭ ◮
◭ ◮
Back Close
Full Screen / Esc
Print Version
Interactive Discussion
©EGU 2004
to marine processes. To reveal this oceanic signal in theδ(O2/N2) record, the sum, labeled the potential oxygen of the atmosphere (APO), is computed
APO=δ(O2/N2)+(1.1)(4.8)(CO2−350), (2)
where the factor 4.8 converts CO2 from mole fraction (µmole/mole) to per meg units,
where 1.1 is the approximate O2:C exchange ratio associated with land photosynthesis 5
and respiration (Lueker et al., 2001), and where 350 is an arbitrary reference level. APO effectively reveals the oceanic component of the oxygen variations, because on seasonal and shorter time scales, the main source of variability is the exchange of O2
across the air-sea interface, with a small contribution (∼10%) from air-sea exchange
of CO2 (Keeling et al., 1998; Stephens et al., 1998; Gruber et al., 2001). Biomass
10
burning and wildfires produce little change in APO, as the O2:CO2 ratio seen in fire
emissions is similar to the respiration ratio (Lueker et al., 2001). Fossil-fuel burning usually has a negligible effect on APO at Trinidad Head, given the distances to the nearest large population centers. The presence of urban air in the observations at Trinidad is indicated by anthropogenic trace gas species measured at the adjacent
15
AGAGE facility (Prinn et al., 2000), and thus data affected by urban pollution can be removed from the records when necessary.
3.2. Coastal upwelling events
Figure 2 illustrates the seasonal cycles in O2/N2and CO2, as well as the record of
ma-rine O2variations expressed as APO. Superimposed on the APO record are short (3–
20
10 day) periods of low APO, coincident with elevated levels of N2O, and offshore flow
and reduced ocean temperatures characteristic of coastal upwelling conditions (Fig. 3). To highlight the upwelling events, we include in Figs. 2 and 3 the AGAGE record of N2O, the upwelling index recorded at 42◦N provided by the Pacific Fisheries
Environ-mental Laboratory (http://www.pfeg.noaa.gov/products/PFEL), and the ocean
temper-25
ature observations from buoy 46027 (41.85◦N 124.38◦W)
∼100 km north of Trinidad
BGD
1, 335–365, 2004Coastal upwelling fluxes
T. J. Lueker
Title Page Abstract Introduction Conclusions References
Tables Figures
◭ ◮
◭ ◮
Back Close
Full Screen / Esc
Print Version
Interactive Discussion
©EGU 2004
station pge.phtml?station=46027). Reduced APO coincident with elevated N2O, posi-tive upwelling index, and colder water temperatures, identified with grey bands, result from the ventilation of shelf water depleted in O2 and enriched in N2O (Lueker et al.,
2003). Seen at higher resolution (March to October, 2000–2002, Fig. 3) the upwelling indicators consistently co-vary with anomalies in the atmospheric records. Note as well
5
the diurnal respiration signals in O2/N2and CO2. The ratio of N2O to APO variations,
∼1:104, is consistent with the ratio of N2O excess to O2 deficit seen in the sub-mixed
layer waters of the California Current, and is characteristic of the nitrification of organic matter in the ocean interior (Nevison et al., 2004). The episodic exposure of these sub-surface waters leads to N2O evasion and O2invasion in the roughly the ratio observed 10
in the atmospheric records (Lueker et al., 2002, 2003; Nevison et al., 2003, 2004).
3.3. Post upwelling plankton blooms
A closer examination of the APO and N2O variations associated with coastal upwelling
reveals interesting differences in the response of O2 and N2O. While the upwelling
events are uniformly associated with depressions in APO and elevations in N2O, the
15
shapes of the onset and termination often differ. Also, periods of positive APO anoma-lies often follow intense upwelling, e.g. June 2000, June and July 2001, and May 2002 (Fig. 3). SeaWiFS images show that positive APO anomalies are associated with en-hanced Chlorophylla in surface waters offnorthern California (Fig. 4). The injection of nutrients into the euphotic zone during upwelling often supports a plankton bloom
20
within the days or weeks following the cessation of the intense upwelling. The bloom, in turn, can drive a supersaturation of O2in the surface mixed layer. The supersaturated
N2O content of the upwelled surface waters is unaffected by the bloom, even while O2
is ventilated at the sea surface. The atmospheric APO and N2O variations are thus constraining two independent aspects of the coastal biogeochemistry: N2O constrains
25
the rate of ventilation of subsurface waters, while APO constrains a combination of subsurface ventilation and mixed-layer biological production.
BGD
1, 335–365, 2004Coastal upwelling fluxes
T. J. Lueker
Title Page Abstract Introduction Conclusions References
Tables Figures
◭ ◮
◭ ◮
Back Close
Full Screen / Esc
Print Version
Interactive Discussion
©EGU 2004
Trinidad Head in May 2002 indicate that high APO results from marine photosynthe-sis. Samples to 15 m depths were collected during a period of anomalously high APO corresponding to a high productivity (Lueker et al., 2002) (red stripe in Fig. 3 indicates sampling date, [O2] results in Fig. 5). [O2] up to 180% of saturation at the surface falling to near saturation at 15 m implies that strong production signals registered in
5
satellite ocean color data were limited to an extremely shallow layer of the ocean. The high production characterized in APO was part of an anonymous period of high CHLa, resulting from enhanced Subarctic influence in the California Current in 2002 (Huyer, 2003; Thomas et al., 2003; Wheeler et al., 2003).
4. Estimating fluxes – Lagrangian (Puff) model 10
Atmospheric observations of the departure of APO and N2O from background levels
were combined with satellite data on surface winds and SSTs to estimate the air-sea fluxes of O2, and N2O. We used a simple atmospheric transport (“Puff”) model that represents the flux into a well-mixed column of air moving along the continental margin and QSCAT wind data at 0.5 degree resolution to obtain the distance upwind of the
15
station (fetch) and wind speed.
The air-sea flux into a well mixed moving column of air was represented as (Jacob, 1999)
Ft=(∆Ct)(h/td)/(1−exp(−LTH/tdU)), (3)
where∆Ct is the concentration anomaly, h is a vertical mixing height (height of the 20
column),td is the e-folding lifetime for dilution of the air in the column,LTHis the fetch
and U is the wind speed over the upwelling area. The atmospheric column height h
was estimated to be 0.4 km based on Ozone sonds (Snible, pers. com., data provided by NOAA). The air column dilution parameter (td) when varied over a range of 12 to 24 h made little difference in the estimated fluxes (Lueker et al., 2003).
BGD
1, 335–365, 2004Coastal upwelling fluxes
T. J. Lueker
Title Page Abstract Introduction Conclusions References
Tables Figures
◭ ◮
◭ ◮
Back Close
Full Screen / Esc
Print Version
Interactive Discussion
©EGU 2004
A typical O2 flux for a strong upwelling event recorded in APO was computed to be 1.6 mol m−2dy−1corresponding to winds of 15 m sec−1and an atmospheric anomaly of
−100 per meg (20 ppm reduction of O2from background). An equivalent N2O flux was
1.8×10⁻⁴ mol m−2 d−1 for an anomaly of 2.4 nmol/mol (2.4 ppb increase from
back-ground). Atmospheric anomalies in APO and N2O were combined with QSCAT wind
5
fields and extrapolated over the coastal region from 35◦ to 50◦N latitude to provide
re-gional flux estimates. Fluxes were computed and summed over the upwelling seasons (March to November). O2and N2O fluxes are reported in Table 1 (see also Nevison et al., 2004).
5. Estimating CO2fluxes with a gas exchange model and local hydrography 10
Air-sea fluxes during coastal upwelling result in net uptake of atmospheric O2 and a concomitant release of marine CO2, due to high pCO2levels in the upwelled seawater.
Estimation of CO2fluxes directly from anomalies in the atmospheric record is
problem-atic because of terrestrial CO2 variations that are an order of magnitude larger than the marine CO2 flux. However, characterization of the [O2] and pCO2 inventories in 15
upwelled waters enables the CO2fluxes to be related to the O2fluxes observed in the
APO record.
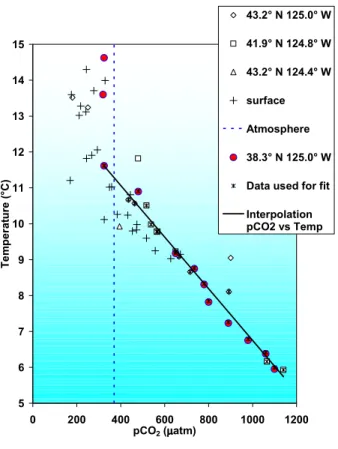
A gas exchange model was applied to observed winds and SSTs during upwelling conditions. The [O2] and pCO2in freshly upwelled waters were predicted from SSTs
based on hydrographic observations along the continental margin of the northwest U.S.
20
(Fig. 6). The available data indicate approximately consistent variation of [N2O], [O2],
and pCO2 with temperature. The co-variation of these dissolved gases with ocean
temperature results from a characteristic balance between remineralization of organic matter, pre-formed gas inventories, and ocean mixing over the geographic area and temperature range of upwelled waters observed between 38◦ to 43◦N. Hydrographic
25
BGD
1, 335–365, 2004Coastal upwelling fluxes
T. J. Lueker
Title Page Abstract Introduction Conclusions References
Tables Figures
◭ ◮
◭ ◮
Back Close
Full Screen / Esc
Print Version
Interactive Discussion
©EGU 2004
primary production have not yet altered the gas content of samples collected at depth. Recent observations show large variations occur in nearshore [O2] and pCO2levels in response to interannual variability in California Current dynamics (Hales et al., 2003; Grantham et al., 2004). While abnormal circulation can bring anomalous [O2] and
pCO2levels to the surface during upwelling conditions, even these extreme departures
5
in [O2] offthe Oregon coast in 2002 (Wheeler et al., 2003) fall within the data envelopes
shown in Fig. 6.
Profiles of N2O, O2and CO2, available for the coastal margin between 35◦and 45◦N
latitude from van Geen et al., and WOCE leg P17 (van Geen et al., 2000) (http://whpo.
ucsd.edu/data/), demonstrate the functional relationship with temperature (Fig. 6). The
10
CO2flux is then formulatedF =K(∆pCO2), whereK, the gas exchange coefficient is a function of SST and wind speed (Wanninkhof, 1992). The gas exchange model was also applied to upwelling N2O and O2 fluxes and was found to give results consistent
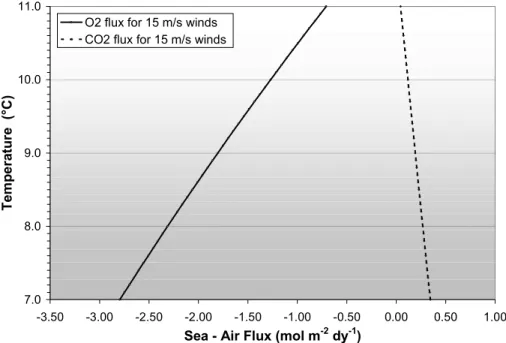
with estimates based on the “Puff” model (Lueker et al., 2003; Nevison et al., 2004). To demonstrate the dynamic relationship of air-sea fluxes of O2 and CO2 over a 15
range of observed upwelling conditions, fluxes were modeled from observed wind speeds and SSTs (Fig. 7). Dissolved Inorganic Carbon (DIC) and Alkalinity (ALK) profile data were converted to pCO2 using carbonate dissociation constants
experi-mentally shown to be appropriate for pCO2formulations (Lueker et al., 2000). Over the
range of observed wind speeds and upwelled ocean temperatures along the coastline,
20
CO2flux varies from 12% of the O2flux at 7◦C to 6% of the O2flux at 11◦C. Redfield
ra-tios of marine organic matter predict an C:O2ratio of 117/170, however the carbonate
equilibria in seawater result in much smaller CO2:O2ratios in the air-sea flux (Keeling et al., 1998; Stephens et al., 1998). CO2 upwelling fluxes, scaled to the regional O2
fluxes for the years 2000, 2001 and 2002 are given in Table 1. An APO anomaly of 100
25
BGD
1, 335–365, 2004Coastal upwelling fluxes
T. J. Lueker
Title Page Abstract Introduction Conclusions References
Tables Figures
◭ ◮
◭ ◮
Back Close
Full Screen / Esc
Print Version
Interactive Discussion
©EGU 2004
6. Estimates of carbon uptake in coastal waters
How do upwelling CO2 fluxes compare to the “continental shelf pump” or net air-sea
fluxes along the coastal margin of North America? While the direction of net air-sea flux of CO2remains a topic of active research and debate, an estimate is provided from satellite ocean color and SST data.
5
Upwelling CO2 fluxes were compared to net primary production (NPP) and
ex-port production (EP) in the coastal region. Coastal ocean NPP was evaluated from ocean color and SST data (SeaWiFS and MODIS) (M. Kahru, pers. com. 2003, see also (Behrenfeld and Falkowski, 1997; Mitchell and Kahru, 1998; Kahru and Mitchell, 2002). Six regions offshore of the west coast of North America were evaluated using a
10
Behrenfeld-Falkowski vertically generalized production model (VGPM) (Laws, 2004a) corresponding to the years of our record at Trinidad Head (2000–2002). Integrating the model productivity over the coastal region from 35◦–50◦N, NPP was estimated over
the same time intervals as the upwelling sea-air flux of CO2reported in Table 1. Export
production of the coastal margin was also estimated from the combination of satellite
15
ocean color and temperature data. The export production of the coastal area was pre-dicted to be about 55% of NPP. The CO2upwelling flux was about 5% of NPP, or 10%
of EP. Recent studies suggest the modeled export production might be over-estimated in upwelling areas (Laws, 2004b), so the 10% value might represent a lower limit for ventilation of CO2sequestered by export production along the coastal margin.
20
7. Conclusions
A relevant question for the budgeting of carbon exchange fluxes over the North Amer-ican concerns the modification of the CO2 content of air from air-sea fluxes over the
continental margins. Upwelling ventilates ocean margin CO2, directly impacting the
marine air, characterized as “baseline”, as we have documented at Trinidad Head.
Fur-25
BGD
1, 335–365, 2004Coastal upwelling fluxes
T. J. Lueker
Title Page Abstract Introduction Conclusions References
Tables Figures
◭ ◮
◭ ◮
Back Close
Full Screen / Esc
Print Version
Interactive Discussion
©EGU 2004
response to future climate change are potentially large (Miller et al., 2003). Continu-ous records of O2/N2, CO2and N2O obtained at Trinidad capture the effects of air-sea
exchange during coastal upwelling and plankton bloom events. These observations provide direct evidence of the magnitude of air-sea fluxes and demonstrate the impor-tance of synoptic scale events on the overall carbon budget in the coastal margin of
5
western North America. Meteorological and satellite observations of winds and sur-face ocean temperature provide means to calculate 1st order fluxes on an event by event scale. The consistency of dissolved gas concentrations in subsurface waters of the California Current provides an estimate of CO2upwelling fluxes that can be scaled
to atmospheric O2/N2 observations, providing a means to assess coastal CO2 fluxes
10
during upwelling events. Upwelling fluxes could represent upwards of 10% of coastal margin export production along the west coast of North America.
Acknowledgements. This study was funded by NASA ESE under grants NAG5-6179 and NAG5-10737, and was made possible by generous assistance and input from the staffof the Atmospheric Oxygen Research Group at S.I.O. especially R. Keeling, P.I. Stephen Walker
pro-15
vided computer programming and data analysis, B. Paplawski, engineering and chemical ex-pertise, A. Cox, gas cylinder preparation and handling, J. Cooper, data processing, and A. Hartounian, PC and instrument fabrication and software support. N2O data were provided by the AGAGE program at S.I.O. headed by R. Weiss. P. Salameh and C. Harth provided AGAGE data support. Trinidad Station support was provided by W. Snible and R. Dickau. Shipboard
20
sample collection and analyses were provided by R. Barnes at H.S.U. B. G. Mitchell and M. Kahru provided discussion and results and from the VGPM model runs. This manuscript is the product of many valuable discussions with colleagues, including C. Nevison (NCAR), R. Hamme (S.I.O.), B. Miller (S.I.O.), B. Hales (O.S.U.), D. Chelton (O.S.U.), and others.
References 25
BGD
1, 335–365, 2004Coastal upwelling fluxes
T. J. Lueker
Title Page Abstract Introduction Conclusions References
Tables Figures
◭ ◮
◭ ◮
Back Close
Full Screen / Esc
Print Version
Interactive Discussion
©EGU 2004
Aumont, O., Orr, J. C., Monfray, P., Ludwig, W., Amiotte-Suchet, P., and Probst, J. L.: Riverine-driven interhemispheric transport of carbon, Global Biogeochemical Cycles, 15, 393–405, 2001.
Barth, J. A., Cowles, T. J., Kosro, P. M., Shearman, R. K., Huyer, A., and Smith, R. L.: Injection of carbon from the shelf to offshore beneath the euphotic zone in the California Current – art.
5
no. 3057, J. Geophys. Res.-Oceans, 107, 3057, 10-1–10-6, 2002.
Battle, M., Bender, M. L., Tans, P. P., White, J. W. C., Ellis, J. T., Conway, T., and Francey, R. J.: Global carbon sinks and their variability inferred from atmospheric O-2 and delta C-13, Science, 287, 2467–2470, 2000.
Behrenfeld, M. J. and Falkowski, P. G.: Photosynthetic Rates Derived from Satellite-Based
10
Chlorophyll Concentration, Limnology & Oceanography 42, 1–20, 1997.
Bender, M. L., Battle, M., and Keeling, R. F.: The O-2 balance of the atmosphere: A tool for studying the fate of fossil-fuel CO2, Annual Review of Energy and the Environment, 23, 207–223, 1998.
Borges, A. V., Djenidi, S., Lacroix, G., Theate, J., Delille, B., and Frankignoulle, M.: Atmospheric
15
CO2flux from mangrove surrounding waters – art. no. 1558, Geophys. Res. Lett., 30, 1558, 12-1–12-3, 2003.
Caldeira, K. D., De Baar, H., Gruber, N., Wallace, D. W. R.: JGOFS report no. 33 – Joint IGBP EU-US meeting on the ocean component of an integrated carbon cycle science framework, Paris, 2001.
20
Chavez, F. P., Ryan, J., Lluch-Cota, S. E., and Niquen, M.: From anchovies to sardines and back: Multidecadal change in the Pacific Ocean (Review), Science 299, 217–221, 2003. Chavez, F. P., Pennington, J. T., Castro, C. G., Ryan, J. P., Michisaki, R. P., Schlining, B. et
al.: Biological and chemical consequences of the 1997–1998 El Ni ˜no in central California waters, Progress in Oceanography, 54, 205–232, 2002.
25
Dickens, A. F., Gelinas, Y., Masiello, C. A., Wakeham, S., and Hedges, J. I.: Reburial of fossil organic carbon in marine sediments, Nature, 427, 336–339, 2004.
Doney, S. C.: Major challenges confronting marine biogeochemical modeling, Global Biogeo-chemical Cycles, 13, 705–714, 1999.
Frankignoulle, M. and Borges, A. V.: European continental shelf as a significant sink for
atmo-30
spheric carbon dioxide, Global Biogeochemical Cycles, 15, 569–576, 2001.
BGD
1, 335–365, 2004Coastal upwelling fluxes
T. J. Lueker
Title Page Abstract Introduction Conclusions References
Tables Figures
◭ ◮
◭ ◮
Back Close
Full Screen / Esc
Print Version
Interactive Discussion
©EGU 2004
in Oceanography, 54, 185–203, 2002.
Grantham, B. A., Chan, F., Nielsen, K. J., Fox, D. S., Barth, J. A., Huyer, A. et al.: Upwelling-driven nearshore hypoxia signals ecosystem and oceanographic changes in the northeast Pacific, Nature, 429, 749–754, 2004.
Gruber, N., Gloor, M., Fan, S. M., and Sarmiento, J. L.: Air-sea flux of oxygen estimated
5
from bulk data: Implications for the marine and atmospheric oxygen cycles (Review), Global Biogeochemical Cycles, 15, 783–803, 2001.
Hales, B., Karp-Boss, L., Moum, J., Wheeler, P., Covert, P., and Bandstra, L.: Off-Shelf Export of POC from the Oregon Coast: Implications for Uptake of Atmospheric CO2, Eos Trans. AGU, Ocean Sci. Meet. Suppl., Abstract 84, Abstract OS51L-02, 2003.
10
Hayward, T. L., Baumgartner, T. R., Checkley, D. M., Durazo, R., Gaxiola-Castro, G., Hyren-bach, K. D. et al.: The state of the California Current in 1998–1999: Transition to cool-water conditions, California Cooperative Oceanic Fisheries Investigations Reports, 40, 29– 62, 1999.
Hill, J. K. and Wheeler, P. A.: Organic carbon and nitrogen in the northern California current
sys-15
tem: comparison of offshore, river plume, and coastally upwelled waters (Review), Progress in Oceanography, 53, 369–387, 2002.
Huyer, A.: Coastal upwelling in the California Current system, Progress in Oceanography, 12, 259–284, 1983.
Huyer, A.: Preface to special section on enhanced Subarctic influence in the California Current,
20
2002 – art. no. 8019, Geophys. Res. Lett., 30, 8019, CCR 1-1–CCR 1-3, 2003.
Ianson, D., Allen, S. E., Harris, S. L., Orians, K. J., Varela, D. E., and Wong, C. S.: The inorganic carbon system in the coastal upwelling region west of Vancouver Island, Canada, Deep-Sea Research Part I-Oceanographic Research Papers, 50, 1023–1042, 2003.
Jacob, D.: Introduction to atmospheric chemistry, Princeton, NJ, Princeton University Press,
25
1999.
Kahru, M. and Mitchell, B. G.: Influence of the El Nino-La Nina cycle on satellite-derived primary production in the California Current – art. no. 1846, Geophys. Res. Lett., 29, 1846, 27-1–27-3, 2002.
Keeling, R. F. and Shertz, S. R.: Seasonal and Interannual Variations in Atmospheric Oxygen
30
and Implications for the Global Carbon Cycle, Nature, 358, 723–727, 1992.
BGD
1, 335–365, 2004Coastal upwelling fluxes
T. J. Lueker
Title Page Abstract Introduction Conclusions References
Tables Figures
◭ ◮
◭ ◮
Back Close
Full Screen / Esc
Print Version
Interactive Discussion
©EGU 2004
Air, J. Geophys. Res.-Atmos., 103, 3381–3397, 1998.
Laws, E.: Export flux and stability as regulators of community composition in pelagic marine biological communities: implications for regime shifts (Review), Progress in Oceanography, 60, 343–354, 2004a.
Laws, E. A.: New production in the equatorial Pacific: a comparison of field data with estimates
5
derived from empirical and theoretical models, Deep-Sea Research Part I-Oceanographic Research Papers, 51, 205–211, 2004b.
Liu, K. K., Peng, T. H., Shaw, P. T., and Shiah, F. K.: Circulation and biogeochemical processes in the East China Sea and the vicinity of Taiwan: an overview and a brief synthesis, Deep-Sea Research Part II-Topical Studies in Oceanography, 50, 1055–1064, 2003.
10
Ludwig, W., Probst, J. L., and Kempe, S.: Predicting the oceanic input of organic carbon by continental erosion (Review), Global Biogeochemical Cycles, 10, 23–41, 1996.
Lueker, T. J., Dickson, A. G., and Keeling, C. D.: Ocean pCO(2) calculated from dissolved inorganic carbon, alkalinity, and equations for K-1 and K-2: validation based on laboratory measurements of CO2in gas and seawater at equilibrium, Marine Chemistry, 70, 105–119,
15
2000.
Lueker, T. J., Keeling, R. F., and Dubey, M. K.: The oxygen to carbon dioxide ratios observed in emissions from a wildfire in Northern California, Geophys. Res. Lett., 28, 2413–2416, 2001. Lueker, T. J., Keeling, R. F., and Barnes, R.: Coastal upwelling and plankton bloom dynamics observed in atmospheric O2/N2 and CO2 records at Trinidad, California, Eos Trans. AGU,
20
San Francisco: Eos Trans. AGU, OS62A-0231, 2002.
Lueker, T. J., Walker, S. J., Vollmer, M. K., Keeling, R. F., Nevison, C. D., Weiss, R. F., and Gar-cia, H. E.: Coastal upwelling air-sea fluxes revealed in atmospheric observations of O2/N2, CO2and N2O, Geophys. Res. Lett., 30, 25-1–25-4, 2003.
Mangelsdorf, K., Guntner, U., and Rullkotter, J.: Climatic and oceanographic variations on the
25
California continental margin during the last 160 kyr, Organic Geochemistry, 31, 829–846, 2000.
Manning, A. C., Keeling, R. F., and Severinghaus, J. P.: Precise atmospheric oxygen measure-ments with a paramagnetic oxygen analyzer, Global Biogeochemical Cycles, 13, 1107–1115, 1999.
30
BGD
1, 335–365, 2004Coastal upwelling fluxes
T. J. Lueker
Title Page Abstract Introduction Conclusions References
Tables Figures
◭ ◮
◭ ◮
Back Close
Full Screen / Esc
Print Version
Interactive Discussion
©EGU 2004
Mitchell, B. G. and Kahru, M.: Algorithms for SeaWiFS standard products developed with the CalCOFI big-optical data set, California Cooperative Oceanic Fisheries Investigations Re-ports, 39, 133–147, 1998.
Murphree, T., Bograd, S. J., Schwing, F. B., and Ford, B.: Large scale atmosphere-ocean anomalies in the northeast Pacific during 2002 – art. no. 8026, Geophys. Res. Lett., 30,
5
8026, 22-1–22-3, 2003a.
Murphree, T., Green-Jessen, P., Schwing, F. B., and Bograd, S. J.: The seasonal cycle of wind stress curl and its relationship to subsurface ocean temperature in the Northeast Pacific – art. no. 1469, Geophys. Res. Lett., 30, 1469, 221–22-3, 2003b.
Nevison, C. D., Lueker, T. J., and Weiss, R. F.: Quantifying the Nitrous Oxide Source from
10
Coastal Upwelling. Eos Trans. AGU, Ocean Sci. Meet. Suppl., Abstract 84, Abstract OS32D-01, 2003.
Nevison, C. D., Lueker, T. J., and Weiss, R. F.: Qualifying the Nitrous Oxide source from coastal upwelling, Global Biogeochemical Cycles, 18, doi:10.1029/2003GB002110, 2003.
Opsahl, S. and Benner, R.: Distribution and Cycling of Terrigenous Dissolved Organic Matter
15
in the Ocean, Nature, 386, 480–482, 1997.
Otsuki, A. S., Watanabe, S., and Tsunogai, S.: Absorption of atmospheric CO2and its transport to the intermediate layer in the Okhotsk Sea. Journal of Oceanography, 59, 709–717, 2003. Pacala, S. W., Hurtt, G. C., Baker, D., Peylin, P., Houghton, R. A., Birdsey, R. A. et al.:
Con-sistent land- and atmosphere-based US carbon sink estimates, Science, 292, 2316–2320,
20
2001.
Pennington, J. T. and Chavez, F. P.: Seasonal fluctuations of temperature, salinity, nitrate, chlorophyll and primary production at station H3/M1 over 1989–1996 in Monterey Bay, Cali-fornia, Deep-Sea Research, Part II (Topical Studies in Oceanography), 47, 947–973, 2000. Plattner, G., Frenzel, H., Gruber, N., Leinweber, A., Marchesiello, P., McWilliams, J. C. et
25
al.: Physical-Biogeochemical Interactions and CO2 Air-Sea Exchange Along the U.S. West Coast, Eos Trans. AGU, Ocean Sci. Meet. Suppl., Abstract 84: Abstract OS51L-01, 2003. Prinn, R. G., Weiss, R. F., Fraser, P. J., Simmonds, P. G., Cunnold, D. M., Alyea, F.
N. et al.: A history of chemically and radiatively important gases in air deduced from ALE/GAGE/AGAGE, J. Geophys. Res.- Atmos., 105, 17 751–17 792, 2000.
30
Sarmiento, J. L. and Gruber, N.: Sinks for anthropogenic carbon, Physics Today, 55, 30–36, 2002.
BGD
1, 335–365, 2004Coastal upwelling fluxes
T. J. Lueker
Title Page Abstract Introduction Conclusions References
Tables Figures
◭ ◮
◭ ◮
Back Close
Full Screen / Esc
Print Version
Interactive Discussion
©EGU 2004
climate index for the northeast Pacific (Review), Progress in Oceanography, 53, 115–139, 2002a.
Schwing, F. B., Murphree, T., deWitt, L., and Green, P. M.: The evolution of oceanic and atmospheric anomalies in the northeast Pacific during the El Ni ˜no and La Ni ˜na events of 1995–2001, Progress in Oceanography, 54, 459–491, 2002b.
5
Stephens, B. B., Keeling, R. F., Heimann, M., Six, K. D., Murnane, R., and Caldeira, K.: Test-ing global ocean carbon cycle models usTest-ing measurements of atmospheric O-2 and CO2 concentration. Global Biogeochemical Cycles, 12, 213–230, 1998.
Strub, P. T. and James, C.: Atmospheric Conditions During the Spring and Fall Transitions in the Coastal Ocean OffWestern United-States, J. Geophys. Res.-Oceans, 93, 15 561–15 584,
10
1988.
Strub, P. T., Allen, J. S., Huyer, A., and Smith, R. L.: Large-Scale Structure of the Spring Transition in the Coastal Ocean OffWestern North-America, J. Geophys. Res.-Oceans, 92, 1527–1544, 1987a.
Strub, P. T., Allen, J. S., Huyer, A., Smith, R. L., and Beardsley, R. C.: Seasonal Cycles of
15
Currents, Temperatures, Winds, and Sea-Level over the Northeast Pacific Continental-Shelf – 35◦N to 48ci rcN, J. Geophys. Res.-Oceans, 92, 1507–1526, 1987b.
Summerhayes, C. P., Emeis, K.-C., Angel, M. V., Smith, R. L., and Zeitzschel, B.: Upwelling in the Ocean Modern Processes and Ancient Records, in Dahlem Workshop on Upwelling in the Ocean: Modern Processes and Ancient Records, edited by Summerhayes, C. P., Emeis,
20
K.-C., Angel, M. V., Smith, R. L., and Zeitzschel, B., Berlin, John Wiley and Sons, 422, 1994. Takahashi, T., Sutherland, S. C., Sweeney, C., Poisson, A., Metzl, N., Tilbrook, B. et al.: Global sea-air CO2flux based on climatological surface ocean pCO2, and seasonal biological and temperature effects, Deep-Sea Research Part II-Topical Studies in Oceanography, 49, 1601– 1622, 2002.
25
Thomas, A. C., Strub, P. T., and Brickley, P.: Anomalous satellite-measured chlorophyll concen-trations in the northern California Current in 2001–2002, art. no. 8022, Geophys. Res. Lett., 30, 8022, 4-1–4-3, 2003.
Thomas, H., Bozec, Y., Elkalay, K., and de Baar, H. J. W.: Enhanced open ocean storage of CO2from shelf sea pumping, Science, 304, 1005–1008, 2004.
30
BGD
1, 335–365, 2004Coastal upwelling fluxes
T. J. Lueker
Title Page Abstract Introduction Conclusions References
Tables Figures
◭ ◮
◭ ◮
Back Close
Full Screen / Esc
Print Version
Interactive Discussion
©EGU 2004
Carbon and nutrient dynamics during coastal upwelling offCape Blanco, Oregon. Deep-Sea Research Part Ii-Topical Studies in Oceanography, 47, 975–1002, 2000.
Walsh, J. J.: Importance of Continental Margins in the Marine Biogeochemical Cycling of Car-bon and Nitrogen, Nature, 350, 53–55, 1991.
Wanninkhof, R.: Relationship between Wind Speed and Gas Exchange over the Ocean, J.
5
Geophys. Res.-Oceans., 97, 7373–7382, 1992.
Wheeler, P. A., Huyer, A., and Fleischbein, J.: Cold halocline, increased nutrients and higher chlorophyll off Oregon in 2002, art. no. 8021, Geophys. Res. Lett., 30, 8021, CCR 3-1– CCR3-3, 2003.
Wofsy, S. C. and Harriss, R. J.: The North American Carbon Program (NACP), in: Agencies of
10
the U.S. Global Change Research Program, 1–62, 2002.
BGD
1, 335–365, 2004Coastal upwelling fluxes
T. J. Lueker
Title Page Abstract Introduction Conclusions References
Tables Figures
◭ ◮
◭ ◮
Back Close
Full Screen / Esc
Print Version
Interactive Discussion
©EGU 2004
Table 1. Fluxes computed for the upwelling season (March to November) from 35 to 50◦N latitude. O2fluxes were computed with the atmospheric transport (“Puff”) model for each up-welling event using the upwind fetch and windspeed from QSCAT data. The resulting fluxes were summed from March to November and the sum divided by the area along the coastline from 35 to 50◦N latitude with the distance o
ffshore defined by the Rossby radius of deformation (1500×40 km). CO2 flux was scaled to the integrated O2 fluxes using air-sea gas exchange relationships [F=K ∆g Ca–Cw)] predicted from regional hydrographic data (van Geen et al., 2000) (also data from WOCE P17N). Kahru and Mitchell provided satellite derived net primary production (NPP) and export production (EP) data, integrated over the same area from the VGPM model using 9 km gridded data (SeaWiFS, and MODIS) along the continental margin.
Yr O2flux CO2flux N2O flux NPP EP CO2flux
atm. model atm. model atm. model % of E.P.
g O2m−2
g C m−2
mmol m−2
g C m−2
g C m−2
%
2000 −86.4 3.2 0.5 67 36 8.9
2001 −80.0 3.0 0.6 71 40 7.5
BGD
1, 335–365, 2004Coastal upwelling fluxes
T. J. Lueker
Title Page Abstract Introduction Conclusions References
Tables Figures
◭ ◮
◭ ◮
Back Close
Full Screen / Esc
Print Version
Interactive Discussion
©EGU 2004
BGD
1, 335–365, 2004Coastal upwelling fluxes
T. J. Lueker
Title Page Abstract Introduction Conclusions References
Tables Figures
◭ ◮
◭ ◮
Back Close
Full Screen / Esc
Print Version
Interactive Discussion
©EGU 2004
Fig. 2.Time series of atmospheric records from Trinidad Head, CA.δ(O2/N2), CO2, APO, and N2O mole fractions shown with Bakun upwelling index at 42◦N and SSTs observed at NOAA Buoy 46027 (41.85◦N). Background levels for O
BGD
1, 335–365, 2004Coastal upwelling fluxes
T. J. Lueker
Title Page Abstract Introduction Conclusions References
Tables Figures
◭ ◮
◭ ◮
Back Close
Full Screen / Esc
Print Version
Interactive Discussion
©EGU 2004
Fig. 3. Coastal upwelling events identified in the Trinidad atmospheric records. Periods of anomalously low APO are shaded in the figures for the years 2000–2003. Anomalously low oxygen corresponds to elevated levels of N2O, reduced SSTs, and to a lesser extent to the upwelling index at 42◦N. Note the Red line in 2002 designates the date of [O
BGD
1, 335–365, 2004Coastal upwelling fluxes
T. J. Lueker
Title Page Abstract Introduction Conclusions References
Tables Figures
◭ ◮
◭ ◮
Back Close
Full Screen / Esc
Print Version
Interactive Discussion
©EGU 2004
BGD
1, 335–365, 2004Coastal upwelling fluxes
T. J. Lueker
Title Page Abstract Introduction Conclusions References
Tables Figures
◭ ◮
◭ ◮
Back Close
Full Screen / Esc
Print Version
Interactive Discussion
©EGU 2004
BGD
1, 335–365, 2004Coastal upwelling fluxes
T. J. Lueker
Title Page Abstract Introduction Conclusions References
Tables Figures
◭ ◮
◭ ◮
Back Close
Full Screen / Esc
Print Version
Interactive Discussion
©EGU 2004
BGD
1, 335–365, 2004Coastal upwelling fluxes
T. J. Lueker
Title Page Abstract Introduction Conclusions References
Tables Figures
◭ ◮
◭ ◮
Back Close
Full Screen / Esc
Print Version
Interactive Discussion
©EGU 2004
-16 -14 -12 -10 -8 -6 -4 -2 0
0 50 100 150 200
O2 % saturation
D
e
pth (m)
Station 3 (11 Km offshore)
Station 2 (10 Km offshore)
Station 1( 8.5 Km offshore)
Equilibrium with atmosphere
BGD
1, 335–365, 2004Coastal upwelling fluxes
T. J. Lueker
Title Page Abstract Introduction Conclusions References
Tables Figures
◭ ◮
◭ ◮
Back Close
Full Screen / Esc
Print Version
Interactive Discussion
©EGU 2004
4 5 6 7 8 9 10 11 12 13 14 15
0 100 200 300 400
[O2] ( µµµµmol kg-1 )
Te
m
p
(
°C
)
39° N 124° W (multi stations)
44.6° N 125.1° W STN 1
44.6° N 125.1° W STN 2
Interpolation [O2] vs. Temperature
BGD
1, 335–365, 2004Coastal upwelling fluxes
T. J. Lueker
Title Page Abstract Introduction Conclusions References
Tables Figures
◭ ◮
◭ ◮
Back Close
Full Screen / Esc
Print Version
Interactive Discussion
©EGU 2004
5 6 7 8 9 10 11 12 13 14 15
0 200 400 600 800 1000 1200
pCO2 (µµµµatm)
T
e
m
p
er
at
u
re (
°C)
43.2° N 125.0° W
41.9° N 124.8° W
43.2° N 124.4° W
surface
Atmosphere
38.3° N 125.0° W
Data used for fit
Interpolation pCO2 vs Temp
BGD
1, 335–365, 2004Coastal upwelling fluxes
T. J. Lueker
Title Page Abstract Introduction Conclusions References
Tables Figures
◭ ◮
◭ ◮
Back Close
Full Screen / Esc
Print Version
Interactive Discussion
©EGU 2004
3 4 5 6 7 8 9 10 11 12 13 14
0 10 20 30 40 50 60
[N2O] (nmol/kg)
T
em
p
er
at
u
re
(
°C)
36.3° N 122.1° W
44.6° N 125.1° W STN 1
44.6° N 125.1° W STN 2
Interpolation [N2O] vs. Temperature
BGD
1, 335–365, 2004Coastal upwelling fluxes
T. J. Lueker
Title Page Abstract Introduction Conclusions References
Tables Figures
◭ ◮
◭ ◮
Back Close
Full Screen / Esc
Print Version
Interactive Discussion
©EGU 2004
7.0 8.0 9.0 10.0 11.0
-3.50 -3.00 -2.50 -2.00 -1.50 -1.00 -0.50 0.00 0.50 1.00
Sea - Air Flux (mol m-2 dy-1)
Te
m
p
e
rat
ur
e
(
°C
)
O2 flux for 15 m/s winds CO2 flux for 15 m/s winds
![Fig. 5. [O 2 ] sampled o ff Trinidad Head in May 2002. Expressed as % saturation, the data show [O 2 ] with the greatest concentrations at the surface, decreasing toward shore and with depth to near or below saturation at 15 m.](https://thumb-eu.123doks.com/thumbv2/123dok_br/18289372.346432/27.918.185.520.74.504/sampled-trinidad-expressed-saturation-greatest-concentrations-decreasing-saturation.webp)
![Fig. 6. Hydrographic profile data from the Pacific Northwest plotted vs. temperature. Data from several cruises located from Oregon to central California and 1990 to 1998 are represented in plots of [O 2 ], [N 2 O] and pCO 2](https://thumb-eu.123doks.com/thumbv2/123dok_br/18289372.346432/28.918.181.522.41.486/hydrographic-profile-pacific-northwest-temperature-located-california-represented.webp)