TCR
a
and
b
Transgenes by Next-Generation Sequencing
Yun Ji1*, Natalie Abrams2, Wei Zhu1, Eddie Salinas2, Zhiya Yu3, Douglas C. Palmer3, Parthav Jailwala2, Zulmarie Franco3, Rahul Roychoudhuri3, Eric Stahlberg2, Luca Gattinoni1., Nicholas P. Restifo3
*.
1Experimental Transplantation and Immunology Branch, Center for Cancer Research, National Cancer Institute, National Institutes of Health, Bethesda, Maryland, United States of America,2Advanced Biomedical Computing Center, Frederick National Laboratory for Cancer Research, Frederick, Maryland, United States of America,3Surgery Branch, Center for Cancer Research, National Cancer Institute, National Institutes of Health, Bethesda, Maryland, United States of America
Abstract
The pmel-1 T cell receptor transgenic mouse has been extensively employed as an ideal model system to study the mechanisms of tumor immunology, CD8+T cell differentiation, autoimmunity and adoptive immunotherapy. The ‘zygosity’
of the transgene affects the transgene expression levels and may compromise optimal breeding scheme design. However, the integration sites for the pmel-1 mouse have remained uncharacterized. This is also true for many other commonly used transgenic mice created before the modern era of rapid and inexpensive next-generation sequencing. Here, we show that whole genome sequencing can be used to determine the exact pmel-1 genomic integration site, even with relatively ‘shallow’ (8X) coverage. The results were used to develop a validated polymerase chain reaction-based genotyping assay. For the first time, we provide a quick and convenient polymerase chain reaction method to determine the dosage of pmel-1 transgene for this freely and publically available mouse resource. We also demonstrate that next-generation sequencing provides a feasible approach for mapping foreign DNA integration sites, even when information of the original vector sequences is only partially known.
Citation:Ji Y, Abrams N, Zhu W, Salinas E, Yu Z, et al. (2014) Identification of the Genomic Insertion Site of Pmel-1 TCRaandbTransgenes by Next-Generation Sequencing. PLoS ONE 9(5): e96650. doi:10.1371/journal.pone.0096650
Editor:Zhiyuan Gong, National University of Singapore, Singapore
ReceivedFebruary 21, 2014;AcceptedApril 9, 2014;PublishedMay 14, 2014
This is an open-access article, free of all copyright, and may be freely reproduced, distributed, transmitted, modified, built upon, or otherwise used by anyone for any lawful purpose. The work is made available under the Creative Commons CC0 public domain dedication.
Funding:This work was supported by the Intramural Research Program of the National Cancer Institute, Center for Cancer Research of the US National Institutes of Health. The funders had no role in study design, data collection and analysis, decision to publish, or preparation of the manuscript.
Competing Interests:The authors have declared that no competing interests exist. * E-mail: [email protected] (YJ); [email protected] (NPR)
.These authors contributed equally to this work.
Introduction
Transgenic animal models are indispensable resources for studies of gene function and disease. Their construction often involves large bacterial or yeast artificial chromosomes, which are used to assemble the transgene [1]. Unfortunately, many transgenic lines remain poorly characterized, and the method for generating these transgenic animals (i.e. the injection of genetic material into the pro-nucleus of a fertilized egg) results in the random integration of foreign transgenic DNA into the genome [1]. Generally transgenic animals are commonly evaluated by Southern blot to determine gene incorporation [1]. Southern blotting can also provide a rough estimate of copy number, but does not indicate zygosity. The site of integration, the possibility of rearrangements of the transgene and potential deletions of non-lethal native DNA at the site of integration remain unknown for most transgenic lines. It is worth noting here that transgenes may tend to integrate into sites of active gene transcription. Further-more, many non-lethal sites of integration can disrupt or alter the function of genes that although non-lethal but key to physiologic functions [1]. Thus, random and unknown integration of transgenes can affect the behavior of transgenic mice in unpredictable ways [1].
To minimize ‘unknown unknowns’ and to design optimal breeding schemes or evaluate dosage effects of transgenic animals,
The pmel-1 mouse was developed as a model system for studying the treatment of malignant melanoma using adoptive cell therapy [7]. The target antigen, pmel-17, is an ortholog of the melanocyte differentiation antigen gp100, which is often overex-pressed in human melanomas [8]. Adoptive transfer of transgenic T cells expressing the gp100-specific T cell receptor (TCR) from pmel-1 mice can effectively mediate the regression of large established tumors when administered in combination with a lymphodepleting preconditioning regimen [9–13], exogenous cc cytokine [7,9,14–18], and vaccination with the cognate antigen [7,15,19,20]. Pmel-1 mouse now is available from the Jackson laboratory (http://www.jax.org).
Recent clinical success of T cell-based cancer immunotherapy [21–27] has resulted in a surge in demand for the pmel-1 mouse as an ideal model system to study the mechanism of tumor immunology, CD8+T cell differentiation, and adoptive
immuno-therapy [28–59]. Moreover, pmel-1 mice have been increasingly employed to study autoimmune vitiligo [7,60–64] and uveitis [61,63,65]. The pmel-1 mouse was generated using two transgenic vectors, which contained variable domains of the endogenous TCR as described previously [7] (Figure S1). To design an efficient breeding scheme with other transgenes, it is essential to identify the zygosity status of the pmel-1 transgene. However, the highly identical and repetitive nature of transgenic TCRaandbchains with the endogenous loci and the large size of the construction vectors made it especially daunting to determine the integration site with established methods. Currently, determination of whether a mouse that is genotypically positive for the pmel-1 transgene is homozygous or heterozygous relies on observation of Mendelian inheritance rules, which is a time-consuming and labor-intensive process.
Here we propose an alternative strategy to identify pmel-1 genomic integration site(s) based on shallow next-generation sequencing (NGS) of the entire transgenic mouse genome. Recently, a transgenic insertion site was identified by using a combination of microarray hybrid capture and NGS analysis [66]. This approach can be very useful when the sequence of a transgene is known, which is not applicable for the pmel-1 case. In this study, we applied the NGS to analyze the pmel-1 genome and successfully identified the integration site of pmel-1 TCRaandb
transgenes. This information allowed us to design PCR assay to easily distinguish heterozygous from homozygous animals. The results obtained by PCR were consistent with previous observation that pmel-1 homozygous or heterozygous CD8+T cells can be
distinguished by different tetramer staining efficiency, confirming the results obtained from the NGS data analysis.
Methods
Ethics statement
The care and use of all mice in this study was carried out with the approval of the National Cancer Institute Animal Use and Care Committee (protocol#SB-126).
Mice
Pmel-1 (B6.Cg-Thy1a/Cy Tg(TcraTcrb)8Rest/J) were obtained from the Jackson Laboratory.
Antibodies and flow cytometry
We purchased all FACS antibodies from BD Biosciences Flow cytometry acquisition was performed on a BD FACSCanto Ior BD FACSCantoIIflow cytometer. Samples were analyzed with FlowJo software (Tree Star).
Genomic DNA sample preparation
Genomic DNA (gDNA) was extracted from pmel-1 homozygous transgenic animal tail with OmniPrep for Tissue (G BIOSCI-ENCES) following the manufacturer’s instruction. Genomic DNA was analyzed by nanodrop and agarose gel to verify the quality (O.D. 260/280 ratio is more than 1.8) and quantity (1 ug for library construction).
Illumina library preparation and sequencing
Sequencing was done on Illumina HiSeq 2000 using TruSeq v3 chemistry at the Center for Cancer Research sequencing facility, SAIC-Frederick/FNLCR, Frederick, MD. The gDNA sample was sequenced on one individual lane with paired-end read length of 101 bp. Raw data was processed and basecalling performed using the standard Illumina pipeline (CASAVA version 1.8.2 and RTA version 1.8.70.0).
Illumina data quality control
Over three hundred million (2*157,554,381) pass-filter reads were generated. Quality control analysis of the sequencing reads was conducted using the in-house Illumina QC 08.08.2012 workflow, which is based on FastQC (www.bioinformatics. babraham.ac.uk/projects/fastqc) and Picard (picard.sourceforge. net) software tools. The description of the workflow is available at http://ccrifx.cancer.gov/apps/site/workflows_for_ bioinformatics_analysis. Over 84% of all pass-filter reads had a Basecall quality score above 30, while library complexity was over 81% for Pmel-1 libraries. Mapping to reference mouse genome (mm9) has shown that more than 75% read aligned uniquely with low mismatch error rate (1–1.2%).
Illumina read mapping and analysis
Reference-guided assembly was performed using Bowtie [67,68]. To detect discordant read pairs, all reads that passed the standard Illumina chastity filter were aligned to the mouse nuclear and mitochondrial genomes (mm9, http://genome.ucsc. edu) using Bowtie version 2.0.0-beta7 and allowing for two mismatches per read (bowtie2-2.0.0-beta7/bowtie2 —un un.txt — al al.txt —un-conc unconc.txt —al-conc alconc.txt —met-file mets.txt -x genome -1 read_unconc.1.fastq -2 read_unconc.2.fastq -S map.sam). The ‘‘—un-conc " option was used to capture read pairs that could not be aligned to the reference genome concordantly. These discordantly mapped read pairs (unconc.txt) were passed on to SVDetect and DELLY for structural variant detection.
In parallel, we also used Bowtie to detect soft-clipped reads associated with the insertion site. This time Bowtie was used in a "local" alignment mode (–local), which doesn’t require that reads align end-to-end (bowtie2-2.0.0-beta7/bowtie2 —un un.txt —al al.txt —un-conc unconc.txt —al-conc alconc.txt —met-file mets.txt -x genome -1 read_R1.fastq -2 read_R2_all.fastq -S map.sam). This way the reads were "soft-clipped" at one or both ends to optimize alignment score and allow for local alignment. This approach identified several subsets of ‘‘split reads’’, which had either both ends mapped to different genomic locations or only a portion of the read mapped to the genome reference.
Structural variation detection using DELLY
tab-separated text. DELLY-DUPs runs yielded hundreds of candidate duplication sites, which were captured in a VCF (Variant Call Format) file. This candidate SVs were filtered by supporting evidence filters (read quality and genotype) and then ranked by normalized high-quality read count ("RC") for each predicted duplication variant. After excluding the first two candidates associated with mitochondrial chromosomes and repeats, the top candidate duplication was placed near a TCR region on chromosome 14. Because the reads were mapped to the reference genome, these "duplications" appear to be located on chromo-somes 6 and 14, in the vicinity of TCR regions. DELLY-JUMPY generated hundreds of candidate translocations that were filtered by average mapping quality and then ranked by the number of supporting split-reads and by the location identified by DELLY-DUPS.
SVDetect analysis of chromosome-spanning read pairs Quality-filtered discordant (spanning) read pairs were analyzed using SVDetect to identify regions associated with structural rearrangements (SRs). The software was run at default setting. Top-scoring SVDetect-filtered read pairs were reviewed and filtered manually to remove: SRs with too few or many supporting reads (fewer than 5 or larger than 16); SRs mapping to centromeres or the mitochondrial chromosome; SRs with multiple adjacent rearrangements. The insertion site boundaries were supported by eight read pairs spanning chromosomes 2 and 6 and five pairs spanning chromosomes 2 and 14. The exact insertion site was confirmed by the presence of split reads that were soft-clipped at one or both ends to optimize alignment score and allow for local alignment.
Genotyping PCR
Genomic DNA was extracted with QuickExtract DNA extrac-tion soluextrac-tion 1.0 (EPICENTRE). PCR was performed under standard conditions. Primers used were Ch2Pmel-F1: cttta-gacctccggcactgttgc; Ch2Pmel-R1: gcaagtagcagtgtatcaaatatgc; PmelTCR-R1: gtagctttgtaaggctgtggagag. Ch2Pmel-F1 and Ch2Pmel-R1 amplify a transgenic band of 308 bp. Ch2Pmel-F1 and PmelTCR-R1 amplify an endogenous band of 203 bp.
Results
Tetramer analysis distinguishes the zygosity status of pmel-1 mice
Currently the identification of the zygosity status of pmel-1 transgene is based on deducing the breeder genotype by Mendelian inheritance rules. Interestingly, we discovered that gp100 Db tetramer staining enable to distinguish pmel-1 homozygous from heterozygous CD8+ T cells. There were no
notable differences of intensity or frequency between homozygous and heterozygous cells stained with the antibody specific for the Vb13 chain of pmel-1 TCR (Figure 1, upper panel). However, both frequency and intensity of tetramer+T cells were reduced in
heterozygous compared to homozygous pmel-1 T cells (Figure 1, lower panel). Although this observation allow us to distinguish pmel-1 homozygosity or heterozygosity, the requirements of FACS analysis of naı¨ve CD8+ T cells, the cost of tetramers, and the
inability to perform this type of assay reliably on neonatal mice limit the application of this method.
Determination of the pmel-1 integration site by low-coverage whole genome sequencing
We performed shallow NGS of the pmel-1 homozygous mouse, which produced 8X coverage of the genome, to identify the transgenic insertion sites. Since the pmel-1 transgene contained multiple tandem copies of mouse endogenous TCR domains [7], we used this information to streamline our analysis strategy. Notably, knowing the exact integrative cassette sequence was not a prerequisite for the identification of the integration site. Although this partial knowledge of the transgene origin has facilitated the validation of the integration site.
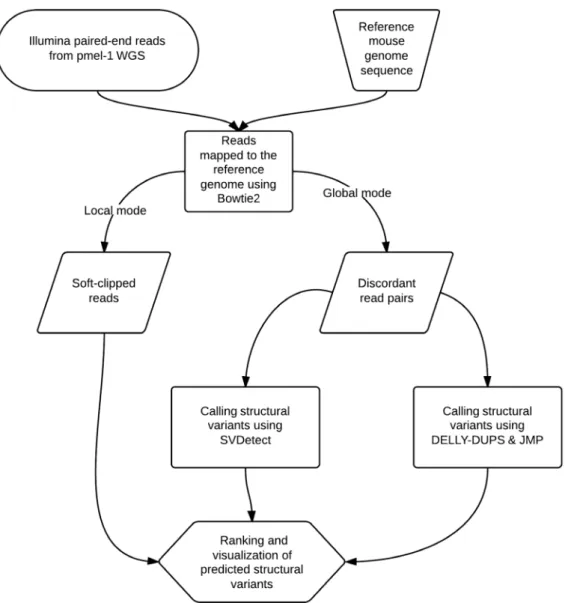
To identify candidate integration site, we searched for evidence of structural variations such as tandem duplications and translo-cations based on discordant NGS reads pairs. To that end, we first aligned paired-end Illumina reads from whole-genome sequencing to the reference mouse genome using Bowtie in global (reads align end to end) and local modes (reads are soft-clipped) (Figure 2). From the global alignment, only uniquely and discordantly mapped read pairs (4,092,067 reads or 2.6%) were retained for the subsequent analyses. These read pairs were analyzed further using the SVDetect [69] and DELLY (PMID: 22962449) software to identify potential structural variants (SVs). These SV candidates were filtered to remove predictions associated with repeats, mitochondria, centromeres, and intra-chromosomal rearrange-ments and then ranked based on confidence scores. After filtering, the top candidate duplication was placed near a TCR region on chromosome 14, while a duplication associated with a TCR region on chromosome 6 was ranked 23rd.
These duplications appear to be located on chromosomes 6 and 14 because sequence reads were mapped to the reference genome, which does not have tandem copies of TCR domains. These findings confirmed our expectations and provided us with way to identify junction read pairs bridging these regions and the area surrounding the yet unknown insertion site. Since we anticipated that in pmel-1 both regions immediately adjacent to the insertion site might have been derived from endogenous TCR regions on Figure 1. Pmel-1 TCR tetramer staining distinguishes the gene dosage of pmel-1 transgene in CD8+T cells.Staining of pmel-1 heterozygous or homozygous CD8+T cells with antibodies recognizing pmel-1 TCRbchain Vb13 (upper panel) or tetramers recognizing pmel-1 TCR (lower panel).
chromosomes 6 and 14, our next goal was to find these discordant read pairs that aligned partially to these TCR loci.
These filters narrowed thousands of SVDetect and DELLY-JUMPY predictions down to several candidate structural variants supported by discordant junction read pairs. Subsequently we used these junction read pairs as well as soft-clipped reads generated by local alignment to identify the exact genomic coordinates of the integration site. This step was done by manually inspecting local alignment files using the Integrative Genomics Viewer (IGV) [70,71]. Our results showed that the top candidate insertion site was supported by 13 discordant read pairs and 5 soft-clipped reads (Figure 3). In Figure 3A, these reads flank the area in the reference genome that corresponds to the insertion site in the pmel-1 genome. Figure 3B shows five junction reads that aligned partially to chromosome 2 and partially to a or b chain regions on chromosomes 14 and 6, which harbor the respective endogenous TCR loci in the reference genome. The insertion site is located in the 39UTR region of the gene Stk39, which encodes a serine/
threonine kinase that may function in the cellular stress response pathway [72].
The pmel-1 insertion is accompanied by a 157-bp deletion (chr2: 68,208,872–68,209,029 bp). Such deletions are common in transgenic mice [73,74]. The left side insertion boundary (chr2: 68,208,872 bp) was supported by 8 discordant read pairs and 4 soft-clipped reads mapped partially to thebsequence and partially to chromosome 2 (Figure 3B, 3C). In contrast, the right-side boundary was supported by 5 discordant read pairs and 1 soft-clipped read aligned with the a sequence and chromosome 2, consistent with insertion at 68,209,029 bp (Figure 3B). The insertion area is bounded by a 5-bp duplicated sequence (TGGAT) on the right and by a 7-bp duplicated sequence (CCAGCAG) on the left, which are identical between the regions on chromosome 2 and the a and b TCR sequences. Such homologous regions are thought to facilitate chromosomal rearrangements that accompany a transgene insertion.
Figure 2. NGS data analysis workflow.This chart depicts the analysis of NGS data from Whole Genome Sequencing. In this analysis, standard tools for small structural variation detection were used to predict large insertions based on short paired-end (2*100 bp) sequence reads. Both SVDetect and DELLY extract data from a reference sequence file and a sequence alignment (BAM) file and generate filtered lists of predicted structural variations, their genomic coordinates, and confidence scores as a tab-separated text. Downstream steps, such as data visualization, cross-sectioning and ranking of SVs were done in the Integrative Genomics Viewer and Excel.
Confirmation of the integration sites by PCR analysis The identification of the potential integration site of TCRb
chain at 68,208,872 bp on chromosome 2 allows us to design three primers for PCR genotyping analysis, which are located at the 59
and 39of the integration site, and also at the 39of the integrated pmel-1 TCRb chain transgenic vector junction site, respectively (Figure 4A). According to the design, we would observe a single 308 bp band from the PCR products of homozygous pmel-1 transgenic animals and a single 203 bp band from wild type animals while both the 203 bp and the 308 bp bands would appear from heterozygous animals. Consistent to our expectations, we observed distinctive PCR bands with the exact predicted size
(Figure 4B). Furthermore, the transgene dosage determined by the PCR analysis was consistent to the conclusions drawn from the tetramer staining analysis (Figure 1), further corroborating that the integration site resolved by whole-genome sequencing data analysis was correct.
Discussion
transgene dosage. The conclusions made from PCR genotyping assay are consistent with the results obtained by FACS analysis of pmel-1 T cells and prediction based on Mendelian inheritance rules, confirming the validity of the integration sites identified by NGS analysis.
The alignment results are consistent with a pattern of tandem integration of the vectors for both pmel-1 TCR a chain andb
chain. To estimate how many copies ofaandb sequences were inserted into each transgenic animal genome, we calculated the mean coverage for the entire genome as well asaandbregions on chromosomes 14 and 6, respectively. The genome coverage was estimated as 8X, while the insert copy numbers are 16X and 4X for a and b cassettes, respectively. Except for a few gaps, most vector sequences appear to be integrated into the pmel-1 genome. Therefore, we proposed a model for the potential layout of the transgene in the genome (Figure 4C).
The identification of pmel-1 genomic integration site will not only greatly facilitate the genotyping for researchers employing the pmel-1 model system, but also allow a more efficient and effective
breeding scheme design. Many researchers breed pmel-1 trans-genic mouse with other transtrans-genic strains to evaluate the function of other transgenes that are involved or potentially involved in T cell development or function. However, previously all the breeding schemes were designed blindly and the certainty of obtaining desired progeny is susceptible to risk. The identification of the insertion site can also prevent futile attempts to breed pmel-1 with transgenes knockout animals where the relevant gene of interest is actually located very close to the pmel-1 transgene on chromo-some 2. Thus, identification of the integration site can prevent unnecessary losses of time and resources.
In our system we have demonstrated the possibility of identification of transgene integration site with little information of the original design of transgenic animals. In principle, with the advances in whole genome sequencing technology, this method can be applied to characterize all other transgenic animals [66]. Furthermore, NGS data of the genomic DNA can be further used for genome comparison, another alternative choice for animal genetic background test besides microsatellite test. In this study, we Figure 4. PCR analysis distinguishes the homozygosity or heterozygosity of pmel-1 transgene.(A) Diagram of PCR primers designed from the predicted pmel-1 TCRbtransgene insertion site on chromosome 2. (B) PCR results of pmel-1 homozygous or heterozygous animals. (C) Conceptual model of tandem integration of the pmel-1aandbchains in the genome.
focused on the identification of the pmel-1 integration site, but NGS can also indicate details about the genetic background of the mice, such as their similarity to other mice on the ‘C57BL/6’ background. This information can be useful to understand mechanisms underlying immune rejection as well as host and donor compatibility. The sequences for pmel-1 genomic DNA have been deposited to NCBI Short Read Archives (SRA) and free for the public access, which will provide significant value to the transgenic mice genome studies.
Data Visualization
The Integrative Genomics Viewer (IGV) [70,71] and SAMtools were used for data visualization [75].
Data Access
Read sequence data has been submitted to the NCBI Short Read Archive (SRA) under accession number SRP037973 and BioProject accession No. PRJNA238124.
Supporting Information
Figure S1 Diagrams of original constructs for generat-ing pmel-1 transgenic animals.(A) Pmel-1 TCRatransgenic vector. The variable region of TCRawere cloned between Xmal and Not I sites. (B) Pmel-1 TCRbtransgenic vector. The variable region of TCRbwere cloned between Xho I and Sac II sites. (TIF)
Acknowledgments
This study utilized the high-performance computational capabilities of the Biowulf Linux cluster at the National Institutes of Health, Bethesda, MD (http://biowulf.nih.gov). For statistical analysis and bioinformatics support, we thank the CCRIFX Bioinformatics Core operated by Leidos Biomedical Research and supported by the Intramural Research Program of the Center for Cancer Research, National Cancer Institute, NIH (YT-10-060).
Author Contributions
Conceived and designed the experiments: YJ LG NPR. Performed the experiments: YJ ZF DCP ZY. Analyzed the data: YJ NA WZ E. Salinas PJ RR E. Stahlberg. Wrote the paper: YJ NA LG NPR.
References
1. Schneider MR, Wolf E (2005) Genotyping of transgenic mice: old principles and recent developments. Anal Biochem 344: 1–7.
2. Abrahams BS, Chong AC, Nisha M, Milette D, Brewster DA, et al. (2003) Metaphase FISHing of transgenic mice recommended: FISH and SKY define BAC-mediated balanced translocation. Genesis 36: 134–141.
3. Cooley L, Kelley R, Spradling A (1988) Insertional mutagenesis of the Drosophila genome with single P elements. Science 239: 1121–1128. 4. Devon RS, Porteous DJ, Brookes AJ (1995) Splinkerettes—improved vectorettes
for greater efficiency in PCR walking. Nucleic Acids Res 23: 1644–1645. 5. Uren AG, Mikkers H, Kool J, van der Weyden L, Lund AH, et al. (2009) A
high-throughput splinkerette-PCR method for the isolation and sequencing of retroviral insertion sites. Nat Protoc 4: 789–798.
6. Ohigashi I, Yamasaki Y, Hirashima T, Takahama Y (2010) Identification of the transgenic integration site in immunodeficient tgepsilon26 human CD3epsilon transgenic mice. PLoS One 5: e14391.
7. Overwijk WW, Theoret MR, Finkelstein SE, Surman DR, de Jong LA, et al. (2003) Tumor regression and autoimmunity after reversal of a functionally tolerant state of self-reactive CD8+T cells. J Exp Med 198: 569–580. 8. Overwijk WW, Tsung A, Irvine KR, Parkhurst MR, Goletz TJ, et al. (1998)
gp100/pmel 17 is a murine tumor rejection antigen: induction of "self"-reactive, tumoricidal T cells using high-affinity, altered peptide ligand. J Exp Med 188: 277–286.
9. Gattinoni L, Finkelstein SE, Klebanoff CA, Antony PA, Palmer DC, et al. (2005) Removal of homeostatic cytokine sinks by lymphodepletion enhances the efficacy of adoptively transferred tumor-specific CD8+T cells. J Exp Med 202: 907–912.
10. Wrzesinski C, Paulos CM, Gattinoni L, Palmer DC, Kaiser A, et al. (2007) Hematopoietic stem cells promote the expansion and function of adoptively transferred antitumor CD8 T cells. J Clin Invest 117: 492–501.
11. Wrzesinski C, Paulos CM, Kaiser A, Muranski P, Palmer DC, et al. (2010) Increased intensity lymphodepletion enhances tumor treatment efficacy of adoptively transferred tumor-specific T cells. J Immunother 33: 1–7. 12. Salem ML, Diaz-Montero CM, Al-Khami AA, El-Naggar SA, Naga O, et al.
(2009) Recovery from cyclophosphamide-induced lymphopenia results in expansion of immature dendritic cells which can mediate enhanced prime-boost vaccination antitumor responses in vivo when stimulated with the TLR3 agonist poly(I:C). J Immunol 182: 2030–2040.
13. Wang LX, Li R, Yang G, Lim M, O’Hara A, et al. (2005) Interleukin-7-dependent expansion and persistence of melanoma-specific T cells in lymphodepleted mice lead to tumor regression and editing. Cancer Res 65: 10569–10577.
14. Klebanoff CA, Finkelstein SE, Surman DR, Lichtman MK, Gattinoni L, et al. (2004) IL-15 enhances the in vivo antitumor activity of tumor-reactive CD8+T cells. Proc Natl Acad Sci U S A 101: 1969–1974.
15. Klebanoff CA, Gattinoni L, Palmer DC, Muranski P, Ji Y, et al. (2011) Determinants of successful CD8+T-cell adoptive immunotherapy for large established tumors in mice. Clin Cancer Res 17: 5343–5352.
16. Zeng R, Spolski R, Finkelstein SE, Oh S, Kovanen PE, et al. (2005) Synergy of IL-21 and IL-15 in regulating CD8+T cell expansion and function. J Exp Med 201: 139–148.
17. Brentjens RJ, Davila ML, Riviere I, Park J, Wang X, et al. (2013) CD19-targeted T cells rapidly induce molecular remissions in adults with chemotherapy-refractory acute lymphoblastic leukemia. Sci Transl Med 5: 177ra138. 18. He H, Wisner P, Yang G, Hu HM, Haley D, et al. (2006) Combined IL-21 and
low-dose IL-2 therapy induces anti-tumor immunity and long-term curative effects in a murine melanoma tumor model. J Transl Med 4: 24.
19. Palmer DC, Balasubramaniam S, Hanada K, Wrzesinski C, Yu Z, et al. (2004) Vaccine-stimulated, adoptively transferred CD8+T cells traffic indiscriminately and ubiquitously while mediating specific tumor destruction. J Immunol 173: 7209–7216.
20. Lou Y, Wang G, Lizee G, Kim GJ, Finkelstein SE, et al. (2004) Dendritic cells strongly boost the antitumor activity of adoptively transferred T cells in vivo. Cancer Res 64: 6783–6790.
21. Grupp SA, Kalos M, Barrett D, Aplenc R, Porter DL, et al. (2013) Chimeric antigen receptor-modified T cells for acute lymphoid leukemia. N Engl J Med 368: 1509–1518.
22. Porter DL, Levine BL, Kalos M, Bagg A, June CH (2011) Chimeric antigen receptor-modified T cells in chronic lymphoid leukemia. N Engl J Med 365: 725–733.
23. Rosenberg SA, Yang JC, Sherry RM, Kammula US, Hughes MS, et al. (2011) Durable complete responses in heavily pretreated patients with metastatic melanoma using T-cell transfer immunotherapy. Clin Cancer Res 17: 4550– 4557.
24. Robbins PF, Morgan RA, Feldman SA, Yang JC, Sherry RM, et al. (2011) Tumor regression in patients with metastatic synovial cell sarcoma and melanoma using genetically engineered lymphocytes reactive with NY-ESO-1. J Clin Oncol 29: 917–924.
25. Kochenderfer JN, Dudley ME, Carpenter RO, Kassim SH, Rose JJ, et al. (2013) Donor-derived CD19-targeted T cells cause regression of malignancy persisting after allogeneic hematopoietic stem cell transplantation. Blood 122: 4129–4139. 26. Chapuis AG, Ragnarsson GB, Nguyen HN, Chaney CN, Pufnock JS, et al. (2013) Transferred WT1-reactive CD8+ T cells can mediate antileukemic activity and persist in post-transplant patients. Sci Transl Med 5: 174ra127. 27. Radvanyi LG, Bernatchez C, Zhang M, Fox PS, Miller P, et al. (2012) Specific
lymphocyte subsets predict response to adoptive cell therapy using expanded autologous tumor-infiltrating lymphocytes in metastatic melanoma patients. Clin Cancer Res 18: 6758-6770.
28. Gattinoni L, Klebanoff CA, Palmer DC, Wrzesinski C, Kerstann K, et al. (2005) Acquisition of full effector function in vitro paradoxically impairs the in vivo antitumor efficacy of adoptively transferred CD8+T cells. J Clin Invest 115: 1616–1626.
29. Gattinoni L, Klebanoff CA, Restifo NP (2012) Paths to stemness: building the ultimate antitumour T cell. Nat Rev Cancer 12: 671–684.
30. Gattinoni L, Zhong XS, Palmer DC, Ji Y, Hinrichs CS, et al. (2009) Wnt signaling arrests effector T cell differentiation and generates CD8+memory stem cells. Nat Med 15: 808–813.
32. Hinrichs CS, Spolski R, Paulos CM, Gattinoni L, Kerstann KW, et al. (2008) IL-2 and IL-IL-21 confer opposing differentiation programs to CD8+T cells for adoptive immunotherapy. Blood 111: 5326–5333.
33. Ji Y, Pos Z, Rao M, Klebanoff CA, Yu Z, et al. (2011) Repression of the DNA-binding inhibitor Id3 by Blimp-1 limits the formation of memory CD8+T cells. Nat Immunol 12: 1230–1237.
34. Klebanoff CA, Gattinoni L, Torabi-Parizi P, Kerstann K, Cardones AR, et al. (2005) Central memory self/tumor-reactive CD8+ T cells confer superior antitumor immunity compared with effector memory T cells. Proc Natl Acad Sci U S A 102: 9571–9576.
35. Sukumar M, Liu J, Ji Y, Subramanian M, Crompton JG, et al. (2013) Inhibiting glycolytic metabolism enhances CD8+T cell memory and antitumor function. J Clin Invest 123: 4479–4488.
36. Hinrichs CS, Kaiser A, Paulos CM, Cassard L, Sanchez-Perez L, et al. (2009) Type 17 CD8+T cells display enhanced antitumor immunity. Blood 114: 596– 599.
37. Boni A, Muranski P, Cassard L, Wrzesinski C, Paulos CM, et al. (2008) Adoptive transfer of allogeneic tumor-specific T cells mediates effective regression of large tumors across major histocompatibility barriers. Blood 112: 4746–4754. 38. Paulos CM, Wrzesinski C, Kaiser A, Hinrichs CS, Chieppa M, et al. (2007)
Microbial translocation augments the function of adoptively transferred self/ tumor-specific CD8+T cells via TLR4 signaling. J Clin Invest 117: 2197–2204. 39. Kerkar SP, Goldszmid RS, Muranski P, Chinnasamy D, Yu Z, et al. (2011) IL-12 triggers a programmatic change in dysfunctional myeloid-derived cells within mouse tumors. J Clin Invest 121: 4746–4757.
40. Kerkar SP, Muranski P, Kaiser A, Boni A, Sanchez-Perez L, et al. (2010) Tumor-specific CD8+T cells expressing interleukin-12 eradicate established cancers in lymphodepleted hosts. Cancer Res 70: 6725–6734.
41. Lu Y, Hong B, Li H, Zheng Y, Zhang M, et al. (2014) Tumor-specific IL-9-producing CD8+Tc9 cells are superior effector than type-I cytotoxic Tc1 cells for adoptive immunotherapy of cancers. Proc Natl Acad Sci U S A. 42. Church SE, Jensen SM, Antony PA, Restifo NP, Fox BA (2014) Tumor-specific
CD4(+) T cells maintain effector and memory tumor-specific CD8(+) T cells. Eur J Immunol 44: 69–79.
43. Liu C, Peng W, Xu C, Lou Y, Zhang M, et al. (2013) BRAF inhibition increases tumor infiltration by T cells and enhances the antitumor activity of adoptive immunotherapy in mice. Clin Cancer Res 19: 393–403.
44. Kaluza KM, Kottke T, Diaz RM, Rommelfanger D, Thompson J, et al. (2012) Adoptive transfer of cytotoxic T lymphocytes targeting two different antigens limits antigen loss and tumor escape. Hum Gene Ther 23: 1054–1064. 45. Quatromoni JG, Wang Y, Vo DD, Morris LF, Jazirehi AR, et al. (2012) T cell
receptor (TCR)-transgenic CD8 lymphocytes rendered insensitive to transform-ing growth factor beta (TGFbeta) signaltransform-ing mediate superior tumor regression in an animal model of adoptive cell therapy. J Transl Med 10: 127.
46. Koya RC, Mok S, Otte N, Blacketor KJ, Comin-Anduix B, et al. (2012) BRAF inhibitor vemurafenib improves the antitumor activity of adoptive cell immunotherapy. Cancer Res 72: 3928–3937.
47. Amos SM, Pegram HJ, Westwood JA, John LB, Devaud C, et al. (2011) Adoptive immunotherapy combined with intratumoral TLR agonist delivery eradicates established melanoma in mice. Cancer Immunol Immunother 60: 671–683.
48. Johnson LD, Jameson SC (2010) Self-specific CD8+T cells maintain a semi-naive state following lymphopenia-induced proliferation. J Immunol 184: 5604– 5611.
49. Vo DD, Prins RM, Begley JL, Donahue TR, Morris LF, et al. (2009) Enhanced antitumor activity induced by adoptive T-cell transfer and adjunctive use of the histone deacetylase inhibitor LAQ824. Cancer Res 69: 8693–8699. 50. Cui Y, Zhang H, Meadors J, Poon R, Guimond M, et al. (2009) Harnessing the
physiology of lymphopenia to support adoptive immunotherapy in lymphor-eplete hosts. Blood 114: 3831–3840.
51. Diaz-Montero CM, El Naggar S, Al Khami A, El Naggar R, Montero AJ, et al. (2008) Priming of naive CD8+T cells in the presence of IL-12 selectively enhances the survival of CD8+CD62Lhi cells and results in superior anti-tumor activity in a tolerogenic murine model. Cancer Immunol Immunother 57: 563– 572.
52. Rubinstein MP, Cloud CA, Garrett TE, Moore CJ, Schwartz KM, et al. (2012) Ex vivo interleukin-12-priming during CD8(+) T cell activation dramatically improves adoptive T cell transfer antitumor efficacy in a lymphodepleted host. J Am Coll Surg 214: 700–707; discussion 707–708.
53. Rizzuto GA, Merghoub T, Hirschhorn-Cymerman D, Liu C, Lesokhin AM, et al. (2009) Self-antigen-specific CD8+T cell precursor frequency determines the quality of the antitumor immune response. J Exp Med 206: 849–866. 54. Prins RM, Shu CJ, Radu CG, Vo DD, Khan-Farooqi H, et al. (2008)
Anti-tumor activity and trafficking of self, Anti-tumor-specific T cells against Anti-tumors located in the brain. Cancer Immunol Immunother 57: 1279–1289. 55. Stephan MT, Moon JJ, Um SH, Bershteyn A, Irvine DJ (2010) Therapeutic cell
engineering with surface-conjugated synthetic nanoparticles. Nat Med 16: 1035– 1041.
56. Klebanoff CA, Yu Z, Hwang LN, Palmer DC, Gattinoni L, et al. (2009) Programming tumor-reactive effector memory CD8+T cells in vitro obviates the requirement for in vivo vaccination. Blood 114: 1776–1783.
57. Zhou P, Shaffer DR, Alvarez Arias DA, Nakazaki Y, Pos W, et al. (2014) In vivo discovery of immunotherapy targets in the tumour microenvironment. Nature. 58. Murakami T, Cardones AR, Finkelstein SE, Restifo NP, Klaunberg BA, et al. (2003) Immune evasion by murine melanoma mediated through CC chemokine receptor-10. J Exp Med 198: 1337–1347.
59. Lee CH, Kakinuma T, Wang J, Zhang H, Palmer DC, et al. (2006) Sensitization of B16 tumor cells with a CXCR4 antagonist increases the efficacy of immunotherapy for established lung metastases. Mol Cancer Ther 5: 2592– 2599.
60. Gattinoni L, Ranganathan A, Surman DR, Palmer DC, Antony PA, et al. (2006) CTLA-4 dysregulation of self/tumor-reactive CD8+T-cell function is CD4+ T-cell dependent. Blood 108: 3818–3823.
61. Antony PA, Piccirillo CA, Akpinarli A, Finkelstein SE, Speiss PJ, et al. (2005) CD8+T cell immunity against a tumor/self-antigen is augmented by CD4+T helper cells and hindered by naturally occurring T regulatory cells. J Immunol 174: 2591–2601.
62. Byrne KT, Zhang P, Steinberg SM, Turk MJ (2014) Autoimmune Vitiligo Does Not Require the Ongoing Priming of Naive CD8 T Cells for Disease Progression or Associated Protection against Melanoma. J Immunol.
63. Rodriguez GM, D’Urbano D, Bobbala D, Chen XL, Yeganeh M, et al. (2013) SOCS1 prevents potentially skin-reactive cytotoxic T lymphocytes from gaining the ability to cause inflammatory lesions. J Invest Dermatol 133: 2013–2022. 64. Rashighi M, Agarwal P, Richmond JM, Harris TH, Dresser K, et al. (2014)
CXCL10 Is Critical for the Progression and Maintenance of Depigmentation in a Mouse Model of Vitiligo. Sci Transl Med 6: 223ra223.
65. Palmer DC, Chan CC, Gattinoni L, Wrzesinski C, Paulos CM, et al. (2008) Effective tumor treatment targeting a melanoma/melanocyte-associated antigen triggers severe ocular autoimmunity. Proc Natl Acad Sci U S A 105: 8061–8066. 66. Dubose AJ, Lichtenstein ST, Narisu N, Bonnycastle LL, Swift AJ, et al. (2013) Use of microarray hybrid capture and next-generation sequencing to identify the anatomy of a transgene. Nucleic Acids Res 41: e70.
67. Langmead B, Trapnell C, Pop M, Salzberg SL (2009) Ultrafast and memory-efficient alignment of short DNA sequences to the human genome. Genome Biol 10: R25.
68. Langmead B, Salzberg SL (2012) Fast gapped-read alignment with Bowtie 2. Nat Methods 9: 357–359.
69. Zeitouni B, Boeva V, Janoueix-Lerosey I, Loeillet S, Legoix-ne P, et al. (2010) SVDetect: a tool to identify genomic structural variations from paired-end and mate-pair sequencing data. Bioinformatics 26: 1895–1896.
70. Robinson JT, Thorvaldsdottir H, Winckler W, Guttman M, Lander ES, et al. (2011) Integrative genomics viewer. Nat Biotechnol 29: 24–26.
71. Thorvaldsdottir H, Robinson JT, Mesirov JP (2013) Integrative Genomics Viewer (IGV): high-performance genomics data visualization and exploration. Brief Bioinform 14: 178–192.
72. Balatoni CE, Dawson DW, Suh J, Sherman MH, Sanders G, et al. (2009) Epigenetic silencing of Stk39 in B-cell lymphoma inhibits apoptosis from genotoxic stress. Am J Pathol 175: 1653–1661.
73. Chandler KJ, Chandler RL, Broeckelmann EM, Hou Y, Southard-Smith EM, et al. (2007) Relevance of BAC transgene copy number in mice: transgene copy number variation across multiple transgenic lines and correlations with transgene integrity and expression. Mamm Genome 18: 693–708.
74. Le Saux A, Houdebine LM, Jolivet G (2010) Chromosome integration of BAC (bacterial artificial chromosome): evidence of multiple rearrangements. Trans-genic Res 19: 923–931.