Clinical Impact of Speed Variability to
Identify Ultramarathon Runners at Risk for
Acute Kidney Injury
Sen-Kuang Hou1,2,3, Yu-Hui Chiu2,4, Yi-Fang Tsai5,6, Ling-Chen Tai5, Peter C. Hou3,7, Chorng-Kuang How6,8, Chen-Chang Yang2, Wei-Fong Kao1,2*
1Department of Emergency Medicine, Taipei Medical University Hospital, Taipei, Taiwan,2Institute of Environmental and Occupational Health Sciences, National Yang-Ming University, Taipei, Taiwan,
3Department of Emergency Medicine, Brigham and Women’s Hospital, Boston, Massachusetts, United States of America,4Department of Emergency Medicine, Mackay Memorial Hospital, Taipei, Taiwan,
5Department of General Surgery, Taipei Veterans General Hospital, Taipei, Taiwan,6Institute of Clinical Medicine, National Yang-Ming University, Taipei, Taiwan,7Harvard Medical School, Boston,
Massachusetts, United States of America,8Department of Emergency Medicine, Taipei Veterans General Hospital, Taipei, Taiwan
Abstract
Background
Ultramarathon is a high endurance exercise associated with a wide range of exercise-related problems, such as acute kidney injury (AKI). Early recognition of individuals at risk of AKI during ultramarathon event is critical for implementing preventative strategies.
Objectives
To investigate the impact of speed variability to identify the exercise-related acute kidney injury anticipatively in ultramarathon event.
Methods
This is a prospective, observational study using data from a 100 km ultramarathon in Taipei, Taiwan. The distance of entire ultramarathon race was divided into 10 splits. The mean and variability of speed, which was determined by the coefficient of variation (CV) in each 10 km-split (25 laps of 400 m oval track) were calculated for enrolled runners. Baseline charac-teristics and biochemical data were collected completely 1 week before, immediately post-race, and one day after race. The main outcome was the development of AKI, defined as Stage II or III according to the Acute Kidney Injury Network (AKIN) criteria. Multivariate anal-ysis was performed to determine the independent association between variables and AKI development.
Results
26 ultramarathon runners were analyzed in the study. The overall incidence of AKI (in all Stages) was 84.6% (22 in 26 runners). Among these 22 runners, 18 runners were
a11111
OPEN ACCESS
Citation:Hou S-K, Chiu Y-H, Tsai Y-F, Tai L-C, Hou PC, How C-K, et al. (2015) Clinical Impact of Speed Variability to Identify Ultramarathon Runners at Risk for Acute Kidney Injury. PLoS ONE 10(7): e0133146. doi:10.1371/journal.pone.0133146
Editor:Dirce Maria Trevisan Zanetta, School of Public Health of University of São Paulo, BRAZIL
Received:April 1, 2015
Accepted:June 23, 2015
Published:July 15, 2015
Copyright:© 2015 Hou et al. This is an open access article distributed under the terms of theCreative Commons Attribution License, which permits unrestricted use, distribution, and reproduction in any medium, provided the original author and source are credited.
Data Availability Statement:All relevant data are within the paper.
Funding:This study was supported by a grant from Taipei Veterans General Hospital, Taiwan (Grant V100C-202). The funders had no role in study design, data collection and analysis, decision to publish, or preparation of the manuscript.
determined as Stage I, 4 runners (15.4%) were determined as Stage II, and none was in Stage III. The covariates of BMI (25.22±2.02 vs. 22.55±1.96,p= 0.02), uric acid (6.88±
1.47 vs. 5.62±0.86,p= 0.024), and CV of speed in specific 10-km splits (from secondary 10 km-split (10th
–20thkm-split) to 60th
–70thkm-split) were significantly different between
runners with or without AKI (Stage II) in univariate analysis and showed discrimination ability in ROC curve. In the following multivariate analysis, only CV of speed in 40th
–50th
km-split continued to show a significant association to the development of AKI (Stage II) (p= 0.032).
Conclusions
The development of exercise-related AKI was not infrequent in the ultramarathon runners. Because not all runners can routinely receive laboratory studies after race, variability of run-ning speed (CV of speed) may offer a timely and efficient tool to identify AKI early during the competition, and used as a surrogate screening tool, at-risk runners can be identified and enrolled into prevention trials, such as adequate fluid management and avoidance of further NSAID use.
Introduction
Ultramarathon, a foot race longer than the standard 42.2 kilometer (km) marathon distance, has become increasingly popular in recent decades throughout the world [1]. During this endurance event, athletes provoke many physiological responses and metabolic adaptations to finish the competition [2]. However, higher level of the physiological demands may induce a wide range of exercise-related injuries, such as electrolyte imbalance [3,4], exertional heat stroke [5,6], rhabdomyolysis, acute kidney injury [7–9], and even cardiac arrest [10,11]. With the growing numbers of participants, early recognition of runners at risk for the development of exercise-related injuries is paramount.
In the literature, several studies reported that 40–80% of athletes developed acute kidney injury (AKI) after strenuous exercise [12–14]. The pathophysiology of exercise-related AKI is multi-factorial [15] and may be the combined effect of dehydration, hot environment [16,17], nonsteroid anti-inflammatory drugs use [18,19], hyperuricemia [9,15], and rhabdomyolysis [7–9]. During ultramarathon, early recognition and management of runners at risk of impend-ing kidney injury/failure are critical to prevent serious complications. Although the diagnosis of AKI can be made by checking the serum creatinine level before and after the race, it may not be feasible to identify individuals at risk of the development of AKI early during the ultramara-thon event.
Materials and Methods
Study design and population
Experienced ultramarathon runners participating in the 2011 Flexpower Cup National 100 km Ultra-Marathon in Soochow University, Taipei, Taiwan, were enrolled in this study. Registered participants were contacted by phone to explain the study protocol, its objectives, and to deter-mine each participant’s willingness to volunteer for the study. Runners were excluded if they had past histories of heart disease, renal dysfunction, seizure, or syncope of unknown origin. All runners ran over a flat course consisting of a 400 m oval track. During the race, runners wore a racing bib with a timing chip to record each lap time automatically at every 400 m inter-vals by RFID (Radio-frequency identification) timing system. They were permitted to rest, mic-turate, and consume water or food. All runners completed a pre-race questionnaire for
demographic data, medical information (such as NSAID used within one week), and training history before this competition.
Ethics Statement
Institutional Review Board approval (VGHIRB No: 2011-01-060IC) was obtained from the Ethics Committee of Taipei Veterans General Hospital. All subjects were contacted by phone using information provided by the Chinese Taipei Association of Ultra Runners and then pro-vided written consent to participate in the study.
Data collection
Lap times were obtained to measure the running speed (m/s) every 400 meters. After dividing the distance of entire ultramarathon race (100 km) into 10 splits, the mean and standard devia-tion (SD) of running speed in each 10 km-split (25 laps of 400 m oval track) were calculated for all runners. The variability of speed was determined by using the coefficient of variation (CV), which was defined as the ratio of the standard deviation to the mean of lap speeds [23,26,27].
Venous blood (20ml) was drawn antiseptically by a 20-gauge intravenous catheter 1 week before and immediately post-race to examine biochemical data, including blood urea nitrogen (BUN), creatinine (Cr), creatine kinase (CK), lactate dehydrogenase (LDH), myoglobin, uric acid (UA), electrolytes, D-dimer, Procalcitonin, and liver function tests. BUN and Cr were examined again one day after race to assess the recovery of renal function. All specimens were refrigerated and transported to the laboratory within 4 hours of sampling. Plasma samples were assayed on the Siemens Dimension RXL Max Integrated Chemistry System using reagents supplied by the manufacturer. Body weight (BW) change (the difference between before and 4 hours after the start) was also recorded to monitor the dehydrated status.
Definition of acute kidney injury
Acute kidney injury (AKI) was defined according to AKIN criteria published by Acute Kidney Injury Network [28]. AKI was classified as Stage I (a percentage increase in post-race serum Cr 1.5 to 2-fold from pre-race level, or an absolute increase in serum Cr0.3mg/dl), Stage II (a percentage increase in post-race serum Cr 2 to 3-fold from pre-race level), and Stage III (a per-centage increase in post-race serum Cr more than 3-fold from pre-race level, or serum
Statistical analysis
The baseline characteristics were presented as percentages for categorical variables and mean ± standard deviation (SD) for continuous variables. Paired T test was used to compare differences between pre-race and immediate post the ultramarathon event. Chi-squared test (or the Fisher exact test when appropriate) was applied for categorical data. Baseline character-istics and CV of speed in specific 10 km-splits with significant impact in the initial univariate analysis were retained into further multivariate analysis to examine the independent effects to identify the development of AKI (Stage II or III). To compare the predictive power, we created probability estimate through conducting the multiple logistic regression analysis. Then we apply the predicted probability as test variables of ROC curve to measure the discrimination ability of individualized CV value.
A two-sided p value of 0.05 or less was considered to be significant. All statistical analyses were performed using SPSS software (version 18.0; SPSS Inc., Chicago, IL)
Results
The ultramarathon began at 7 AM and ended at 9 PM on October 10, 2011. The temperature during this competition was between 24.9°C (7–8 AM) and 28.7°C (5–6 PM), the relative humidity was between 66% (10–11 AM) and 87% (8–9 AM), and the wind speed ranged from 0 m/s (7–8 AM) to 6.5 m/s (11 AM—1 PM).
Total 28 runners (27 male and 1 female) were enrolled in this study. Two subjects unable to complete the 100 km ultramarathon within the predetermined time limit of 14 hours were excluded for further analysis. The median age of all study subjects was 47 years (range from 22 to 60 years old), and ultramarathon experience of these runners was 5.5 ± 2.6 years in average. Before competition, these runners had different training protocol from less than 40 km to more than 100 km per week.
The overall incidence of AKI in all stages was 84.6% (22 in 26 runners); and among them, 4 runners (15.4%) were determined as Stage II of AKI and none in Stage III. Demographics and biochemical data were summarized throughout this highly endurance competition (Table 1). Similar to previous reports [2], there was a statistically significant difference in body weight (BW) and majority of biochemical data between pre-race and immediate post-race exam. Although 3 runners (11.5%) developed asymptomatic exercise-associated hyponatremia (Na135 mmol/L), no significant difference was found in serum Na (139.73 ± 1.08 vs. 139.92 ± 3.61,p= 0.79) between pre-race and immediately post-race.
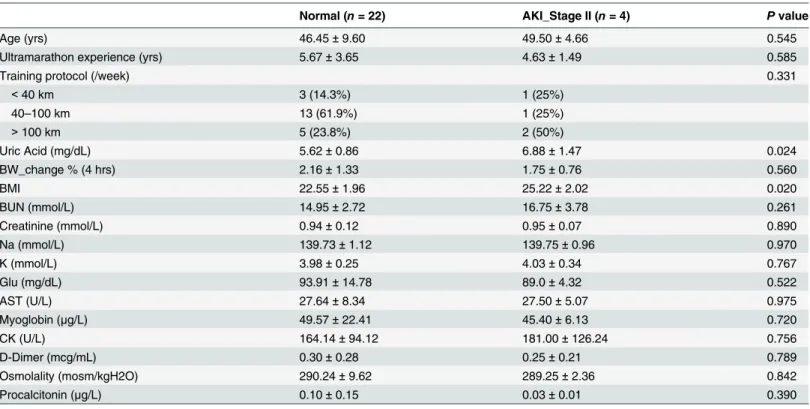
For the purpose to evaluate the association between pre-race biochemical data and the development of AKI, we compared these variables in runners who did or did not develop AKI (Stage II) inTable 2. Although these biochemical variables changed significantly after race, the majority of the pre-race data didn’t show significant association to AKI (Stage II) development except uric acid (6.88 ± 1.47 vs. 5.62 ± 0.86,p= 0.024). Baseline characteristics, including BW
change in first 4 hours, pre-race BMI, marathon experience, and weekly training distance were all examined at the same time, and only pre-race BMI was significantly higher in runners devel-oping AKI (Stage II) (25.22 ± 2.02 vs. 22.55 ± 1.96,p= 0.02). Other risk factors associated with
AKI development, such as NSAID used within one week, were also evaluated by pre-race ques-tionnaires and all runners denied any special medical conditions except one runner in each groups took NSAID.
Table 2. Baseline characteristics and pre-race biochemical data were analyzed by independent T-test for the comparison between runners with or without AKI (Stage II) development.
Normal (n= 22) AKI_Stage II (n= 4) Pvalue
Age (yrs) 46.45±9.60 49.50±4.66 0.545
Ultramarathon experience (yrs) 5.67±3.65 4.63±1.49 0.585
Training protocol (/week) 0.331
<40 km 3 (14.3%) 1 (25%)
40–100 km 13 (61.9%) 1 (25%)
>100 km 5 (23.8%) 2 (50%)
Uric Acid (mg/dL) 5.62±0.86 6.88±1.47 0.024
BW_change % (4 hrs) 2.16±1.33 1.75±0.76 0.560
BMI 22.55±1.96 25.22±2.02 0.020
BUN (mmol/L) 14.95±2.72 16.75±3.78 0.261
Creatinine (mmol/L) 0.94±0.12 0.95±0.07 0.890
Na (mmol/L) 139.73±1.12 139.75±0.96 0.970
K (mmol/L) 3.98±0.25 4.03±0.34 0.767
Glu (mg/dL) 93.91±14.78 89.0±4.32 0.522
AST (U/L) 27.64±8.34 27.50±5.07 0.975
Myoglobin (μg/L) 49.57±22.41 45.40±6.13 0.720
CK (U/L) 164.14±94.12 181.00±126.24 0.756
D-Dimer (mcg/mL) 0.30±0.28 0.25±0.21 0.789
Osmolality (mosm/kgH2O) 290.24±9.62 289.25±2.36 0.842
Procalcitonin (μg/L) 0.10±0.15 0.03±0.01 0.390
Continuous data presented as mean±SD.
Definition of abbreviations: BW = Body Weight; BMI = Body mass index.
doi:10.1371/journal.pone.0133146.t002
Table 1. Demographics and biochemical data at pre-race and immediate post-race of all 100 km ultramarathon runners (n= 26).
Pre-race Immediate Post-race Pvalue
Age (yrs) 49.62±9.02
Gender (male/female) 25/1
Ultramarathon experience (yrs) 5.52±2.67
Body weight (kg) 64.94±9.46 63.31±9.15 <0.001
BUN (mmol/L) 15.23±2.89 24.04±5.49 <0.001
Creatinine (mmol/L) 0.94±0.11 1.56±0.39 <0.001
Na (mmol/L) 139.73±1.08 139.92±3.61 0.786
K (mmol/L) 3.99±0.26 4.42±0.39 <0.001
Glu (mg/dL) 93.15±13.75 105.46±26.29 0.023
AST (U/L) 27.62±7.84 151.12±182.28 0.002
Myoglobin (μg/L) 48.9±20.63 4462.46±3391.87 <0.001
CK (U/L) 166.73±96.91 4274.81±5903.85 0.002
D-Dimer (mcg/mL) 0.29±0.36 0.51±0.51 0.005
Osmolarity (mosm/kgH2O) 290.08±8.83 300.88±7.25 <0.001
Procalcitonin (μg/L) 0.086±0.14 0.44±0.32 <0.001
Uric Acid (mg/dL) 5.82±1.05 7.12±1.30 <0.001
Continuous data presented as mean±SD.
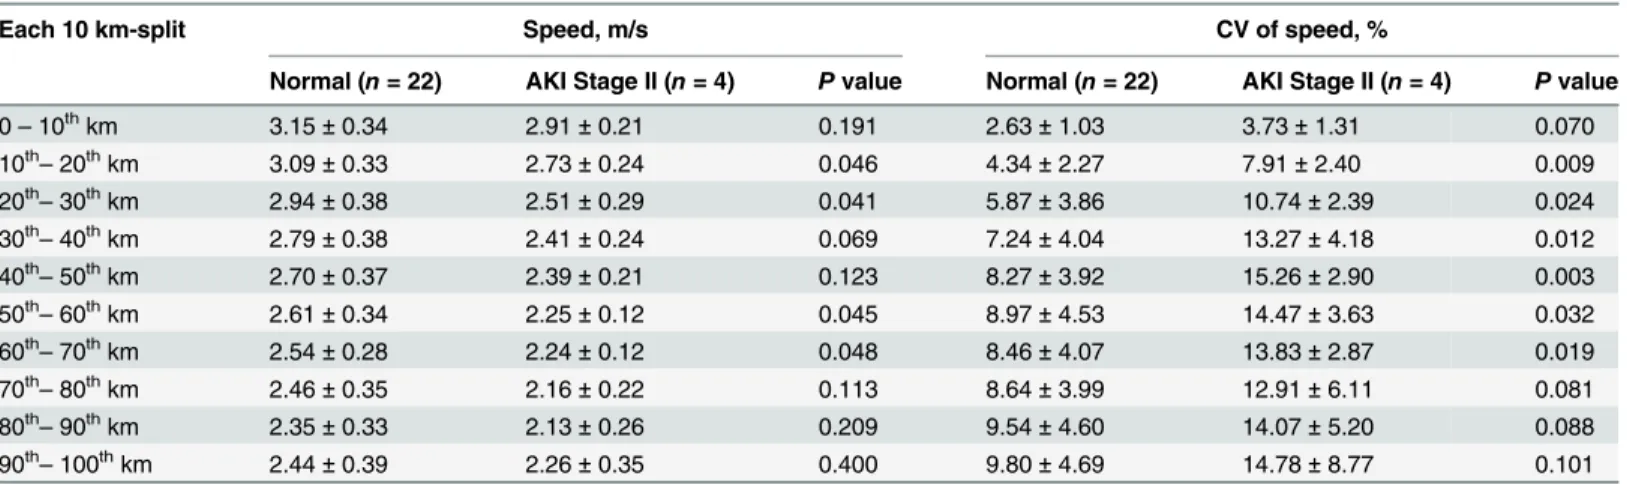
gradually following the progress of running distance. The highest mean speed (2.91 ± 0.21 vs. 3.15 ± 0.34 m/s) was detected in the initial 10 km-split (0–10thkm) and the lowest mean speed (2.13 ± 0.26 vs. 2.35 ± 0.33 m/s) showed in the penultimate 10 km-split (80th–90thkm). Due to the sprint before the end, the mean speed in the latest 10 km-split (90th–100th km) was slightly higher than the 80th–90thkm-split in both groups (Fig 1).
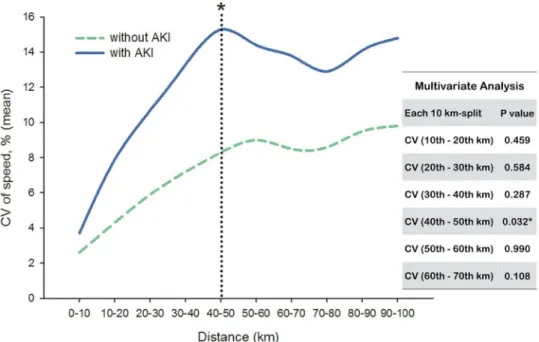
On the contrary, runners with or without AKI (Stage II) development both encountered an escalation of CV (Fig 2). From start to finish, runners who developed AKI (Stage II) experi-enced a steeper slope in change of CV than those without AKI. Strikingly, significant Table 3. Mean and coefficient of variation (CV) of speed in each 10 km-split between runners with or without AKI (Stage II) development.
Each 10 km-split Speed, m/s CV of speed, %
Normal (n= 22) AKI Stage II (n= 4) Pvalue Normal (n= 22) AKI Stage II (n= 4) Pvalue
0–10thkm 3.15±0.34 2.91±0.21 0.191 2.63±1.03 3.73±1.31 0.070
10th
–20thkm 3.09±0.33 2.73±0.24 0.046 4.34±2.27 7.91±2.40 0.009
20th–30thkm 2.94±0.38 2.51±0.29 0.041 5.87±3.86 10.74±2.39 0.024
30th–40thkm 2.79±0.38 2.41±0.24 0.069 7.24±4.04 13.27±4.18 0.012
40th
–50thkm 2.70±0.37 2.39±0.21 0.123 8.27±3.92 15.26±2.90 0.003
50th
–60thkm 2.61±0.34 2.25±0.12 0.045 8.97±4.53 14.47±3.63 0.032
60th–70thkm 2.54±0.28 2.24±0.12 0.048 8.46±4.07 13.83±2.87 0.019
70th–80thkm 2.46±0.35 2.16±0.22 0.113 8.64±3.99 12.91±6.11 0.081
80th
–90thkm 2.35±0.33 2.13±0.26 0.209 9.54±4.60 14.07±5.20 0.088
90th
–100thkm 2.44±0.39 2.26±0.35 0.400 9.80±4.69 14.78±8.77 0.101
doi:10.1371/journal.pone.0133146.t003
Fig 1. Mean speed of runners in each 10 km-split between runners with or without AKI (Stage II) development.There was no significant difference of mean speed between each group.
differences were found in CV between these two groups from secondary 10 km-split (10th–
20thkm-split) to 60th–70thkm-split. For runners developing AKI (Stage II), the highest CV of speed (15.26 ± 2.90%) occurred in the 40th–50thkm-split.
Individual CV was then applied to multiple logistic regression analysis with BMI and UA to create the predicted probability. Compared to BMI and UA, only CVs in specific 10 km-split (from 10th–20thkm-split to 60th–70thkm-split) were significant to predict the AKI (Stage II) development and showed discrimination ability in ROC curve (Table 4). We also used multivariate analysis to test the independent effect; however, majority of CV in different 10 km-split lost their significance associated to AKI (Stage II). Only CV in 40th–50thkm-split showed significant difference between runners with or without AKI (Stage II) development (p= 0.032).
Fig 2. Coefficient of variation (CV) of speed in each 10 km-split between runners with or without AKI (Stage II) development.Only CV in 40th
–50thkm-split showed significant difference (p= 0.032) between
each group in multivariate analysis*.
doi:10.1371/journal.pone.0133146.g002
Table 4. Discrimination ability of CV (by ROC curve) to predict AKI (Stage II) in individualized 10 km-split.
AUC Pvalue
CV (10th–20thkm) 0.989 0.002
CV (20th
–30thkm) 0.932 0.007
CV (30th
–40thkm) 0.999 0.002
CV (40th–50thkm) 0.966 0.004
CV (50th–60thkm) 0.943 0.006
CV (60th
–70thkm) 0.909 0.011
Definition of abbreviations: AUC = Area under curve.
Discussions
In our study, a high proportion of runners (84.6%) had laboratory evidence of AKI (Stage I or II) immediately after the race, and among them, 15.4% were in AKI Stage II. These finding was compatible to previous reports [12–14]. Although all runners with AKI had their renal function recovered on the next day, they were at risk to progress to more severe AKI if they received inadequate management during and after the high endurance exercise, such as inappropriate fluid supplement or NSAID use. In the literature, some studies examined the epidemiology of AKI in ultramarathon runners; however, there is no real-time predicting tool being used to identify runners at risk of AKI development during the ultramarathon event.
Hoffman and colleagues [29,30] reported that younger and less experienced ultramarathon runners were more at higher risk of exercise-related injuries. This finding may be dampened with years of adaptations, enhanced knowledge, and intrinsic psychological qualities. In this study, we found that runners with AKI (Stage II) were slightly older (49.50 ± 4.66 vs. 46.45 ± 9.6,p= 0.55) and less experienced (4.63 ± 1.49 vs. 5.67 ± 3.65,p= 0.59) than those
without AKI (Stage II); however, there was no statistically significant difference between each group. In addition, the impact of weekly training protocol in the prior 6 months was assessed and no significant difference was identified between each group (p= 0.331).
Many studies [7–9] demonstrated that exertional rhabdomyolysis occurs frequently in mar-athon/ultramarathon runners and might be a major risk factor of AKI. This complication is characterized by skeletal muscle break-down and leakage of muscle-cell contents into blood stream, such as CK, myoglobin, and electrolytes. The probable pathogenesis results from the renal toxicity of myoglobin, which may cause tubular obstruction and toxic reaction to the kid-ney. In our study, serum myoglobin was significantly increased after race in all runners, but there was no significant association between pre-race myoglobin and AKI (Stage II) develop-ment (45.4 ± 6.13 vs. 49.57 ± 22.41,p= 0.72). This finding revealed that pre-race myoglobin
level could not serve as a useful prediction factor for AKI in ultramarathon.
Dehydration is another risk factor for AKI development after endurance exercise. Although body weight loss does not mean dehydration absolutely, previous studies suggested to maintain exercise-induced body weight loss around 2–3% to prevent dehydration and improve perfor-mance [31–32]. In our study, body weight loss in first 4 hours did not show significant associa-tion to the development of AKI (Stage II) (1.75 ± 0.76 vs. 2.16 ± 1.33,p= 0.56). BMI was
another important issue to influence hydration status. Ritz and colleagues [33] reported that higher BMI was negatively correlated with body water space and more at risk of dehydration. In our study, runners who developed AKI (Stage II) had significant higher BMI (25.23 ± 2.02 vs. 22.55 ± 1.96,p= 0.02) compared to those who did not developed AKI (Stage II).
reports that fatigue related to glycogen depletion could occur after 40th–50thkm running at about 65% VO2max [34,35].
This is the first study to evaluate the association between variability of running speed and AKI development. It provides a useful tool (CV of speed) to identify the AKI development early. All runners ran over a flat 400 m oval track course, which would have excluded the influ-ence of attitude change and trail condition. Finally, we used each 10 km-split to calculate CV of speed which can minimize the effect of strategy approach to pacing.
There are some limitations in this study. First, we used lap times of each 400 m-track to cal-culate the running speed, not real-time GPS (Global Positioning System) velocity. Second, spe-cific speed data were excluded manually when runners rested, micturated, or took water and food. Third, the pre-race blood samples were obtained one week before ultramarathon, not immediately before the competition because runners hesitated to receive blood drawn close to the date of competition. Fourth, the study population was limited to Asian only without includ-ing a variety of races. Finally and most importantly, the study population is relative small to get a statistically powerful analysis
Conclusions
In conclusion, ultramarathon is a high endurance exercise associated with a variety of bio-chemical changes. Although the development of exercise-related AKI was not unusual in these ultra-runners, they recovered their renal function one day later. Because not all runners can routinely receive laboratory studies after race, variability of running speed (CV of speed) may offer a timely and efficient tool to identify AKI early during the competition. The importance of this proposed tool will require further validation.
Acknowledgments
This work was supported by Grant V100C-202 from Taipei Veterans General Hospital, Tai-wan. There are no conflicts of interest present.
Author Contributions
Conceived and designed the experiments: SKH WFK. Performed the experiments: SKH YHC WFK. Analyzed the data: YFT LCT. Contributed reagents/materials/analysis tools: CKH PCH CCY. Wrote the paper: SKH CKH PCH CCY.
References
1. Hoffman MD, Ong JC, Wang G. Historical analysis of participation in 161 km ultramarathon in North America.Int J Hist Sport. 2010; 27(11):1877–1891.
2. Waśkiewicz Z, Kłapcińska B, Sadowska-Krepa E, Czuba M, Kempa K, Kimsa E, et al. Acute metabolic responses to a 24-hmarathon race in male amateur runners.Eur J Appl Physiol. 2012; 112(5): 1679–1688.
3. Almond CS, Shin AY, Fortescue EB, Mannix RC, Wypij D, Binstadt BA, et al. Hyponatremia among run-ners in the Boston Marathon.N Engl J Med. 2005; 352(15):1550–1556.
4. Kipps C, Sharma S, Pedoe DT. The incidence of exercise-associated hyponatremia in the London mar-athon.Br J Sports Med. 2011; 45(1):14–19.
5. Casa DJ, Armstrong LE, Ganio MS, Yeargin SW. Exertional heat stroke in competitive athletes.Curr Sports Med Rep. 2005; 4(6):309–317.
6. Roberts WO. Exertional heat stroke in the marathon.Sports Med. 2007; 37(4–5):440–443.
7. Patel DR, Gyamfi R, Torres A. Exertional rhabdomyolysis and acute kidney injury.Phys Sportsmed. 2009; 37(1):71–79.
9. Bosch X, Poch E, Grau JM. Rhabdomyolysis and acute kidney injury.N Engl J Med. 2009; 361(1): 62–72.
10. Tunstall Pedoe DS. Marathon cardiac deaths: the london experience.Sports Med. 2007; 37(4–5): 448–450.
11. Asplund CA, O’Connor FG, Noakes TD. Exercise-associated collapse: an evidence-based review and primer for clinicians.Br J Sports Med. 2011; 45(14):1157–1162.
12. Lipman GS, Krabak BJ, Waite BL, Logan SB, Menon A, Chan GK. A prospective cohort study of acute kidney injury in multi-stage ultramarathon runners: the Biochemistry in Endurance Runner Study (BIERS).Res Sports Med. 2014; 22(2):185–192.
13. McCullough PA, Chinnaiyan KM, Gallagher MJ, Colar JM, Geddes T, Gold JM, et al. Changes in renal markers and acute kidney injury after marathon running.Nephrology (Carlton). 2011; 16(2):194–199.
14. Mohseni M, Silvers S, McNeil R, Diehl N, Vadeboncoeur T, Taylor W, et al. Prevalence of hyponatre-mia, renal dysfunction, and other electrolyte abnormalities among runners before and after completing a marathon or half marathon.Sports Health. 2011; 3(2):145–151.
15. Seedat YK, Aboo N, Naicker S, Parsoo I. Acute renal failure in the“Comrades Marathon”runners.Ren Fail. 1989–1990; 11(4):209–212.
16. Junglee NA, Di Felice U, Dolci A, Fortes MB, Jibani MM, Lemmey AB, et al. Exercising in a hot environ-ment with muscle damage: effects on acute kidney injury biomarkers and kidney function.Am J Physiol Renal Physiol. 2013; 305(6): F813–820.
17. Fortes MB, Di Felice U, Dolci A, Junglee NA, Crockford MJ, Wet L, et al. Muscle-damaging exercise increases heat strain during subsequent exercise heat stress.Med Sci Sports Exerc. 2013; 45(10): 1915–1924.
18. Kenney WL. Nonsteroidal anti-inflammatory drugs and the kidney.Curr Sports Med Rep. 2002; 1(3): 125–126.
19. Sanders LR. Exercise-induced acute renal failure associated with ibuprofen, hydrochlorothiazide, and triamterene.J Am Soc Nephrol. 1995; 5(12):2020–2023.
20. Lambert MI, Dugas JP, Kirkman MC, Mokone GG, Waldeck MR. Changes in running speeds in a 100 KM ultra-marathon race.J Sports Sci Med. 2004; 3(3):167–173.
21. Del Coso J, Fernández de Velasco D, Abián-Vicen J, Salinero JJ, González-Millán C, Areces F, et al. Running pace decrease during a marathon is positively related to blood markers of muscle damage. PLoS One. 2013; 8(2):e57602.
22. Santos-Lozano A, Collado PS, Foster C, Lucia A, Garatachea N. Influence of sex and level on mara-thon pacing strategy. Insights from the New York City Race.Int J Sports Med. 2014; 35(11):933–938.
23. Billat VL, Slawinski J, Danel M, Koralsztein JP. Effect of free versus constant pace on performance and oxygen kinetics in running.Med Sci Sports Exerc. 2001; 33(12):2082–2088.
24. Cottin F, Papelier Y, Durbin F, Koralsztein JP, Billat VL. Effect of fatigue on spontaneous velocity varia-tions in human middle-distance running: use of short-term Fourier transformation.Eur J Appl Physiol. 2002; 87(1):17–27.
25. Garcin M, Danel M, Billat V. Perceptual responses in free vs. constant pace exercise.Int J Sports Med. 2008; 29(6):453–459.
26. Lambert MI, Dugas JP, Kirkman MC, Mokone GG, Waldeck MR. Changes in running speed in a 100 km ultramarathon.J Sports Sci Med. 2004; 3(3):167–173.
27. Hoffman MD. Pacing by winners of a 161-km Mountain Ultramarathon.Int J Sports Physiol Perform. 2014; 9(6):1054–1056.
28. Mehta RL, Kellum JA, Shah SV, Molitoris BA, Ronco C, Warnock DG, et al. Acute Kidney Injury Net-work: report of an initiative to improve outcomes in acute kidney injury.Crit Care. 2007; 11(2):R31.
29. Hoffman MD, Stuempfle KJ, Fogard K, Hew-Butler T, Winger J, Weiss RH. Urine dipstick analysis for identification of runners susceptible to acute kidney injury following an ultramarathon.J Sports Sci. 2013; 31(1):20–31.
30. Hoffman MD, Krishnan E. Health and exercise-related medical issues among 1,212 ultramarathon run-ners: baseline findings from the ultrarunners Longitudinal TRAcking (ULTRA) Study.PLoS One. 2014; 9(1):e83867.
31. Goulet ED. Dehydration and endurance performance in competitive athletes.Nutr Rev. 2012; 70: S132–136.
32. Cheuvront SN, Carter R 3rd, Sawka MN. Fluid balance and endurance exercise performance.Curr Sports Med Rep. 2003; 2(4):202–208.
34. Bosch AN, Dennis SC, Noakes TD. Influence of carbohydrate loading on fuel substrate turnover and oxidation during prolonged exercise.J Appl Physiol. 1993; 74(4):1921–1927.