ACPD
11, 11109–11142, 2011Trajectory analysis on the origin of air mass and moisture
J.-M. Ryoo et al.
Title Page
Abstract Introduction
Conclusions References
Tables Figures
◭ ◮
◭ ◮
Back Close
Full Screen / Esc
Printer-friendly Version Interactive Discussion
Discussion
P
a
per
|
Dis
cussion
P
a
per
|
Discussion
P
a
per
|
Discussio
n
P
a
per
|
Atmos. Chem. Phys. Discuss., 11, 11109–11142, 2011 www.atmos-chem-phys-discuss.net/11/11109/2011/ doi:10.5194/acpd-11-11109-2011
© Author(s) 2011. CC Attribution 3.0 License.
Atmospheric Chemistry and Physics Discussions
This discussion paper is/has been under review for the journal Atmospheric Chemistry and Physics (ACP). Please refer to the corresponding final paper in ACP if available.
Trajectory analysis on the origin of air
mass and moisture associated with
Atmospheric Rivers over the west coast
of the United States
J.-M. Ryoo1, D. E. Waliser1,2, and E. J. Fetzer1
1
Jet Propulsion Laboratory, California Institute of Technology, Pasadena, CA, USA
2
Joint Institute for Regional Earth System Science and Engineering / Dept. Atmospheric and Oceanic Sciences, University of California, Los Angeles, CA, USA
Received: 17 February 2011 – Accepted: 1 March 2011 – Published: 11 April 2011 Correspondence to: J.-M. Ryoo ([email protected])
ACPD
11, 11109–11142, 2011Trajectory analysis on the origin of air mass and moisture
J.-M. Ryoo et al.
Title Page
Abstract Introduction
Conclusions References
Tables Figures
◭ ◮
◭ ◮
Back Close
Full Screen / Esc
Printer-friendly Version Interactive Discussion
Discussion
P
a
per
|
Dis
cussion
P
a
per
|
Discussion
P
a
per
|
Discussio
n
P
a
per
|
Abstract
The origins and pathways of air masses leading to heavy rainfall over the west coast of the United States are examined by computing the back-trajectories in a Lagrangian quasi-isentropic trajectory model. Extreme precipitation over the west coast of the United States often coincides with transport in a deep and narrow corridor of concen-5
trated water vapor band from the ocean, commonly referred to as Atmospheric Rivers (ARs). They also occur in conjunction with moisture plumes emanating from the trop-ics, or along the mid-latitude storm track. However, the actual moisture sources and the dynamic and thermodynamic processes of the moisture transport, are still unclear. Trajectories are found to be insensitive to the reanalysis data set used; we examined 10
NCEP, GMAO MERRA, and ECMWF ERA-Interim. Reconstructed water vapor mix-ing ratios along trajectories are in generally good agreement among the reanalysis datasets in most of the subtropics and extratropics, indicating that the large-scale cir-culation is a primary control for moisture transport over those regions. Clustering and pdf (probability density function) analyses illustrate that trajectories over the west coast 15
of United States have different origins. One group of trajectories (cluster 1) originates in the warm part of extratropical cyclones in the low level. The other group of trajectories (cluster 2) originates in the cold and dry regions in the mid-level (pressures less than 600 hPa) over northeastern Asia, then cross the Pacific Ocean. This study demon-strates that the quasi-isentropic Lagrangian trajectory model and clustering analysis 20
(that have been typically used to analyze trajectories in the upper troposphere and higher altitudes) can be used to examine sources of air masses and moisture, and also associated transport processes in the lower troposphere.
1 Introduction
The water resources in the west coast of the United States have been important issues 25
ACPD
11, 11109–11142, 2011Trajectory analysis on the origin of air mass and moisture
J.-M. Ryoo et al.
Title Page
Abstract Introduction
Conclusions References
Tables Figures
◭ ◮
◭ ◮
Back Close
Full Screen / Esc
Printer-friendly Version Interactive Discussion
Discussion
P
a
per
|
Dis
cussion
P
a
per
|
Discussion
P
a
per
|
Discussio
n
P
a
per
|
to get a better understanding of the precipitation sources has also increased. Devel-opment of satellite measurement techniques enables us to confirm that precipitation events in North America are closely related to the enhanced atmospheric moisture transport (Ralph et al., 2004, 2006; Neiman et al., 2006, 2008). Using satellite column integrated water vapor (IWV) images obtained from the Special Sensor Microwave Im-5
ager (SSM/I), Ralph et al. (2004) found that there are narrow bands of enhanced water vapor, especially over the central and eastern Pacific during winter. Ralph et al. (2006) also report that heavy orographic precipitation and severe flooding in northern Califor-nia’s Russian River basin are closely tied to narrow bands of water vapor transport, showing that severe precipitation events and water resources are closely related, es-10
pecially over coastal mountain regions.
These observational studies show that a deep and narrow band of concentrated wa-ter vapor transport is often found in extratropical cyclone warm sectors and confined to the pre-cold-frontal low-level jet (LLJ) region in the Pacific ocean, especially in Northern Hemisphere winter (Ralph et al., 2004; Bao et al., 2006; Neiman et al., 2002, 2008). 15
These bands tend to be quite narrow compared to the width scale of the sensible com-ponent of heat transport, so are responsible for about 90% of the poleward water vapor transport while occupying less than 10% of the zonal circumference at midlatitudes (Zhu and Newell, 1998; Ralph et al., 2004). These narrow and concentrated water va-por bands are referred to as Atmospheric Rivers (ARs) because they tend to be quite 20
narrow (less than 1000 km wide) relative to their length scale (generally larger than 2000 km). They are also referred to moisture conveyor belts, because case studies show that almost all of the moisture transport associated with the water vapor bands involve slantwise ascent within the warm part of extratropical cyclones (Wernli, 1997; Bao et al., 2006; Knippertz and Martin, 2007).
25
ACPD
11, 11109–11142, 2011Trajectory analysis on the origin of air mass and moisture
J.-M. Ryoo et al.
Title Page
Abstract Introduction
Conclusions References
Tables Figures
◭ ◮
◭ ◮
Back Close
Full Screen / Esc
Printer-friendly Version Interactive Discussion
Discussion
P
a
per
|
Dis
cussion
P
a
per
|
Discussion
P
a
per
|
Discussio
n
P
a
per
|
of extratropical cyclones making landfall with heavy precipitation on the US West Coast, a strong IWV band is observed all the way to the south, implying that a large amount of moisture is directly transported from the tropics (defined as south of 23.5◦N). However, based solely on satellite images and snapshot observations, it is still not apparent for heaviest rainfall events where moisture originates, whether the observed IWV bands 5
are related to water vapor transport between the tropics and extratropics, and whether cyclones transport moisture directly from the tropics along the IWV bands.
One useful way to examine sources and pathways is by tracing particles in a flow field with paths determined by local fluid velocity, using a Lagrangian trajectory model based on an advection-condensation concept (Sherwood, 1996; Dessler and Sher-10
wood, 2000; Waugh, 2005; Galewsky et al., 2005; Dessler and Minschwaner, 2007). The enhanced IWV bands indicate that they evolve and move with the development and transience of extratropical cyclones (Ralph et al., 2004; Neiman et al., 2008), suggesting that the IWV bands are dynamically related to the water vapor transport by extratropical cyclones, whose location and intensity are primarily controlled by the 15
large-scale circulation. Therefore, if we can trace parcel histories assuming that phys-ical quantities are conserved along material surfaces, we can trace where air parcels originate, and acquire information on a time record of dynamic conditions experienced by the air parcels. Recently, Bao et al. (2006) perform a trajectory analysis using a weather forecasting/prediction model (Pennsylvania State University/National Center 20
for Atmospheric Research mesoscale model, known as MM5) to find the origin of the enhanced IWV bands. Knippertz and Wernli (2010) also calculate water vapor flux from the trajectory model by interpolation the respective fields at a given time to iden-tify the tropical moisture export (TME), referring to the model estimated heavy rainfall (see more detail from Fig. 2 in Knippertz and Wernli, 2010). They all find that some 25
ACPD
11, 11109–11142, 2011Trajectory analysis on the origin of air mass and moisture
J.-M. Ryoo et al.
Title Page
Abstract Introduction
Conclusions References
Tables Figures
◭ ◮
◭ ◮
Back Close
Full Screen / Esc
Printer-friendly Version Interactive Discussion
Discussion
P
a
per
|
Dis
cussion
P
a
per
|
Discussion
P
a
per
|
Discussio
n
P
a
per
|
Here we use the NASA Goddard Lagrangian quasi-isentropic trajectory model (Schoeberl and Sparling, 1995) to study parcel trajectories. Large-scale motion is of primary interest to be considered, and no parameterizations for cloud physics, convec-tion, or planetary boundary layer processes are used. Several studies have demon-strated that free tropospheric specific humidity is determined to first order by the large-5
scale atmospheric circulation and temperature fields, with evaporation by microphysical process playing a minor role (Sherwood, 1996; Salathe and Hartmann, 1997; Pierre-humbert and Roca, 1998; Galewsky et al., 2005; Sherwood and Meyer, 2006; Dessler and Minchwaner, 2007; Wright et al., 2009). In this study, the time period simulated for each trajectory is two weeks, to see the evolutions of air parcels under the characteris-10
tic time scales of synoptic and planetary atmospheric motions. A Lagrangian trajectory model can provide important information on the quantitative evaluation of large-scale atmospheric circulation, and its control on the distribution and movement of air mass and moisture.
We utilize the wind, temperature and diabatic heating rate from NCEP, GMAO 15
MERRA (hereafter MERRA), and ECMWF ERA-interim (hereafter ECMWF-interim) data, enabling us to examine the sensitivity of trajectory simulations to the different reanalysis datasets. The effect of the resolution or validity of the meteorological re-analysis on the accuracy of the trajectory has not been well documented yet (Schoeberl and Sparling, 1995). Although it has been studied that high-spatial resolution meteo-20
rological analyses are not necessary to produce accurate trajectories by Waugh and Plumb (1994), they mostly focused on the stratosphere where advection is dominated by the large-scale flow. However, this may not be true for all atmospheric conditions, especially in the lower troposphere where convection having smaller lengths and time scales may dominate other processes. We will address this issue by examining the 25
sensitivity of our results to three different reanalysis datasets and discuss further in a later section.
ACPD
11, 11109–11142, 2011Trajectory analysis on the origin of air mass and moisture
J.-M. Ryoo et al.
Title Page
Abstract Introduction
Conclusions References
Tables Figures
◭ ◮
◭ ◮
Back Close
Full Screen / Esc
Printer-friendly Version Interactive Discussion
Discussion
P
a
per
|
Dis
cussion
P
a
per
|
Discussion
P
a
per
|
Discussio
n
P
a
per
|
is examined and discussed. Reconstructions of moisture from the model are shown in Sect. 2.4 and compared to observations, to see how well the trajectory model can capture the moisture field by the large-scale advection. Different origins and pathways of trajectories will be shown in Sect. 3. Clustering analysis is performed to identify the different pathways of air masses and their relative contribution to transported moisture 5
in Sect. 3.1. In Sect. 3.2, the pdf of last saturation location is examined in order to find the location where air masses are last saturated. Finally, the conclusions and future work are discussed in Sect. 4.
2 Trajectory model
2.1 Model configuration 10
The trajectory calculation in this study is performed using the NASA Goddard quasi-isentropic trajectory model (Schoeberl and Sparling, 1995). Isentropic trajectories are efficiently designed to be constrained to move on an isentrope, but the isentropic ap-proximation is only valid when there is no heat release during the process, meaning that diabatic effects are negligible. If it is necessary to track the parcels for a longer 15
time period more than about a week, diabatic effects should also be taken into account. When entropy is not conserved and we know the diabatic heating rate, the trajectory calculation can be done by computing the change in the potential temperature as a function of time. In these cases, the air parcel moves to another isentropic surface, and this is the so-called quasi-isentropic trajectory calculation. Consider an air parcel 20
in the Lagrangian frame of reference. For a given velocityU(t), the parcel history (back trajectory)X(t) can be calculated fromDX(t)/Dt=U(t), whereX(t) is a function of lon-gitude, latitude, and potential temperature. In the present study, we utilize winds and temperature from NCEP (e.g. Kalnay et al., 1996), GMAO MERRA, or ECMWF-interim reanalyses to determine the parcel trajectories. Each reanalysis dataset has different 25
ACPD
11, 11109–11142, 2011Trajectory analysis on the origin of air mass and moisture
J.-M. Ryoo et al.
Title Page
Abstract Introduction
Conclusions References
Tables Figures
◭ ◮
◭ ◮
Back Close
Full Screen / Esc
Printer-friendly Version Interactive Discussion
Discussion
P
a
per
|
Dis
cussion
P
a
per
|
Discussion
P
a
per
|
Discussio
n
P
a
per
|
17 vertical levels ranging from 1000 hPa up to 10 hPa, MERRA’s horizontal resolution is 0.5◦×0.66◦ (1.25◦×1.25◦ for some fields including specific and relative humidity) with 42 vertical levels ranging from 1000 hPa up to 0.01 hPa, and ECMWF-interim is resolved at 1.5◦×1.5◦ horizontally with 44 vertical levels. Diabatic heating rates used here have different components between reanalyses. NCEP diabatic heating contains 5
the contributions by short wave and long wave radiation, deep and shallow convec-tive, grid-scale cloud condensation, and turbulent heating rates. MERRA heating rates include short wave and long wave radiation, latent heat release due to water vapor condensation, surface sensible heat flux, gravity wave dissipation, vertical diffusion of temperature in the PBL, and frictional dissipation heating rates. ECMWF-interim heat-10
ing rates are calculated based on the estimating apparent heat sources (Yanai et al., 1973; Lau and Lau, 1992). So, despite some differences of terms, the diabatic heat-ing rate from all reanalyses includes the radiative, latent, and sensible heatheat-ing in the PBL. Since the trajectory vertical motion is determined by the diabatic heating, infor-mation about convective heating is implicit in the circulation being used for advection, 15
although heat release by these terms is not explicitly considered in this model (so no parameterizations for cloud physics, convection, planetary boundary layer processes are included). The trajectories are integrated for two weeks (∼14 days) to determine the trajectoryX(t) fort <0, or backward simulation. The reason for choosing two weeks as the simulation periods is that we are interested in the synoptic scale motions (larger 20
than 1000 km, about 1 week) as well as the planetary scale wave motions (∼10 000 km about 1 month), so these phenomena are expected to occur during those time periods. Furthermore, Schoeberl and Sparling (1995) concluded that the isentropic approxima-tion is valid for a 10 to 15 day time period, although the cumulative errors due to diabatic effects eventually results in a significant divergence of the trajectories.
25
2.2 Water vapor simulation
ACPD
11, 11109–11142, 2011Trajectory analysis on the origin of air mass and moisture
J.-M. Ryoo et al.
Title Page
Abstract Introduction
Conclusions References
Tables Figures
◭ ◮
◭ ◮
Back Close
Full Screen / Esc
Printer-friendly Version Interactive Discussion
Discussion
P
a
per
|
Dis
cussion
P
a
per
|
Discussion
P
a
per
|
Discussio
n
P
a
per
|
assume that the parcel’s water vapor mixing ratio (q) is conserved along the trajec-tory except when the RH exceeds a critical value (100%), at which point the RH and
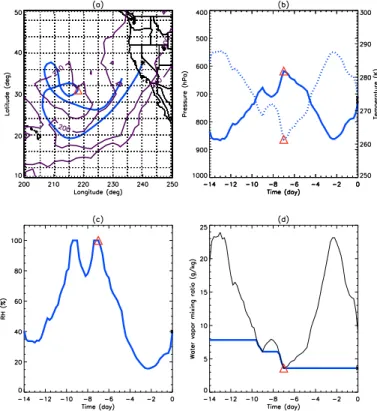
q are reset to this value (i.e. water exceeding the critical value is removed). At that point the water content is reduced in order to maintain RH at 100% and all the con-densed water rains out. Figure 1 illustrates the water vapor simulation for a simple 5
trajectory. Figure 1a shows the horizontal evolution of a trajectory from a given point (37.5◦N, 238◦E, 300 K). The pressure and temperature history corresponding to the parcel is shown in Fig. 1b. Figure 1c and d shows the temporal variation of the RH,
q, and saturation mixing ratio (qs, black thin curve), respectively. For periods when RH<100 %, the mixing ratio q remains constant (e.g. days=−14 to −10) whereas 10
when RH=100%,q tracesqs (e.g. days=−10 to−9) until it reaches the minimumqs
at day=−7. This suggests that when the parcel encounters the most recent moisture source region (where the deep convection is marked by OLR lower than 240 W m−2) in Fig. 1a, the parcel reaches last saturation. After having the parcel raining out the excess water, theq in unsaturated air (q at day 0) is set by the minimumqs encoun-15
tered over the 14 days (which in this case occurs at day 0). There is variability among events, but generally sensitivity is very small when RH is switched to 90% to consider the subgrid-scale saturation.
The water vapor simulations performed in this study are similar to those from the trajectory models by Dessler and Sherwood (2000), Waugh (2005), and Dessler and 20
Minschwaner (2007), except for the initialization methods for q and vertical motions. Dessler and Sherwood (2000) and Waugh (2005) assume that the water vapor content is determined by the RH which is equal to 50% at the end of the back trajectory (20 days before day=0), and Dessler and Minschwaner (2007) determined moisture at a dehy-dration event when the parcel’s potential temperature exceeds a certain threshold (i.e. 25
ACPD
11, 11109–11142, 2011Trajectory analysis on the origin of air mass and moisture
J.-M. Ryoo et al.
Title Page
Abstract Introduction
Conclusions References
Tables Figures
◭ ◮
◭ ◮
Back Close
Full Screen / Esc
Printer-friendly Version Interactive Discussion
Discussion
P
a
per
|
Dis
cussion
P
a
per
|
Discussion
P
a
per
|
Discussio
n
P
a
per
|
lower troposphere, which includes the level we consider (∼300 K), calculatedq has a dry bias if the initial value of RH is set to a much smaller value than 50% (not shown).
This model is a kinematic model accounting for large-scale atmospheric motion, so may not capture the moisture variation due to microphysical processes, or from the in-teraction between large-scale processes and small-scale physical phenomena. How-5
ever, from this model we can identify to what extent large-scale motions are responsible for transporting moisture in the atmosphere, and evaluate the regional significance of atmospheric mixing.
2.3 Sensitivity of different reanalysis data
As mentioned earlier, it is worth quantifying whether the differences in the meteorolog-10
ical reanalysis data have an impact on the trajectories over time. We will discuss the sensitivity and effect of different reanalysis dataset on the modeled trajectory.
2.3.1 Temporal sensitivity
Figure 2 shows the horizontal evolution of backward trajectories from the reference point (235–240◦E, 37–43◦N) at 3, 7, and 14 days for one of the AR events, 16 Febru-15
ary 2004. The spatial evolution of trajectories using three different datasets is similar in the 3 day of the simulation. These patterns become different after 4–5 days (see the middle, bottom panels of Fig. 2), but the overall structure is still consistent between trajectories among different reanalyses. However, the difference of pathways among these trajectories becomes larger as the simulation period gets longer. For example, 20
at a simulation after 7 days, the trajectories from MERRA and ECMWF-interim data originate in the subtropical eastern Pacific (around 15–25◦N, 200–250◦E), but those from NCEP come from the south of the eastern Pacific (around 10◦N, 250◦E).
We quantify this via correlations between trajectories from various dataset. Figure 2b shows that (a) the correlation vs. time and (b) root mean square error (RMSE) vs. time 25
ACPD
11, 11109–11142, 2011Trajectory analysis on the origin of air mass and moisture
J.-M. Ryoo et al.
Title Page
Abstract Introduction
Conclusions References
Tables Figures
◭ ◮
◭ ◮
Back Close
Full Screen / Esc
Printer-friendly Version Interactive Discussion
Discussion
P
a
per
|
Dis
cussion
P
a
per
|
Discussion
P
a
per
|
Discussio
n
P
a
per
|
latitude, pressure) separately for the trajectories in the regions of interest, then average the values. RMSE can be a good measure of the differences between trajectories simulated from different dataset.
RMSE =
v u u u t
n
P
i=1
(x1,i − x2,i)2
n (1)
Where, x1,i and x2,i are the trajectories from different dataset and i is the longitude, 5
latitude, and pressure. Figure 2b shows that there are dramatic decreases in mean correlation from about 1∼0.9 to 0.7 around simulation day=−7∼ −8 with large varia-tions among dataset. After day=−7, correlation decreases to 0.7. (1) also becomes larger a week after the simulation start (day=0), having a peak around day=−9, and fluctuating decreases afterward.
10
In general, the difference between the actual and computed trajectories can become significant after about a week because diabatic heating effect on the trajectories will be more important as the trajectory period increases. Scheoberl and Sparling (1995) showed that the difference will increase proportionally to the square of the time pe-riod, but demonstrated that the 14 day-trajectory period is adequate when using an 15
isentropic approximation. Figure 2a illustrates that 14 day trajectories can be repre-sentative of actual trajectories because we also consider quasi-isentropic conditions by taking into account the diabatic heating effect via vertical motion. It appears that the 14 day trajectories capture well the general pattern of horizontal position of trajectories: the movement of air parcels in the warm sector (200–250◦E, 15◦N) and cold sector 20
ACPD
11, 11109–11142, 2011Trajectory analysis on the origin of air mass and moisture
J.-M. Ryoo et al.
Title Page
Abstract Introduction
Conclusions References
Tables Figures
◭ ◮
◭ ◮
Back Close
Full Screen / Esc
Printer-friendly Version Interactive Discussion
Discussion
P
a
per
|
Dis
cussion
P
a
per
|
Discussion
P
a
per
|
Discussio
n
P
a
per
|
2.3.2 Spatial sensitivity
Within the two week period of the simulation, we look at the evolution of trajectories. Figure 3 shows the history of the horizontal and vertical locations of air parcels from the reference region (235–245◦E, 37–43◦N, the same as in Fig. 2 but 5◦E wider) for a dif-ferent AR event (30 December 2005). The overall horizontal patterns of trajectories are 5
remarkably similar among three dataset almost during the two-week simulation period. The vertical motions of trajectories are similar datasets as well, especially those be-tween MERRA and ECMWF interim data, which show over decreasing patterns around day=−6∼ −8 day and increasing patterns around day=−1, reaching to the target day (day=0). However, there are still differences between the trajectories obtained from 10
each reanalysis dataset in terms of peak, distribution, and the range of trajectories. In addition, more saturation of air parcels occurs when simulating trajectories using NCEP and MERRA rather than when using ECMWF-interim. The discrepancy seems to be due not only to the different spatial and temporal scales of the datasets, but also the different diabatic heating rates used for the vertical coordinate of the trajectories. The 15
monthly mean diabatic heating rate from NCEP, MERRA, and ECMWF-interim data show that the latitudinal distributions in the mean diabatic heating rates are similar be-tween the three datasets, but those in the maximum and minimum values, especially around 700 hPa between 35–45◦N are larger in NCEP and GMAO MERRA than those in ECMWF-interim (not shown).
20
Assuming that the vertical motion of the parcel is entirely due to the time-dependent topography of the potential temperature (Dθ
Dt), the difference in vertical motion may be due to the differences in diabatic heating rate information as well as in spatial and temporal resolution among datasets. We use diabatic heating rates from model (NCEP, MERRA) and direct calculation (ECMWF-interim). To check if differences in vertical 25
ACPD
11, 11109–11142, 2011Trajectory analysis on the origin of air mass and moisture
J.-M. Ryoo et al.
Title Page
Abstract Introduction
Conclusions References
Tables Figures
◭ ◮
◭ ◮
Back Close
Full Screen / Esc
Printer-friendly Version Interactive Discussion
Discussion
P
a
per
|
Dis
cussion
P
a
per
|
Discussion
P
a
per
|
Discussio
n
P
a
per
|
From Figs. 2 and 3, we found that trajectory results are insensitive to the resolution or accuracy of the meteorological analysis field in the region we are interested in for this study. This will probably not hold true for all meteorological conditions, especially in the highly convective region where vertical winds are determined by the resolution of reanalysis dataset (Ryoo, 2009). When we trace air masses in the tropical oceanic 5
regions, trajectories using all three reanalysis datasets show different patterns to some extent, implying that trajectories can be distorted depending on the accuracy and res-olution of a given reanalysis data set. For example, the observational error can be minimized if the models transport air from a region that has good observational cov-erage (e.g. over the United States) to a region that has little or no covcov-erage (e.g. over 10
the adjacent ocean). Trajectory model accuracy depends on the numerical accuracy of the time-stepping scheme, but also on the accuracy of the spatial interpolation scheme (Scheoberl and Sparling, 1995). Oceanic regions have poor data coverage, so that the large amount of interpolation from these insufficient meteorological datasets may be the central computational issue in a trajectory analysis.
15
2.4 Reconstruction ofq using last saturation
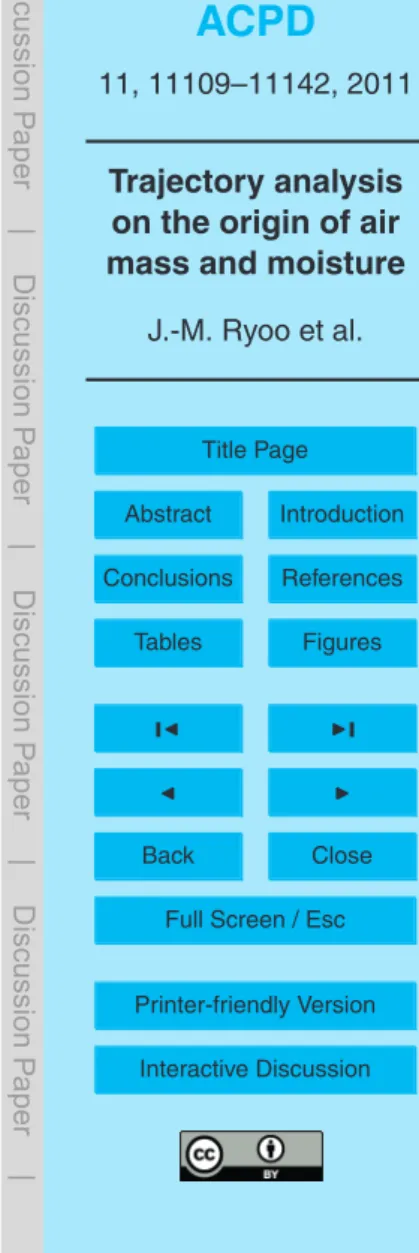
The reliability of the trajectory-based water vapor simulation depends on how accu-rately the reconstructed fields reflect the underlying water vapor field. Figure 4 shows the reconstructedq from the trajectory model (left) and the corresponding reanalysis dataset (right) at 300 K. This distribution can be obtained from the minimum satura-20
tion mixing ratio (qs) at the target day (day 0) when each grid point (according to the spatial resolution of each reanalysis data) is set to the reference point. Despite the dif-ference in details, there is good agreement between the reconstructedqand MERRA and ECMWF-interim specific humidity (approximately similar toq), especially the thin filamentary pattern in the Pacific and the west coast of United States. The largest diff er-25
ACPD
11, 11109–11142, 2011Trajectory analysis on the origin of air mass and moisture
J.-M. Ryoo et al.
Title Page
Abstract Introduction
Conclusions References
Tables Figures
◭ ◮
◭ ◮
Back Close
Full Screen / Esc
Printer-friendly Version Interactive Discussion
Discussion
P
a
per
|
Dis
cussion
P
a
per
|
Discussion
P
a
per
|
Discussio
n
P
a
per
|
specific humidity, especially in the ocean adjacent to North America or the orographic region, and this may be due to the bad observational coverage. In contrast, trajectory
qsimulated from the ECMWF-interim data underestimate reanalysis specific humidity over southern California. It appears that weaker saturation due to a smaller diabatic heating rate and other terrain effects may cause the dryness.
5
While there are slight differences in the reconstructed q, the overall features of the reanalysis specific humidity are represented well in Fig. 4. The reliability of the recon-structed trajectory q would depend on how realistic the reanalysis data is, which is determined by model physics and observation. This is because trajectory simulations are primarily based on the reanalysis temperature, wind and diabatic heating rate, so 10
that small errors in those terms can accumulate, resulting in unrepresentativeness of the actual saturation values encountered by parcels. In fact, the reconstructions of tra-jectoryqusing NCEP reanalysis data are poorer than those using GMAO MERRA and ECMWF-interim, although NCEP is still able to capture the large scale features of the NCEP reanalysis specific humidity. (not shown). In order to make use ofq from direct 15
observation rather than reanalysis specific humidity as an initial value, we tested this usingq from satellite data taken by the Atmospheric Infrared Sounder (AIRS). Recall that we set the initial RH of the each trajectory to the reanalysis RH to determineq at the end points of trajectory (i.e. 14 days before day=0). However, when we use AIRS RH to obtain more realisticq, the reconstruction was not as good. This is apparently 20
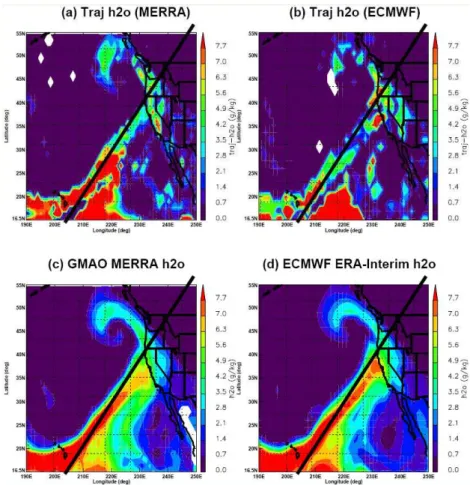
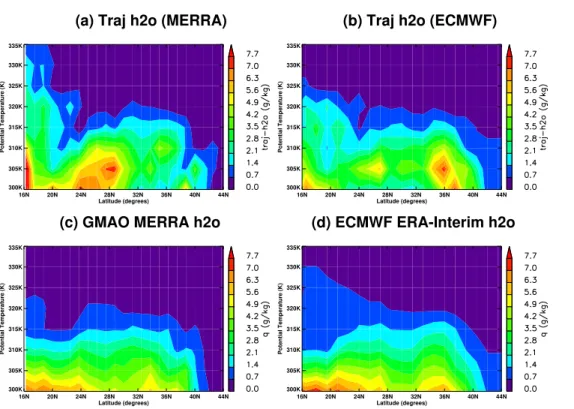
because AIRS has limitation in measuring the water vapor and RH over cloudy re-gions, with missing observations especially frequent in heavy precipitation events such as ARs. Figure 5 shows the vertical cross-sections of the average trajectory specific humidity in∼4◦ wide boxes orthogonal to the lines marked in Fig. 4. (The averages are over the boxes to reduce the noise on single lines.) Along 300 K, there is a good 25
ACPD
11, 11109–11142, 2011Trajectory analysis on the origin of air mass and moisture
J.-M. Ryoo et al.
Title Page
Abstract Introduction
Conclusions References
Tables Figures
◭ ◮
◭ ◮
Back Close
Full Screen / Esc
Printer-friendly Version Interactive Discussion
Discussion
P
a
per
|
Dis
cussion
P
a
per
|
Discussion
P
a
per
|
Discussio
n
P
a
per
|
the free troposphere, especially dry regions (Salathe and Hartmann, 1997; Dessler and Sherwood, 2000; Galewsky et al., 2005; Waugh et al., 2005; Schneider et al., 2009). However, trajectoryqnear the surface (between 295 K and 305 K), especially between 30–34◦N where eddy activity is strong, cannot capture the feature shown in MERRA specific humidity. This implies that small-scale microphysical processes (e.g. convec-5
tion, mixing by eddies) near the surface in the extratropics may play a significant role in transporting moisture over the US. The vertical distribution of reconstructed trajec-toryqusing ECMWF-interim shows underestimates of the value of reanalysis specific humidity. As we discussed before, this may be due to the lower vertical displacement of trajectories using ECMWF-interim, resulting in less saturation of the trajectories. 10
Some of the differences seen in Fig. 5 may be due to the averaging processes in-volved in the reconstruction process. The humidity is critically dependent on the mini-mum temperatures encountered by air parcels because RH=q/qsandqsis governed by the Clausius-Clapeyron equation which is strongly dependent on local temperature. If the temperatures are not accurate, the averaged mixing ratios of the last satura-15
tion will be unrepresentative of the actual minima encountered by individual parcels. Recreation of RH from the Lagrangian trajectory model cannot be used if large-scale advection is not a dominant process, because other processes will distort a trajectory as the simulation proceeds. However, as we have seen in Figs. 4 and 5, trajectory simulations can still provide the leading order structure, and even the error terms can 20
be used for evaluating the relative significance of large-scale circulation on moisture transport.
3 Origin of air mass and moisture
The above analysis has shown that the trajectory-simulated water vapor reproduces key features of the observed q. This implies that these trajectory simulations can be 25
ACPD
11, 11109–11142, 2011Trajectory analysis on the origin of air mass and moisture
J.-M. Ryoo et al.
Title Page
Abstract Introduction
Conclusions References
Tables Figures
◭ ◮
◭ ◮
Back Close
Full Screen / Esc
Printer-friendly Version Interactive Discussion
Discussion
P
a
per
|
Dis
cussion
P
a
per
|
Discussion
P
a
per
|
Discussio
n
P
a
per
|
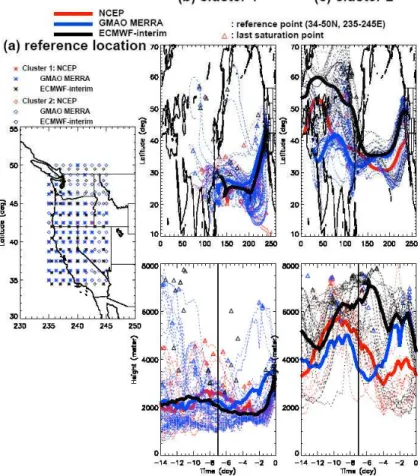
to different locations. Figure 6 illustrates the horizontal and vertical structures of all trajectories from reference region (235–245◦E, 34–50◦N) for one AR event (16 Febru-ary 2004), showing that there are large variations between trajectories. Given this wide range of trajectory patterns, it is difficult to determine the origins, pathways, and varia-tions between regions. If we can group the trajectories based on similar characteristics, 5
we can identify the different pathways that affect moisture transport to the region we are interested in, when dominated by the large-scale circulation. In addition, we will be able to find the relative role of different transport processes in determining the wa-ter vapor distributions associated with AR events along the United States west coast. To distinguish different trajectory types, we have classified trajectories using clustering 10
analysis.
3.1 Clustering method
We use theK-means clustering algorithm provided by Interface Description Language (IDL v5.0). With this technique, K-means clustering function starts with K random clusters, where K is the number of clusters, and then iteratively moves trajectories 15
between clusters, minimizing variability within each cluster and maximizing variability between clusters. When applied to the trajectories X, we use groups of trajectories ending at a specific point Xk=(λk; φk; θk) where λ is longitude, φ is latitude, θ is potential temperature, andk is the index for the ending locations. For a given ending location (fixedk) there will be a group of trajectories denoted asS(Xk;tj): j=0,. . . , 20
−m, forjat a certain trajectory location. Indexmis a sequence of points in time, which is 14 days (the actual data point is 71 because we have 5 points per day (5×14=70) and ending time atj=0). For instance, tj is a sequence of time at a given location
Xk=(20◦E, 10◦N, 300 K) andS(Xk;tj) is a group of trajectories on 16 February 2004 (target day).
25
Although the variance of the trajectory pointsS(Xk;tj): j=0,. . . ,−mincreases asj
ACPD
11, 11109–11142, 2011Trajectory analysis on the origin of air mass and moisture
J.-M. Ryoo et al.
Title Page
Abstract Introduction
Conclusions References
Tables Figures
◭ ◮
◭ ◮
Back Close
Full Screen / Esc
Printer-friendly Version Interactive Discussion
Discussion
P
a
per
|
Dis
cussion
P
a
per
|
Discussion
P
a
per
|
Discussio
n
P
a
per
|
longer time period to capture not only the synoptic scale motions, but also patterns of planetary waves related to the air mass and moisture transport in the lower level. Bao et al. (2006) focuses on the short time period of trajectories because the error terms become larger as the simulation time increases. However, within a short period (∼5– 6 days), we are only able to capture the air mass transported from the local area of 5
a reference point, leading to a loss of importance information for air mass originating from the long distance with advective times greater than 5–6 days.
For cluster characterization we use longitude and latitude for the horizontal coor-dinates and height for the vertical coordinate. Vertical coorcoor-dinates are important in defining clusters, which are closely tied to determine moisture transport (Ryoo, 2009). 10
Fernau and Samson (1990) and Dorling et al. (1992) ignored the vertical transport when constructing trajectory clusters and Cape et al. (2000) argued that changing the scale of pressure has minimal effect on the cluster. This may be partially due to their fo-cus on the surface levels, where geographical source areas are considered to be more important than vertical air movements. However, in the lower and mid troposphere the 15
vertical motion is assumed to play a dominant role in defining the pathways and cap-turing moisture. Based on this idea, we adopt height as the most appropriate vertical coordinate for classifying the trajectory data.
AlthoughK-means clustering is one of the most efficient algorithms for classify data, it has weakness. When there are few data points, the initial grouping has a significant 20
impact on the clusters. Also, the number of clusters,K, must be determined before-hand. Clustering using the arithmetic mean is not robust to outliers because data that are very far from the remaining data will have too much influence on the mean value. One way to overcome this weakness is to use the median, which we do in this study. Overall, clustering is appropriate to trajectory data because it treats all coordinates with 25
ACPD
11, 11109–11142, 2011Trajectory analysis on the origin of air mass and moisture
J.-M. Ryoo et al.
Title Page
Abstract Introduction
Conclusions References
Tables Figures
◭ ◮
◭ ◮
Back Close
Full Screen / Esc
Printer-friendly Version Interactive Discussion
Discussion
P
a
per
|
Dis
cussion
P
a
per
|
Discussion
P
a
per
|
Discussio
n
P
a
per
|
3.1.1 Trajectory case
AlthoughK-mean clustering method has no constraint on the number of clustersK, it is determined by optimizing clusters based on their features. Allowing some variabil-ity among events, most trajectories for the AR events that we have examined are well classified into two categories: ascending and descending. Figure 7 illustrates the hor-5
izontal and vertical trajectory patterns for two clusters at the same reference point as in Fig. 6 (235–245◦E, 34–50◦N) on 300 K in 16 February 2004. These trajectories are obtained from three reanalysis datasets (NCEP, GMAO MERRA, and ECMWF-interim). Figure 7a shows that the location of trajectories associated with each cluster, Fig. 7b illustrates the ascending patterns and the time evolution of corresponding cluster cen-10
ters, and Fig. 7c shows the descending patterns and the associated time evolution of cluster centers. Clustering can capture the distinct characteristics from the very com-plex pattern of trajectories shown in Fig 6. In this AR case, many trajectories corre-sponding to cluster 1 are located near the southwestern coastal regions, ranging from 34–44◦N, 235–240◦E, becoming narrower when going up to 235–239◦E, 45–49◦N. A 15
large portions of trajectories corresponding to cluster 2 are detected in land, mainly in the northwest leeward the western mountain regions. Each triangle in Fig. 7 repre-sents the location (top) and the time (bottom) of the last saturation of the air parcels. For cluster 1 corresponding to the ascending motion (Fig. 7b), most of the saturation occur about 1–4 km above the surface. It takes less than 5 days for parcels to reach 20
last saturation from the target day (day=0). In contrast, for cluster 2, corresponding to descending motion in Fig. 7c, saturation occurs mostly around 5–8 km (pressures less than 600 hPa) and it takes roughly a week or longer to get to the last saturation point. Also, the variations of cluster center among the three datasets are small in cluster 1, but there are large temporal and spatial variations of the cluster centers among the 25
reanalysis datasets in cluster 2.
ACPD
11, 11109–11142, 2011Trajectory analysis on the origin of air mass and moisture
J.-M. Ryoo et al.
Title Page
Abstract Introduction
Conclusions References
Tables Figures
◭ ◮
◭ ◮
Back Close
Full Screen / Esc
Printer-friendly Version Interactive Discussion
Discussion
P
a
per
|
Dis
cussion
P
a
per
|
Discussion
P
a
per
|
Discussio
n
P
a
per
|
in. The different cluster patterns show the different last saturation times and locations, implying that air trajectories have different origins and pathways. As seen in Fig. 7, the source of moisture carried by parcels associated with cluster 1 is local, so it takes only a few days for parcels to saturate. The source of moisture carried by parcels in cluster 2 is remote, mainly from central and north Asia and high altitude, taking more 5
than a few days to become saturated. We will discuss the robust of these features in actual AR events in the next section.
3.2 Last saturation locations
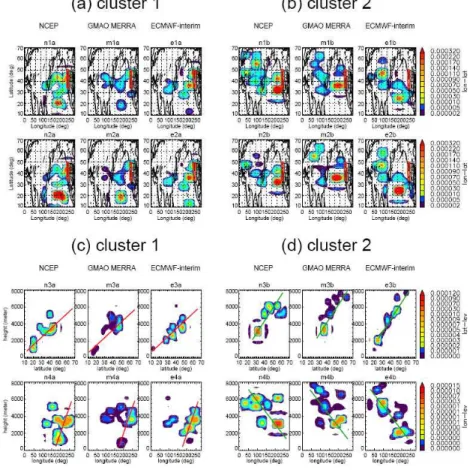
To ensure that the considered air parcels are likely to maintain characteristics of air parcels on their way during the trajectory simulation, we formulate pdf of last saturation 10
location only when parcels are last saturated within a week backward from each AR event (day=0) at reference region (235–245◦E, 340–50◦N, indicated by boxed areas; red). Figure 8 shows that the composite of the pdfs of the last saturation locations corresponding to the two clusters as in Fig. 7 in the reference region (235–245◦E, 34– 50◦N) for six AR events (5 February 1998; 16 February 2004; 30 December 2005; 15
27 February 2006; 10 February 2007; and 4 December 2007) from NCEP (marked as n), GMAO MERRA (m), and ECMWF ERA-interim (e), respectively (5 February 1998 case is omitted for NCEP because no diabatic heating rate data is available at this time). We computed the pdf of last saturation location for each AR case, and then composite them all for six AR events. The sensitivity of initial value of q on the last 20
saturation location was small (initial valueq is set from the reanalysis RH andqs cal-culated from Reanalysis temperature and pressure).
Although pdf for each event exhibits different patterns (not shown), there are com-mon features in the last saturation location acom-mong AR events. Two characteristics are found for the AR cases. Cluster 1, trajectories are in the mid-latitude eastern Pacific 25
ACPD
11, 11109–11142, 2011Trajectory analysis on the origin of air mass and moisture
J.-M. Ryoo et al.
Title Page
Abstract Introduction
Conclusions References
Tables Figures
◭ ◮
◭ ◮
Back Close
Full Screen / Esc
Printer-friendly Version Interactive Discussion
Discussion
P
a
per
|
Dis
cussion
P
a
per
|
Discussion
P
a
per
|
Discussio
n
P
a
per
|
altitudes (∼900 hPa) (See Fig. 8a. n(m, e) 1a–4a). Cluster 2 trajectories are located throughout the whole Pacific in the mid-latitude, or tropical-extratropical regions (80– 245◦E and 30–40◦N; 50–180◦E and 40–50◦N, from above 600 hPa (See Fig. 8b. n(m, e) 1b–4b). Variability among the different AR events exists, but this may be an impor-tant property of the ARs. Ralph et al. (2010) pointed out that AR events may originate 5
through a wide variety of large scale flow patterns over the Pacific. Thus, the wide range of last saturation locations among ARs may reveal how various synoptic con-ditions associated with the large-scale circulation can lead to extreme precipitation in North America.
While Figs. 8a n(m, e) 1a and 8b n(m, e) 1b show which regions contribute most 10
to last saturation of air at reference points, they do not by themselves provide any information about the actual value of moisture included in that air. To account for not only the frequency of saturation of moisture, but also the actual amount of moisture when they are last saturated, we multiply the pdf of last saturation location for each AR event byqsand composite them, as shown in Figs. 8a n(m, e) 2a and 8b n(m, e) 2b. 15
They highlight that high values are observed in not only northern Siberia at 3 km above the surface, but also around 15–25◦N near the surface (∼1 km). This is quite reasonable because most of moisture sources are over the tropical ocean at lower altitudes, ultimately the surface. This also indicates that although the saturation oc-curs more frequently north of 35◦N and at upper levels, a large amount of moisture 20
originates in the south of 35◦N in the lower atmosphere.
The pdf analyses show that the amount of water vapor simulated from this trajectory model provides useful information about where water vapor originates, ends up, and how it leads to extreme rainfalls in the west coast of US. This may not include the effect of local condensation or evaporation processes, because water vapor at the reference 25
ACPD
11, 11109–11142, 2011Trajectory analysis on the origin of air mass and moisture
J.-M. Ryoo et al.
Title Page
Abstract Introduction
Conclusions References
Tables Figures
◭ ◮
◭ ◮
Back Close
Full Screen / Esc
Printer-friendly Version Interactive Discussion
Discussion
P
a
per
|
Dis
cussion
P
a
per
|
Discussion
P
a
per
|
Discussio
n
P
a
per
|
shows how large-scale controls on ARs, and so it is still worthwhile to characterize the dominant process of Lagrangian moisture transport along the AR.
Future research is needed into last saturation and its implication for Lagrangian transport on water vapor sources and sinks, and the effects of diabatic heating on moisture transport calculated by Eulerian approach. The last saturation occuring over 5
central Asia in cluster 2 is of particular interest. Park et al. (2010) showed that cen-tral Asian mountains play a role in suppressing North Pacific storminess by weakening downstream eddy development and reducing the number of eddy disturbance through a decrease in baroclinic energy conversion. Although it takes more than a few days for trajectories associated with cluster 2 to become saturated, most saturation locations 10
are at relatively drier higher altitudes (pressures less than 600 hPa), where moisture can be transported while being conserved. The relationship between cluster 2 cases and ARs frequency and magnitude should be examined further in future work.
4 Conclusions
Case studies for the atmospheric river (AR) are performed using a Lagrangian quasi-15
isentropic trajectory model in the Northern Hemisphere wintertime. Trajectory calcu-lations have been conducted using three reanalysis datasets (NCEP, GMAO MERRA, and ECMWF-interim), each having different spatial and temporal resolutions. Trajec-tories using all three datasets show similar patterns, especially in terms of horizontal movement. For vertical motion, despite similarity of the general patterns, the maximum 20
altitudes where trajectories can reach are different among reanalyses. These diff er-ences appear to be due to the difference in the diabatic heating rate, however this does not affect the general pattern of trajectories.
Reconstructed trajectory-simulated qs are generally agree to leading order, with reanalysis datasets in most of the subtropics and extratropics including the western 25
ACPD
11, 11109–11142, 2011Trajectory analysis on the origin of air mass and moisture
J.-M. Ryoo et al.
Title Page
Abstract Introduction
Conclusions References
Tables Figures
◭ ◮
◭ ◮
Back Close
Full Screen / Esc
Printer-friendly Version Interactive Discussion
Discussion
P
a
per
|
Dis
cussion
P
a
per
|
Discussion
P
a
per
|
Discussio
n
P
a
per
|
and moisture. The largest difference between simulated and reanalysis water vapor is observed at the convective regions of the deep tropics in the Pacific Ocean, and at the edge of continents in the coasts and mountain regions, largely because the microphys-ical processes such as convective mixing or condensate evaporation occur vigorously there. However, despite some differences in detail, the overall feature, such as the 5
tail (boundary) of the moisture plume along the high water vapor bands, as well as the primary pathway of moisture transport, are well reproduced in the trajectory simulation. Cluster analysis is used to describe characteristics of trajectories having different origin and pathway, and helps explain the variability of trajectories associated with dif-ferent processes. We find that trajectories have two important branches – the northern 10
branch of trajectories with dry and cold origins, and the southern branch with moist and warm origins. Pdfs of last saturation locations also show that trajectories over the US west coast have their origin not only in the warm part of extratropical cyclones near the surface but also in the cold and dry air over the northeastern Asia. To account for not only the frequency of saturation of moisture, but also the actual amount of moisture 15
when they are last saturated, we multiply the pdf of last saturation location for each AR event byqs and composite them. By weighting the pdfs with qs, we have shown that the parcels experiencing local saturation near the surface in the Pacific can bring mois-ture to the west coastal regions of the US. Very recently, Ralph et al. (2010) described multi-scale processes from the planetary scale to the mesoscale related to AR, and 20
all contribute to moisture transport during extreme rainfall events. Their findings are in agreement with our results in that we find significant number of planetary wave-like trajectories coming from the northeast Asia and persist during the AR event. Further-more, saturation of parcels coming to the west coast of US during AR event frequently occurs over these source regions.
25
ACPD
11, 11109–11142, 2011Trajectory analysis on the origin of air mass and moisture
J.-M. Ryoo et al.
Title Page
Abstract Introduction
Conclusions References
Tables Figures
◭ ◮
◭ ◮
Back Close
Full Screen / Esc
Printer-friendly Version Interactive Discussion
Discussion
P
a
per
|
Dis
cussion
P
a
per
|
Discussion
P
a
per
|
Discussio
n
P
a
per
|
the ENSO cycle. Based on previous studies that extratropical high frequency waves are related to ENSO-related interannual variability (e.g., Matthew and Kiladis, 1999; Higgins et al., 2000; Waugh and Polvani, 2000), direct poleward transport of tropical moisture within an enhanced IWV band in the eastern Pacific is most likely to occur during the neutral ENSO phase and least likely during the warm phase. Waugh and 5
Polvani (2000) found fewer upper tropospheric Potential Vorticity (PV) intrusion events, (incursions of high frequency wave events occurring as a result of Rossby wave break-ing over the eastern Pacific) durbreak-ing the warm phases of ENSO. Their results strongly suggest that AR events may be closely related to PV intrusions from the upper tropo-sphere. Schneider et al. (2006) and Couhert et al. (2010) have proposed that moisture 10
transports are maintained by different processes through cross-isentropic moistening and drying, balanced by isentropic transport of water vapor. In particular, the eastern Pacific is the region where cross-isentropic subsidence and high frequency transient waves are dominant, especially in winter (i.e. the downward branch of the Hadley-Walker circulation in the tropics, the extratropical eddies in the midlatitudes). This 15
region also has relatively small static stability and strong temperature gradients due to mixing of air from the cold and warm sectors of extratropical cyclones. Therefore, the effect of upper level disturbances such as PV intrusions or unstable baroclinic transient eddies on ARs in the eastern Pacific and US coastal areas will likely be of importance. The relationship between intraseasonal (e.g. MJO) or interannual (e.g. ENSO) variabil-20
ity with AR is another topic that deserves further examination for coastal monitoring and prediction.
Acknowledgements. This work was supported by a grant from AIRS project. We give special
thanks Darryn Waugh and Jonathan Wright for providing the model and assisting with access to NCEP diabatic heating rate data. We thank Xianan Jiang for calculating diabatic heating rates
25
ACPD
11, 11109–11142, 2011Trajectory analysis on the origin of air mass and moisture
J.-M. Ryoo et al.
Title Page
Abstract Introduction
Conclusions References
Tables Figures
◭ ◮
◭ ◮
Back Close
Full Screen / Esc
Printer-friendly Version Interactive Discussion
Discussion
P
a
per
|
Dis
cussion
P
a
per
|
Discussion
P
a
per
|
Discussio
n
P
a
per
|
References
Bao, J.-W., Michelson, S. A., Neiman, P. J., Ralph, F. M., and Wilczak, J. M.: Interpretation of enhanced integrated water vapor bands associated with extratropical cyclones: their forma-tion and connecforma-tion to tropical moisture, Mon. Weather Rev., 134, 1063–1080, 2006. Cape, J. Methven, N. J., and Hudson, L. E.: The use of trajectory cluster analysis to interpret
5
trace gas measurements at Mace Head, Ireland, Atmos. Environ., 34, 3651–3663, 2000. Couhert, A., Schneider, T., Li, J., Waliser, D. E., and Tompkins, A. M.: The Maintenance of the
Relative Humidity of the Subtropical Free Troposphere, J. Climate, 23, 390–403, 2010. Dessler, A. E. and Minschwaner, K.: An analysis of the regulation of tropical tropospheric water
vapor, J. Geophys. Res., 112, D10120, doi:10.1029/2006JD007683, 2007.
10
Dessler, A. E. and Sherwood, S. C.: Simulations of tropical upper tropospheric humidity, J. Geophys. Res., 105, 20155–20163, 2000.
Dorling, S. R., Davies, T. D., and Pierce, C. E.: Cluster analysis: a technique for estimating the synoptic meteorological controls on air and precipitation chemistry – method and appli-cations, Atmos. Environ., 26A, 2575–2581, 1992.
15
Fernau, M. E. and Samson, P. J.: Use of cluster analysis to define periods of similar meteorol-ogy and precipitation chemistry in eastern Norht America. Part I: transport patterns, J. Appl. Meteorol., 29, 735–761, 1990.
Galewsky, J., Sobel, A., and Held, I.: Diagnosis of subtropical humidity dynamics using tracers of last saturation, J. Atmos. Sci., 62, 3353–3367, 2005.
20
Higgins, R. W., Schemm, J.-K. E., Shi, W., and Leetmaa, A.: Extreme precipitation events in the western United States related to tropical forcing, J. Climate, 13, 793–820, 2000.
Knippertz, P. and Wernli, H.: A lagrangian climatology of tropical moisture exports to the north-ern hemispheric extratropics, J. Climate, 23, 987–1003, 2010.
Matthew, A. J. and Kiladis, G. N.: Interactions between ENSO, transient circulation, and tropical
25
convection over the Pacific, J. Climate, 12, 3062–3086, 1999.
Neiman, P. J., Ralph, F. M., White, A. B., Kingsmill, D. E., and Persson, P. O. G.: The statistical relationship between upslope flow and rainfall in Californias coastal mountains: Observations during CALJET, Mon. Weather Rev., 130, 1468–1492, 2002.
Neiman, P. J., Ralph, F. M., White, A. B., Parrish, D. D., Holloway, J. S., and Bartels, D. L.:
30
ACPD
11, 11109–11142, 2011Trajectory analysis on the origin of air mass and moisture
J.-M. Ryoo et al.
Title Page
Abstract Introduction
Conclusions References
Tables Figures
◭ ◮
◭ ◮
Back Close
Full Screen / Esc
Printer-friendly Version Interactive Discussion
Discussion
P
a
per
|
Dis
cussion
P
a
per
|
Discussion
P
a
per
|
Discussio
n
P
a
per
|
Neiman, P. J., Ralph, F. M., Wick, G. A., Lundquist, J. D., and Dettinger, M. D.: Meteorological Characteristics and Overland Precipitation Impacts of Atmospheric Rivers Affecting the West Coast of North America Based on Eight Years of SSM/I Satellite Observations, J. Hydrome-teorol., 9, 22–47, 2008.
Park, H.-S., Chiang, J. C. H., and Son, S.-W.: The role of the central Asian mountains on the
5
midwinter suppression of north pacific storminess, J. Atmos. Sci., 67, 3706–3720, 2010. Pierrehumbert, R. T. and Roca, R.: Evidence for control of Atlantic subtropical humidity by large
scale advection, Geophys. Res. Lett., 25, 4537–4540, 1998.
Ralph, F. M., Neiman, P. J., and Wick, G. A.: Satellite and CALJET aircraft observations of atmospheric rivers over the eastern North Pacific Ocean during the El Nino winter of 1997/98,
10
Mon. Weather Rev., 132, 1721–1745, 2004.
Ralph, F. M., Neiman, P. J., Wick, G. A., Gutman, S. I., Dettinger, M. D., Cayan, D. R., and White, A. B.: Flooding on California’s Russian River: The role of atmospheric rivers, Geophys. Res. Lett., 33, L13801, doi:10.1029/2006GL026689, 2006.
Ralph, F. M., Neiman, P. J., Kiladis, G. N., and Weichmann, K.: A multi-scale observational
15
case study of a pacific atmospheric river exhibiting tropical-extrotropical connections and a mesoscale frontal wave, Mon. Weather Rev., doi:10.1175/2010MWR3596.1, accepted, 2010.
Ryoo, J.-M.: Controls on the upper tropospheric humidity, Ph. D. thesis, Johns Hopkins Univ., Baltimore, Maryland, USA, 194 pp., 2009.
20
Salathe Jr, E. P. and Hartman, D. L.: A trajectory analysis of tropical upper-tropospheric mois-ture and convection, J. Climate, 10, 2533–2547, 1997.
Schneider, T., Smith, K. L., O’Gorman, P. A., and Walker, C. C.: A climatology of tropospheric zonal-mean water vapor fields and fluxes in isentropic coordinates, J. Atmos. Sci., 63, 2992– 3005, 2006.
25
Schoeberl, M . R. and Sparling, L.: Trajectory modeling, in: Diagnostic Tools in Atmospheric Physics, edited by: Fiocco, G. and Visconti, G., Proc. Int. Sch. Phys. “Enrico Fermi,” 124, 289–306, 1995.
Sherwood, S. C.: Maintenance of the free-tropospheric tropical water vapor distribution. Part I: Clear regime budget, J. Climate, 9, 2903–2918, 1996.
30
Sherwood, S. C. and Meyer, C. L.: The general circulation and robust relative humidity, J. Climate, 19, 6278–6290, 2006.
ACPD
11, 11109–11142, 2011Trajectory analysis on the origin of air mass and moisture
J.-M. Ryoo et al.
Title Page
Abstract Introduction
Conclusions References
Tables Figures
◭ ◮
◭ ◮
Back Close
Full Screen / Esc
Printer-friendly Version Interactive Discussion
Discussion
P
a
per
|
Dis
cussion
P
a
per
|
Discussion
P
a
per
|
Discussio
n
P
a
per
|
on the Norwegian west coast at 60◦N – A tale of hurricanes and an atmospheric river, J. Geophys. Res., 113, D05102, doi:10.1029/2007JD009006, 2008.
Waugh, D. W. and Plumb, R. A.: Contour advection with surgery: a technique for investigating finescale structure in tracer transport, J. Atmos. Sci., 51, 530–540, 1994.
Waugh, D. W. and Polvani, L. M.: Intrusions into the tropical upper troposphere, Geophys. Res.
5
Lett., 27, 3857–3860, 2000.
Waugh, D. W.: Impact of potential vorticity intrusions on subtropical upper tropospheric humid-ity, J. Geophys. Res., 110, D11305, doi:10.1029/2004JD005664, 2005.
Wright, J. S., Sobel, A. H., and Schmidt, G. A.: Influence of condensate evaporation on water vapor and its stable isotopes in a GCM, Geophys. Res. Lett., 36, L12804,
10
doi:10.1029/2009GL038091, 2009.
Wright, J. S., Sobel, A., and Galewsky, J.: Diagnosis of Relative Humidity Changes in a warmer climate using tracers of last saturation, J. Climate, 23, 4556–4569, doi:10.1175/2010JCLI3488.1, 2010.
Wernli, H.: A Lagrangian-based analysis of extratropical cyclones. II. A detailed case study,
15
Quart. J. Roy. Meteor. Soc., 123, 1677–1706, 1997.
Yanai, M., Esbensen, S. S., and Chu, J.-H.: Determination of bulk properties of tropical cloud clusters from large-scale heat and moisture budgets, J. Atmos. Sci. 30, 611–627, 1973. Zhu, Y. and Newell, R. E.: Atmospheric rivers and bombs, Geophys. Res. Lett., 21, 1999–2002,
1994.
ACPD
11, 11109–11142, 2011Trajectory analysis on the origin of air mass and moisture
J.-M. Ryoo et al.
Title Page
Abstract Introduction
Conclusions References
Tables Figures
◭ ◮
◭ ◮
Back Close
Full Screen / Esc
Printer-friendly Version Interactive Discussion
Discussion
P
a
per
|
Dis
cussion
P
a
per
|
Discussion
P
a
per
|
Discussio
n
P
a
per
|
Fig. 2a.Longitude-latitude cross section of trajectories integrated on 300 K from the reference point (235–240◦E, 37–43◦N) during 3, 7, 14 days for the 16 February 2004 AR case. Panels
ACPD
11, 11109–11142, 2011Trajectory analysis on the origin of air mass and moisture
J.-M. Ryoo et al.
Title Page
Abstract Introduction
Conclusions References
Tables Figures
◭ ◮
◭ ◮
Back Close
Full Screen / Esc
Printer-friendly Version Interactive Discussion
Discussion
P
a
per
|
Dis
cussion
P
a
per
|
Discussion
P
a
per
|
Discussio
n
P
a
per
|
NCEP - GMAO MERRA NCEP - ECMWF interim GMAO MERRA - ECMWF interim average
latitude longitude pressure
reference point (39-43N, 239-243E)
(a) Corr (b) RMSE
ACPD
11, 11109–11142, 2011Trajectory analysis on the origin of air mass and moisture
J.-M. Ryoo et al.
Title Page
Abstract Introduction
Conclusions References
Tables Figures
◭ ◮
◭ ◮
Back Close
Full Screen / Esc
Printer-friendly Version Interactive Discussion
Discussion
P
a
per
|
Dis
cussion
P
a
per
|
Discussion
P
a
per
|
Discussio
n
P
a
per
|
Fig. 3.(Left) Longitude-latitude cross section of trajectories on 300 K from the reference region (235–245◦E, 37–43◦N, the same as in Fig. 2 but 5◦E wider) and (right) the vertical evolution of trajectories during 14 days for the 30 December 2005 AR case, respectively. Panels (a),
ACPD
11, 11109–11142, 2011Trajectory analysis on the origin of air mass and moisture
J.-M. Ryoo et al.
Title Page
Abstract Introduction
Conclusions References
Tables Figures
◭ ◮
◭ ◮
Back Close
Full Screen / Esc
Printer-friendly Version Interactive Discussion
Discussion
P
a
per
|
Dis
cussion
P
a
per
|
Discussion
P
a
per
|
Discussio
n
P
a
per
|
16N 20N 24N 28N 32N 36N 40N 44N Latitude (degrees)
300K 305K 310K 315K 320K 325K 330K 335K
Potential Temperature (K)
16N 20N 24N 28N 32N 36N 40N 44N Latitude (degrees)
300K 305K 310K 315K 320K 325K 330K 335K
Potential Temperature (K)
16N 20N 24N 28N 32N 36N 40N 44N Latitude (degrees)
300K 305K 310K 315K 320K 325K 330K 335K
Potential Temperature (K)
16N 20N 24N 28N 32N 36N 40N 44N Latitude (degrees)
300K 305K 310K 315K 320K 325K 330K 335K
Potential Temperature (K)
(a) Traj h2o (MERRA)
(c) GMAO MERRA h2o
(b) Traj h2o (ECMWF)
(d) ECMWF ERA-Interim h2o