Sea ice melt pond fraction estimation from dual-polarisation C-band SAR – Part 2: Scaling in situ to Radarsat-2
Texto
Imagem
Documentos relacionados
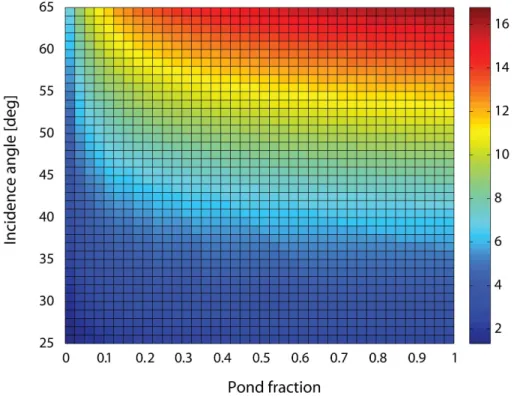
In model simulations we investigated the sensitivity of the CP ratio to the dielectric constant, ice thickness, ice surface roughness, and radar incidence angle.. From the results
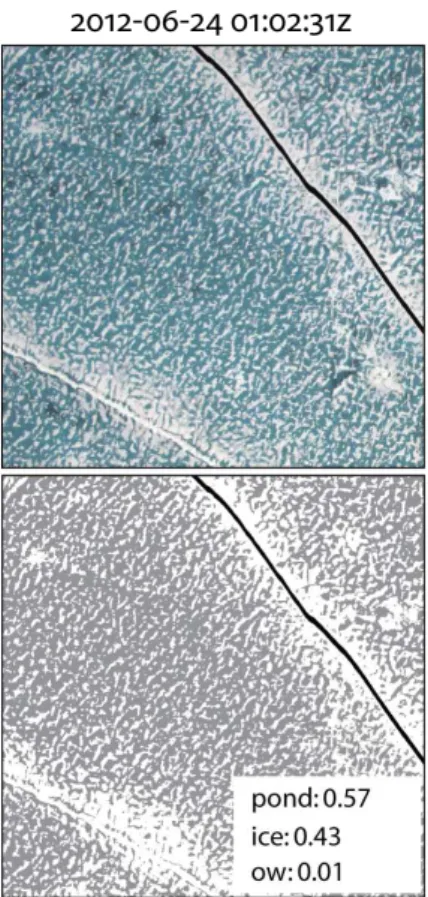
Their experimental alternatives can be calculated from the SAR intensity imagery directly, then the parameters of the mixture model are estimated through fitting the
Trends in the time series of annual mean MO dates indicate that MO is occurring earlier in the year for the majority of Arctic sea ice over the 1979–2012 data record
To investigate the influence of snow depth, sea ice density, and area on sea ice thick- ness and volume estimates we use freeboard retrievals from ICESat, together with dif-
The NWP data is received from the ECMWF model; the SAR data is the RADARSAT data from CIS; and the linear mapping coefficients ( a and b ), used in the final ice thickness
L-band SAR showed less contrast be- tween floating and grounded lake ice than C-band; however, since L-band is sensitive to ebullition bubbles trapped by lake ice (bubbles
Classifica- tion results for C-band simulated radar data using previous S-band MBFs are reported in Table 1, while the contingency table for C-band data, when new MBFs C-band
The validation of the MODIS melt pond data set was conducted with aerial photos from the MELTEX campaign 2008 in the Beaufort Sea, data sets from the National Snow and Ice Data
