Anthropometric indexes of overweight and obesity as predictors of
lipid changes in adolescents
Indicadores antropométricos de sobrepeso e obesidade como preditores de alterações lipídicas em adolescentes
Indicadores antropométricos de sobrepeso y obesidad como predictores de alteraciones lipídicas en adolescentes
Carmem Cristina Beck1, Adair da Silva Lopes2, Francisco José G. Pitanga3
Instituição: Universidade Federal de Santa Catarina (UFSC), Florianópolis, SC, Brasil
1Mestre em Educação Física pela UFSC; Professora de Educação Física do Instituto Federal de Educação, Ciência e Tecnologia de Santa Catarina, Florianópolis, SC, Brasil
2Doutor em Educação Física pela Universidade Federal de Santa Maria (UFSM); Professor Titular do Centro de Desporto da UFSC, Florianópolis, SC, Brasil
3Doutor em Saúde Pública; Professor Adjunto do Departamento de Educa-ção da Universidade Federal da Bahia (UFBA), Salvador, BA, Brasil ABSTRACT
Objective: To identify the power of overweight and obesity anthropometric indexes to predict lipid changes in adolescents.
Methods: A cross-sectional study was carried out with 660 adolescents aged 14 to 19 years old (317 males; 343 females). The following anthropometric indexes were studied: body mass index (BMI), waist circumference, waist-to-height ratio, and conicity index. The lipid changes were characterized by total cholesterol (TC) higher than 170mg/dL and high-density lipoproteins (HDL-C) under 45mg/dL. In order to identify the predictors of lipid changes, the analysis of Receiver Operating Characteristics curves (ROC) was used. The cutoff values were identiied with their respective sensitivities and speciicities. Then, the prevalence ratio was calculated between anthropo-metric indicators and investigated outcomes.
Results: The areas under the ROC curves (95% con-idence interval) for high TC in boys and their respective cutoff values were: BMI of 0.74 (0.65-0.83), 21.7kg/m²; waist circumference of 0.73 (0.65-0.82), 74cm; waist-to-height ratio of 0.72 (0.63-0.81) and 0.4; conicity index of 0.60 (0.50-0.69), 1.1. The areas under the ROC curves (95% conidence interval) for low levels of HDL-C and their
respec-tive cutoff values were: BMI for boys of 0.58 (0.52-0.64) and 20.7kg/m²; for the girls of 0.61 (0.53-0.69), 20.8kg/ m²; waist circumference, boys with 0.57 (0.50-0.63) and 73.3cm, girls with 0.63 (0.55-0.72) and 71.5cm; waist-to-height (W/H) ratio, boys of 0.58 (0.52-0.65) and W/H of 0.4; girls with 0.62 (0.54-0.70) and W/H of 0.4; and the conicity index, for girls, 0.60 (0.51-0.68) and 1.1.
Conclusions: The anthropometric indexes were good predictors of high TC for boys, and reasonable for low levels of high-density lipoproteins for boys and girls.
Key-words: cholesterol; obesity; adolescents; anthro-pometry.
RESUMO
Objetivo: Identiicar o poder preditivo dos indicadores antropométricos de sobrepeso e obesidade para alterações lipídicas em adolescentes.
Métodos: Estudo transversal envolvendo 660 adolescentes de 14 a 19 anos (317 rapazes; 343 moças). Foram considera-dos os seguintes indicadores antropométricos: índice de mas-sa corpórea (IMC), circunferência da cintura, razão cintura/ estatura e índice de conicidade. As alterações lipídicas foram
Endereço para correspondência: Carmem Cristina Beck
Rua Sebastião Luarentino da Silva, 126 – apto. 813 – Córrego Grande CEP 88037-400 – Florianópolis/SC
E-mail: [email protected]
Fonte financiadora: CCB recebeu bolsa da Coordenação de Aperfeiço-amento de Pessoal de Nível Superior (CAPES). O presente estudo não contou com fonte financiadora (agência de fomento), apenas firmou-se uma parceria com a Secretaria Municipal de Saúde de Três de Maio, RS, (2006) para o levantamento das informações.
Conflito de interesse: nada a declarar
caracterizadas pelo colesterol total (CT) superior a 170mg/dL e lipoproteínas de alta densidade (HDL-C) inferiores a 45mg/ dL. Para identiicar os preditores das alterações lipídicas, adotou-se a análise das curvas Receiver Operating Characteris-tics (ROC). Foram calculados os pontos de corte com suas respectivas sensibilidades e especiicidades e, posteriormente, as razões de prevalência entre os indicadores antropométricos e os desfechos investigados.
Resultados: As áreas sob as curvas ROC (intervalo de coniança de 95%) para CT elevado nos rapazes e respectivos pontos de corte foram: IMC de 0,74 (0,65-0,83) e 21,7kg/ m²; circunferência de cintura de 0,73 (0,65-0,82) e 74cm; razão cintura/estatura de 0,72 (0,63-0,81) e 0,4; índice de conicidade de 0,60 (0,50-0,69) e 1,1. Para a predição dos baixos níveis de HDL-C, as áreas da curva ROC e os pontos de corte foram: IMC dos rapazes de 0,58 (0,52-0,64) e 20,7kg/ m²; para as moças de 0,61 (0,53-0,69) e 20,8kg/m²; circun-ferência de cintura, rapazes com 0,57 (0,50-0,63) e 73,3cm, moças com 0,63 (0,55-0,72) e 71,5cm; razão cintura/estatura (C/Est), rapazes de 0,58 (0,52-0,65) e C/Est de 0,4, moças de 0,62 (0,54-0,70) e C/Est de 0,4; índice de conicidade, moças de 0,60 (0,51-0,68) e 1,1.
Conclusões: Os indicadores antropométricos foram bons preditores de CT elevado nos rapazes e razoáveis para os baixos níveis de HDL-C para rapazes e moças.
Palavras-chaves: colesterol; obesidade; adolescentes; antropometria.
RESUMEN
Objetivo: Identiicar el poder predictivo de los indicado-res antropométricos de sobrepeso y obesidad para alteraciones lipídicas en adolescentes.
Métodos: Estudio transversal implicando a 660 adoles-centes de 14 a 19 años (317 muchachos; 343 muchachas). Se consideraron los siguientes indicadores antropométricos: índice de masa corpórea (IMC), circunferencia de la cintura, razón cintura/estatura e índice de conicidad. Las alteraciones lipídicas fueron caracterizadas por el colesterol total (CT) su-perior a 170mg/dLy lipoproteínas de alta densidad (HDL-C) inferiores a 45mg/dL. Para identiicar los predictores de las alteraciones lipídicas fue adoptado el análisis de las curvas
receiver operating characteristic (ROC). Se calcularon los puntos de corte con sus respectivas sensibilidades y especiicidades y, posteriormente, las razones de prevalencia entre los indi-cadores antropométricos y los desfechos investigados.
Resultados: Las áreas bajo las curvas ROC (intervalo de conianza de 95%) para CT elevado en los muchachos y respectivos puntos de corte fueron: IMC 0,74 (0,65-0,83) y 21,7kg/m²; circunferencia de cintura 0,73 (0,65-0,82) y 74 cm; razón cintura/estatura 0,72 (0,63-0,81) y 0,4; índice de conicidad 0,60 (0,50-0,69) y 1,1. Para la predicción de bajos niveles de HDL-C, las áreas de la curva ROC y los puntos de corte fueron: IMC, muchachos 0,58 (0,52-0,64) y 20,7kg/m², muchachas 0,61 (0,53-0,69) y 20,8kg/m²; circunferencia de cintura, muchachos 0,57 (0,50-0,63) y 73,3 cm, muchachas 0,63 (0,55-0,72) y 71,5 cm; razón cintura/estatura, mucha-chos 0,58 (0,52-0,65) y 0,4 muchachas 0,62 (0,54-0,70) y 0,4; índice de conicidad, muchachas 0,60 (0,51-0,68) y 1,1. Conclusiones: Los indicadores antropométricos fueron buenos predictores de colesterol total elevado en los mu-chachos y razonables para bajos niveles de HDL-C para muchachos y muchachas.
Palabras-clave: colesterol; obesidad; predicción; adoles-centes; factor de riesgo; antropometría.
Introduction
Overweight and obesity are severe public health problems in many different countries around the world. Their preva-lence has increased consistently over recent decades both among adults and among children and adolescents(1,2). In
Brazil, the prevalence of overweight (overweight and obe-sity combined) in children and adolescents is increasing(3,4).
This is something that should be monitored with attention, since overweight at this stage of life can trigger patterns of obesity in adulthood.
Several different anthropometric indicators have been employed to identify overweight and obesity in children and adolescents. Body mass index (BMI), which is widely used in epidemiological studies, indicates fat in general, whereas waist circumference (WC) and the conicity index (C index) identify fat located in the central part of the body. The waist-height ratio (WHR) illustrates the proportion of centralized fat as a function of a person’s height. All of these indicators have been tested with success as predictors of the principal cardiovascular risk factors in pediatric populations(5-7).
in many other parts of the world(8-10), but in this population
there is no routine screening and control for these unhealthy changes using laboratory tests.
Considering that anthropometric indicators of overweight and obesity have demonstrated discriminatory power for predicting lipid abnormalities in adolescents and also that they are inexpensive, relatively simple and are easy to ad-minister and interpret for this type of diagnosis, there is a clear need for studies with the Brazilian pediatric popula-tion to analyze the predictive power of these indicators for identifying unhealthy changes to variables that are part of the lipid proile. This, in turn, would facilitate diagnosis and treatment, providing an opportunity for preventing the abnormalities detected in adolescence from being carried over into adulthood. In this way, an emphasis on preven-tion could guide public health strategies for the pediatric population. The objective of this study was to identify the predictive power, and ideal cutoff points, of anthropometric indicators of overweight and obesity for lipid abnormalities in adolescents.
Methods
This study is part of a schools-based epidemiological sur-vey entitled “Risk factors for atherosclerosis in adolescents”. The project was approved by the Human Research Ethics Committee at the Universidade Federal de Santa Catarina and data were collected in June and July of 2006.
The study was conducted in the town of Três de Maio, RS, Brazil, which is in the Northwest of the State of Rio Grande do Sul, part of the Santa Rosa microregion, at a distance of 475 kilometers from the state capital Porto Alegre. The town has an estimated population of 24,333 inhabitants (IBGE, 2007)(11). The population is predominantly made
up of the descendents of German, Italian and Polish settlers and there has been extensive intermixing between them. The municipality has an area of 424.2 km², the economy is basically primary and the Human Development Index is elevated (HDI=0.83)(12).
The study population (n=1642) comprised all adolescents in the town of Três de Maio, who were aged 14 to 19 years at the time of data collection and were enrolled in primary education, secondary education or technical college, whether public or private in 2006. The sample was probabilistic, stratiied, proportional for sex and economic status, and was based on the following parameters: 95% conidence interval and tolerable sampling error of three percentage points.
Selection was systematic, on the basis of two lists, one per sex, in alphabetical order. The sampling scheme deined the following conditions as losses to the sample: absence from lessons (2 consecutive days), pregnancy, nonparticipation in the two data collection stages, school transfer or truancy. The inal sample comprised 660 adolescents (317 boys; 343 girls) with a total of 2.8% losses and 6% refusals.
A pilot study was conducted in order to train the data collection team and to choose the best design in terms of lo-gistics. All anthropometric measurements were taken twice, during the morning, by the lead researcher and recorded by a single assistant, according to predeined standards.
Participants were weighed and measured wearing light clothing and unshod, according to standardized procedures(13)
and using a Filizola® mechanical balance with a built-in
stadiometer that had been calibrated by the Rio Grande do Sul branch of the Brazilian weights and measures authority (INMETRO-RS). Body mass index was calculated on the basis of these results [BMI= body mass (kg) /height (m2)].
Waist circumference (WC) was measured using a iber-glass anthropometric tape (Mabis brand) at the midpoint between the last rib and the iliac crest, taking the average(14).
Waist-height ratio (WHR) was calculated by dividing waist circumference (cm) by height (cm). Conicity index (C index) was calculated from weight, height and waist circumference, using the following equation(15):
C index= Waist Circumference (m)
Body Weight (kg) Height (m) 0.109
√
Total cholesterol (TC) and high-density lipoproteins (HDL-C) were analyzed in blood collected by the biochemist responsible for testing at the participants’ schools. A 5 mL venous blood sample was taken from the elbow fold after 10 to 12 hours’ fasting. Total cholesterol was assayed using an enzymatic method (Chod-pap) and HDL-C with a direct method, using reagents and instruments from a single batch (BioSystems®, Barcelona, Spain). The cutoff points used to
deine lipid proile abnormalities were based on the Brazilian Directive on the Prevention of Atherosclerosis in Childhood and Adolescence (TC≥170mg/dL and HDL-C<45mg/dL)(16).
The study variables were analyzed by sex using Student’s
(ROC) curves, which are used to determine cutoff points for diagnostic and screening tests(17). Initially, the total area
under the ROC curve (AUC-ROC) was determined for the anthropometric indicators (BMI, WC, WHR and C index) against lipid abnormalities (elevated TC and low HDL-C). The greater the AUC-ROC, the greater the discriminatory power of the anthropometric indicators for elevated TC and low HDL-C. The conidence interval (CI) demonstrates whether the predictive capacity of an anthropometric indica-tor could be due to chance and the lower limit must not be below 0.50(18). A conidence interval (CI) of 95% was adopted
for this study. The chi-square test was used to identify the differences between AUC-ROCs. Cutoff points were then identiied for those anthropometric indicators with signii-cant AUC-ROCs and their sensitivity and speciicity were calculated. The criterion for choosing the cutoff points for the anthropometric indicators as predictors of lipid abnor-malities was the point at which the best balance between sensitivity and speciicity was achieved.
After the cutoff points had been set for the anthropometric variables predictive of lipid abnormalities, BMI, WC, WHR
and the C index were categorized using these cutoff points and prevalence ratios (PR) were calculated for the anthro-pometric indicators (with the reference category for each anthropometric indicator being its category of normality) against TC and HDL-C abnormalities, with a conidence interval (CI) of 95%.
Data were input to a Microsoft Ofice Excel© version 2003 spreadsheet and analyzed using “STATA”, version 7.0.
Results
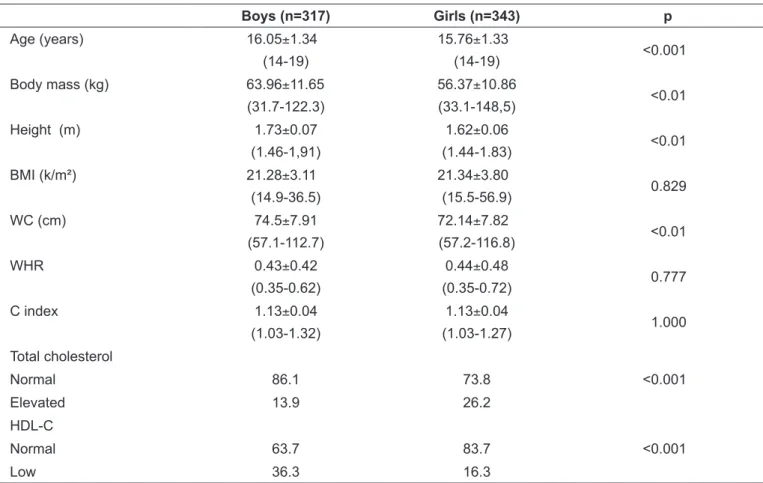
Table 1 lists the characteristics of the sample. The mean age of the boys was greater than that of the girls (p<0.001). Body mass, height and WC measurements were all greater for the boys (p<0.01). The prevalence of elevated total cholesterol was greater among the girls (p<0.001), while low HDL-C was more common among the boys (p<0.001).
Table 2 shows the AUC-ROCs for BMI, WC, WHR and C index as predictors of elevated TC and low HDL-C in boys and girls. It will be noted that the anthropometric indica-tors BMI, WC and WHR exhibited the greatest capacity
Table 1 - Demographic and anthropometric characteristics as mean, standard deviation, minimum-maximum range and percentages.
Boys (n=317) Girls (n=343) p
Age (years) 16.05±1.34
(14-19)
15.76±1.33
(14-19) <0.001
Body mass (kg) 63.96±11.65 (31.7-122.3)
56.37±10.86
(33.1-148,5) <0.01
Height (m) 1.73±0.07
(1.46-1,91)
1.62±0.06
(1.44-1.83) <0.01
BMI (k/m²) 21.28±3.11 (14.9-36.5)
21.34±3.80
(15.5-56.9) 0.829
WC (cm) 74.5±7.91
(57.1-112.7)
72.14±7.82
(57.2-116.8) <0.01
WHR 0.43±0.42
(0.35-0.62)
0.44±0.48
(0.35-0.72) 0.777
C index 1.13±0.04
(1.03-1.32)
1.13±0.04
(1.03-1.27) 1.000
Total cholesterol
Normal 86.1 73.8 <0.001
Elevated 13.9 26.2
HDL-C
Normal 63.7 83.7 <0.001
Low 36.3 16.3
Table 2 - Area under the ROC curve and 95%CI for anthropometric indicators against elevated total cholesterol and low HDL-C for boys and girls.
Elevated total cholesterol Area under the ROC curve (95%CI)
Boys p Girls p
BMI (kg/m²) 0.74 (0.65-0.83)* 0.51 (0.44-0.58)
WC (cm) 0.73 (0.65-0.82)* 0.49 (0.42-0.55)
WHR 0.72 (0.63-0.81)* 0.50 (0.43-0.57)
C index 0.60 (0.50-0.69)* 0.0010 0.47 (0.40-0.54) 0.6530
Low HDL-C Area under the ROC curve (95%CI)
Boys Girls
BMI (kg/m²) 0.58 (0.52-0.64)* 0.61 (0.53-0.69)* WC (cm) 0.57 (0.50-0.63)* 0.63 (0.55-0.72)* WHR 0.58 (0.52-0.65)* 0.62 (0.54-0.70)*
C index 0.53 (0.47-0.60) 0.3287 0.60 (0.51-0.68)* 0.0384
HDL-C: high-density lipoprotein; BMI: body mass index; WC: waist circumference; WHR: waist-height ratio; C index: conicity index; ROC: receiver
operating characteristic; 95%CI: 95% conidence interval. * Area under the ROC curve indicating discriminatory power for elevated total cholesterol
and low HDL-C (CI lower limit ≥0.50).
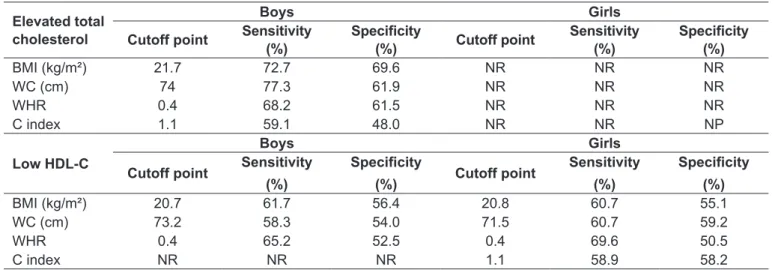
Table 3 - Cutoff points, sensitivity and speciicity for anthropometric indicators as predictive of lipid proile abnormalities for boys and girls.
Elevated total cholesterol
Boys Girls
Cutoff point Sensitivity (%)
Speciicity
(%) Cutoff point
Sensitivity (%)
Speciicity
(%)
BMI (kg/m²) 21.7 72.7 69.6 NR NR NR
WC (cm) 74 77.3 61.9 NR NR NR
WHR 0.4 68.2 61.5 NR NR NR
C index 1.1 59.1 48.0 NR NR NP
Low HDL-C
Boys Girls
Cutoff point Sensitivity (%)
Speciicity
(%) Cutoff point
Sensitivity (%)
Speciicity
(%)
BMI (kg/m²) 20.7 61.7 56.4 20.8 60.7 55.1
WC (cm) 73.2 58.3 54.0 71.5 60.7 59.2
WHR 0.4 65.2 52.5 0.4 69.6 50.5
C index NR NR NR 1.1 58.9 58.2
HDL-C= high-density lipoprotein; BMI= body mass index; WC= waist circumference; WHR= waist-height ratio (stature); C index= conicity index; NR = indicator is not recommended for predicting elevated total cholesterol or low HDL-C (see lower CI limit < 0.50 in Table 2).
Table 4 - Prevalence ratios (PR) and conidence intervals (95%CI) for anthropometric indicators against elevated total cholesterol and low HDL-C.
Predictive variables Elevated total cholesterol low HDL-C
Boys Girls Boys Girls
BMI (kg/m²) 4.6 (2.5-8.6) * 1.6 (1.2-2.2) 1.7 (1.0-2.8) WC (cm) 4.0 (2.1-7.7) * 1.4 (1.0-1.8) 1.8 (1.1-3.0) WHR 2.7 (1.5-4.9) * 1.6 (1.2-2.2) 2.0 (1.2-3.4)
C index 1.2 (0.7-2.2) * 8 1.8 (1.1-2.9)
HDL-C: high-density lipoprotein; BMI: body mass index; WC: waist circumference; WHR: Waist-height ratio; C index: conicity index;
to predict elevated TC in boys, with no difference between their AUC-ROCs (p=0.485). With relation to the girls, none of the anthropometric indicators was capable of predicting elevated TC. With regard to low HDL-C, the AUC-ROCs for the anthropometric indicators were all signiicant for both sexes, with the exception of the C index for boys.
The best-balanced values of sensitivity and speciicity, together with their cutoff points, are presented for all of the anthropometric indicators as predictors of elevated TC and low HDL-C. It will be noted that, BMI, WC and WHR, in that order, offered the best sensitivity and speciicity for predicting elevated TC in boys. The cutoff points for the anthropometric indicators that were chosen to predict low HDL-C offer reasonable sensitivity and speciicity for both sexes (Table 3).
Table 4 lists the prevalence ratios for the anthropometric indicators against lipid abnormalities (elevated TC and low HDL-C) for both sexes. The cutoff points, for BMI, WC, WHR and the C index deined above (Table 3) were used to categorize the anthropometric variables for this analysis. Boys with BMI greater than 21.7kg/m² or WC larger than 74 cm exhibited around a four times greater likeli-hood of elevated TC than those with smaller BMI or WC. With relation to WHR and the C index, boys with these anthropometric indicators above the cutoff points deined in this study had 2.7 and 1.2 times greater chance of elevated cholesterol respectively (Table 4).
With regard to HDL-C, boys with BMI, WC and WHR above the cutoff points deined here (20.7kg/m², 73.2cm and 0.4, respectively) had approximately 1.5 greater probability of low HDL-C, while the girls with BMI, WC, WHR and C index over the cutoff points (20.8kg/m², 71.5cm, 0.4 and 1.1, respectively) had approximately twice the chance of low HDL-C. The C index did not exhibit an association with low HDL-C among the boys (Table 4).
Discussion
For this study, we chose to conduct an analysis of anthro-pometric indicators of overweight and obesity as predictors of lipid abnormalities, for boys and girls separately, because lipids behave differently between sexes. These differences are primarily the result of endogenous sex hormones. After maturity, TC and HDL-C levels are higher among females, with a positive association between estradiol and HDL-C(19),
whereas among males reductions in HDL-C appear to hold a negative association with testosterone levels.
Among the limitations to this study, the selection bias that school-based studies can introduce cannot be ruled out. In this study, adolescents who were not attending school and those who were out of phase with the normal age-to-grade relationship were not included. Furthermore, the restricted age group, which did not include adolescents younger than 14, prevented a wider survey of lipid abnormalities. Another possible limitation of this study lies in the fact that lipid ab-normalities were represented by TC and HDL-C only, which is because data had not been collected on triglycerides, which in turn would have made it possible to calculate low-density lipoproteins (LDL-C), complementing the illustration of these adolescents’ lipid proile. However, the variables TC and HDL-C are a good illustration of lipid abnormalities in studies with pediatric populations.
In general, among the available anthropometric indica-tors, BMI, WC and WHR were better at discriminating lipid abnormalities in these adolescents. Nevertheless, it was only possible to identify anthropometric indicators with good AUC-ROCs predictive of high TC for the boys. The predictive power of the anthropometric indicators for low HDL-C was reasonable for both sexes.
In this study no differences were observed between the AUC-ROCs for those anthropometric variables that were sig-niicant for predicting lipid abnormalities, either for males or females. A different study, conducted in Niterói, Rio de Janeiro, Brazil, concluded that BMI was not a good indica-tor for discriminating abnormalities in the lipid proiles of adolescents(20). In Iran(5), an investigation of anthropometric
indicators as predictors of cardiovascular risk factors sug-gested that WC and WHR should be used in conjunction with BMI for detecting young people at cardiovascular risk. In a population of non-Hispanic, white, American adoles-cents(21), BMI and WC had good AUC-ROCs for prediction
of three or more risk factors together (HDL-C, LDL-C, tri-glycerides, glucose and insulin levels, systolic and diastolic blood pressure).
In the study described here the cutoff points with the best equilibrium between sensitivity and speciicity were identiied for anthropometric variables predictive of two outcomes: el-evated TC and low HDL-C (Table 2). The BMI cutoffs identi-ied, both for elevated TC and for low HDL-C, were lower than cutoff points that have been proposed by other authors(6,22,23)
References
1. Budd GM, Hayman LL. Childhood obesity: determinants, prevention, and treatment. J Cardiovasc Nurs 2006;21:437-41.
2. Kumanyika SK, Obarzanek E, Stettler N, Bell R, Field AE, Fortmann SP
et al. Population-based prevention of obesity: the need for comprehensive
promotion of healthful eating. Physical activity, and energy balance: a scientiic
statement from American Heart Association Council on Epidemiology and Prevention, Interdisciplinary Committee for Prevention (formerly the expert panel on population and prevention science). Circulation 2008;118:428-64.
m² and 20.4 kg/m², respectively). With relation to predicting low HDL-C, the cutoff point for BMI for boys deined here was greater than that determined for Iranian boys (20 kg/m²)
(5). The BMI cutoff point deined here for girls was lower than
that set for Iranian girls (23.1 kg/m²)(5). These data, in general,
suggest that lipid abnormalities can be present in people who are not overweight and may be caused by behavioral factors, such as a diet rich in fat and little physical activity.
The WC cutoff point for detecting elevated TC in boys was similar to that found in Iran (74.5cm), whereas the WC measurement for identifying low HDL-C in boys and girls was greater than that found in the same study (69.5cm and 68.5cm, respectively)(5). In general, the WC cutoff points
defuined for detecting lipid abnormalities in the boys were below the 75th percentile for adolescents in Canada, the United States of America and Australia(24-26). However, the
cutoffs for girls were close to the 75th percentile for WC in Canadian adolescents(24) and below the 75th percentile for
American(25) and Australian(26) adolescents.
There has been an increase in the number of research studies using WHR to detect cardiovascular risk factors, whether in adults or in children and adolescents(5,7,27). In this
study, the same cutoff point (0.4) was deined for boys and girls. In an Italian pediatric population, high sensitivity and speciicity were demonstrated using a WHR cutoff point of 0.5 for detecting at least two metabolic or cardiovascular risk factors(7). In Iran, the cutoff point for elevated TC was
the same as that deined in this study and the low HDL-C cutoff point was 0.3 for boys and 0.45 for girls(5).The C index
was predictive of elevated TC in the boys and low HDL-C in the girls, with a cutoff point of 1.1. A study conducted in Taguatinga, DF(28), with a younger age group than this
study, found a cutoff point of 1.2 for insulin resistance. For the boys, with the exception of the C index for elevated TC, and WC for low HDL-C, all of the anthropometric indi-cators were associated with lipid abnormalities (Table 4). Of
particular note is the around four times greater probability of elevated TC among those with BMI over 21.7kg/m² and/or WC over 74 cm. The association between BMI and low HDL-C was not observed for the girls, but WC, WHR and C index values over the cutoff points deined in this study had approximately two times greater chance of being associated with low HDL-C. Identifying lipid abnormalities in pediatric populations is not a routine procedure in clinical practice, with the excep-tion of certain speciic indicaexcep-tions (obesity, HIV+, diabetes). Additionally the reduced frequency of routine medical consultations, particularly during adolescence, reduces the chances of early detection of changes to the lipid proile. Failure to diagnosis, control and treat lipid abnormalities may prove to be a barrier to preventing atherogenesis and future cardiovascular events.
On the basis of the results found in this study, it was pos-sible to determine the accuracy of anthropometric indicators for predicting elevated TC and low HDL-C, which allows, through the use of simple methods, screening for these cardiovascular risk factors, providing a basis for planning of early intervention, both in clinical practice and teaching institutions, through encouragement of the adoption of healthy habits. Considering that the best AUC-ROCs were for BMI, WC and WHR for predicting elevated TC among boys, and for the same anthropometric indicators as predic-tors of low HDL-C for boys and girls, it is suggested that these indicators be used, with the cutoff points proposed here, when screening for lipid abnormalities in adolescents with characteristics similar to the sample studied here.
Acknowledgements
We are grateful to the Municipal Health Department of Três de Maio, RS, for support in conducting this study and to the Coordenação de Aperfeiçoamento de Pessoal de Nível Superior(CAPES) for a bursary awarded to the lead author.
3. Cesar JA, Mendoza-Sassi R, Horta BL, Ribeiro PR, D’Avila AC, Santos FM et al. Basic indicators of child health in an urban area in southern Brazil: estimating prevalence rates and evaluating differentials. J Pediatr (Rio J) 2006;82:437-44.
4. Mondini L, Levy RB, Saldiva SR, Venâncio SI, de Azevedo Aguiar J, Stefanini
ML. Overweight, obesity and associated factors in irst grade schoolchildren
5. Kelishadi R, Gheiratmand R, Ardalan G, Adeli K, Mehdi Gouya M, Mohammad Razaghi E et al. Association of anthropometric indices with cardiovascular disease risk factors among children and adolescents: CASPIAN Study. Int J Cardiol 2007;117:340-8.
6. Katzmarzyk PT, Srinivasan SR, Chen W, Malina RM, Bouchard C, Berenson GS. Body mass index, waist circumference, and clustering of cardiovascular risk factors in a biracial sample of children and adolescents. Pediatrics 2004;114:e198-205.
7. Maffeis C, Banzato C, Talamini G; Obesity Study Group of the Italian Society of Pediatric Endocrinology and Diabetology. Waist-to-height ratio, a useful index to identify high metabolic risk in overweight children. J Pediatr 2008;152:207-13.
8. Guedes DP, Guedes JE, Barbosa DS, Oliveira JA, Stanganelli LC. Fatores de risco cardiovasculares em adolescentes: indicadores biológicos e comportamentais. Arq Bras Cardiol 2006;86:439-50.
9. Giuliano IC, Coutinho MS, Freitas SF, Pires MM, Zunino JN, Ribeiro RQ. Lípides séricos em crianças e adolescentes de Florianópolis, SC - Estudo Floripa Saudável 2040. Arq Bras Cardiol 2005;85:85-91.
10. Brotons C, Ribera A, Perich RM, Abrodos D, Magaña P, Pablo S et al. Worldwide distribution of blood lipids and lipoproteins in childhood and adolescence: a review study. Atherosclerosis 1998;139:1-9.
11. Instituto Brasileiro de Geografia e Estatística (IBGE) [homepage on the Internet]. IBGE @Cidades [cited 2009 Mar 27]. Available from: http://www. ibge.gov.br/cidadesat/topwindow.htm?1.
12. UNDP [homepage on the Internet]. Novo atlas do desenvolvimento humano no Brasil (IDH-M) [cited 2009 Mar 5]. Available from: http://www.dhnet. org.br/dados/idh/idh/idh_estados_br.pdf
13. Alvarez BR, Pavan AL. Alturas e comprimentos. In: Petroski EL. Antropometria: técnicas e padronizações. Santa Maria: Pallotti; 2005. p. 31-58.
14. Callaway CW, Chumlea WC, Bouchard C, Himes JH, Lohman TG, Martin AD et al. Circumferences. In: Lohman TG, Roche AF, Matorell R. Anthropometric standardization reference manual. Champaign: Human Kinetics Books; 1988. p. 39-53.
15. Valdez R. A simple model-based index of abdominal adiposity. J Clin Epidemiol 1991;44: 955-6.
16. Giuliano IC, Caramelli B, Pellanda L, Duncan B, Mattos S, Fonseca FH; Sociedade Brasileira de Cardiologia. I Diretriz de Prevenção
da Aterosclerose na Infância e na Adolescência. Arq Bras Cardiol 2005;85(Suppl VI):1-36.
17. Erdreich LS, Lee ET. Use of relative operating characteristic analysis in epidemiology. A method for dealing with subjective judgment. Am J Epidemiol 1981;114:649-62.
18. Schisterman EF, Faraggi D, Reiser B, Trevisan M. Statistical inference for the area under the receiver operating characteristic curve in the presence of random measurement error. Am J Epidemiol 2001;154:174-9. 19. Kwiterovich Jr PO, Barton BA, McMahon RP, Obarzanek E, Hunsberger
S, Simons-Morton D et al. Effects of diet and sexual maturation on low-density lipoprotein cholesterol during puberty: the Dietary Intervention Study in Children (DISC). Circulation 1997;96:2526-33.
20. Vieira AC, Alvarez MM, Kanaan S, Sichieri R, Veiga GV. Body mass index for predicting hyperglycemia and serum lipid changes in Brazilian adolescents. Rev Saude Publica 2009;43:44-52.
21. Messiah SE, Arheart KL, Lipshultz SE, Miller TL. Body mass index, waist circumference, and cardiovascular risk factors in adolescents. J Pediatr 2008;153:845-50.
22. Cole TJ, Bellizzi MC, Flegal KM, Dietz WH. Establishing a standard definition for child overweight and obesity worldwide: international survey. BMJ 2000;320:1240-3.
23. Conde WL, Monteiro CA. Valores críticos do índice de massa corporal para classificação do estado nutricional de crianças e adolescentes brasileiros. J Pediatr (Rio J) 2006;82:266-72.
24. Katzmarzyk PT. Waist circumference percentiles for Canadian youth 11-18y of age. Eur J Clin Nutr 2004;58:1011-5.
25. Fernández JR, Redden DT, Pietrobelli A, Allison DB. Waist circumference percentiles in nationally representative samples of African-American, European-American, and Mexican-American children and adolescents. J Pediatr 2004;145:439-44.
26. Eisenmann JC. Waist circumference percentiles for 7- to 15-year-old Australian children. Acta Paediatr 2005;94:1182-5.
27. Pitanga FJ, Lessa I. Razão cintura-estatura como discriminador do risco coronariano de adultos. Rev Assoc Med Bras 2006;52:157-61